Education

XAUUSD — Supply Rejection Sell Setup
Market Context
Gold is trading around $4,122 after breaking above the descending trendline and expanding into the $4,168.769 supply area. The breakout improved short-term momentum, but price failed to maintain the initial push and is now reacting below supply.
The preferred sell idea is not to chase price at the current level. A retracement toward the recent high and supply zone would offer a cleaner location to assess whether sellers can regain control.
SMC View
The trendline breakout created a bullish displacement, but price has moved into a higher-timeframe supply area where buy-side liquidity may attract selling pressure. This makes the upper range the main decision zone.
Because the recent structure is still bullish, a sell setup requires clear confirmation. Bearish rejection followed by a lower-timeframe MSS or CHOCH would indicate that the upward move is losing strength.
Main Trading Scenario
Condition:
Gold retraces toward the $4,140–$4,168.769 supply area and forms a clear bearish rejection. A lower-timeframe bearish MSS or CHOCH is required before entry.
Entry: $4,140–$4,168.769 after bearish confirmation
SL: Above $4,168.769 and the rejection high
TP1: $4,122
TP2: $4,056–$4,068
TP3: $4,029–$4,040
Key Zones to Watch
Current price: $4,122.645
Main sell zone: $4,140–$4,168.769
Buy-side liquidity: $4,202.511
First demand: $4,056–$4,068
Main target: $4,029–$4,040
Invalidation: Acceptance above $4,168.769
Confirmation: Bearish rejection with MSS or CHOCH
Prime Gold View
The sell bias depends on price remaining below the $4,168.769 supply level and confirming bearish structure. The preferred plan is to wait for a retracement rather than sell in the middle of the current range.
If sellers regain control, price could rotate toward $4,056–$4,068 and potentially $4,029–$4,040. Acceptance above supply would weaken the current setup.
No confirmation, no trade.  Short
Short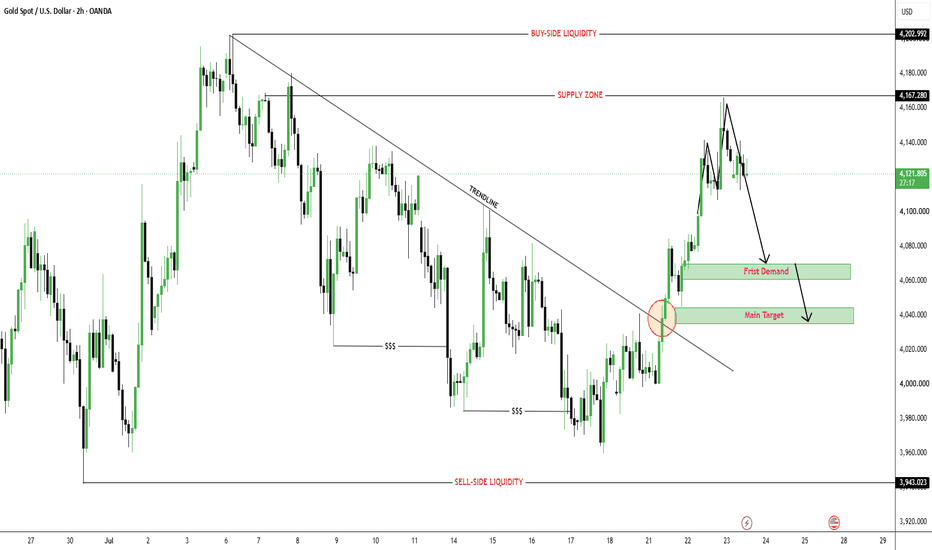
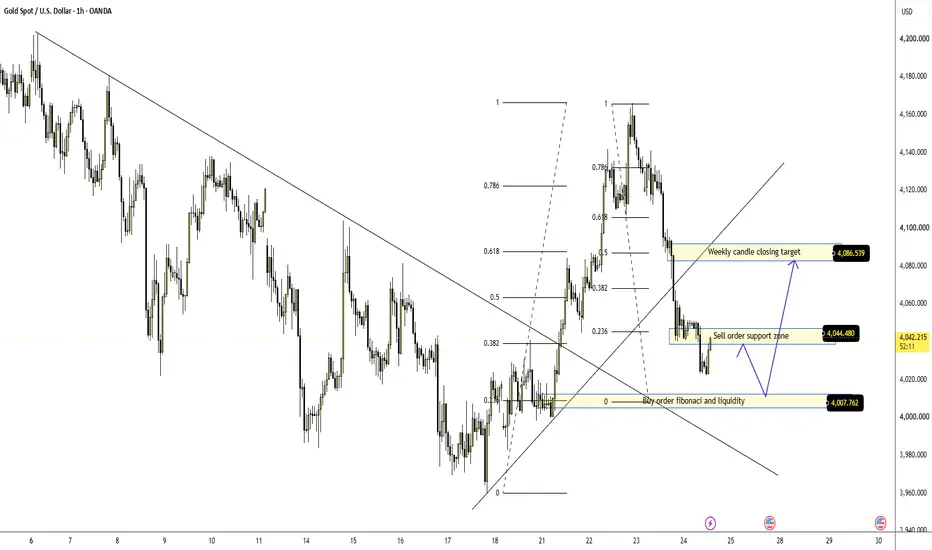
XAUUSD – Gold Pulls Back, But The Weekly Recovery Is Not Over XAUUSD – Gold Pulls Back, But The Weekly Recovery Is Not Over Yet
Gold is pulling back after a strong rejection from the recent high.
Price is currently trading around 4,038 after losing momentum from the upper area near 4,160. Sellers have clearly regained short-term control, and the chart is now testing whether this decline is only a correction or the start of a deeper bearish continuation.
The important point is simple: gold is still above the key buy order Fibonacci zone around 4,007. As long as this area holds, buyers still have a chance to defend the weekly recovery.
FUNDAMENTAL ANALYSIS
Gold is trading softer after dropping from its near two-week high, while the U.S. dollar also remains under pressure due to tariff concerns and profit-taking.
However, sellers have regained short-term control after the recent bearish breakdown signal, and weaker RSI on the daily chart shows that momentum has cooled.
Even with the pullback, gold is still on track for its first weekly gain after three weeks of losses. This makes today’s closing area very important.
TECHNICAL ANALYSIS – SMC + FIBONACCI
From an SMC perspective, gold has reacted strongly from the upper zone and created a clear downside move. The market broke below the short-term rising structure, showing that buyers lost control after the recent recovery.
The current sell order support zone around 4,044 is now acting as the first resistance. If price fails to reclaim this level, sellers may continue to pressure gold lower.
Below price, the key area is the buy order Fibonacci and liquidity zone around 4,007. This is the main decision zone on the chart. If buyers defend this level, gold may create a recovery back toward 4,044 and possibly the weekly candle closing target around 4,086.
The 4,086 area is important because it represents the weekly closing target and short-term recovery resistance. A clean move back above 4,044 would make this target more realistic.
But if gold breaks below 4,007 with strong momentum, the weekly recovery weakens and sellers may continue pushing price toward lower liquidity.
KEY PRICE ZONES
Current price: 4,038
Sell order support zone: 4,044
Buy order Fibonacci / liquidity zone: 4,007
Weekly candle closing target: 4,086
Short-term resistance: 4,044 – 4,086
Lower support if 4,007 fails: 3,980 – 3,960
Bullish recovery valid: Above 4,007
Bearish pressure remains: Below 4,044
Invalidation for recovery view: Below 4,007
TRADING SCENARIOS
Buy Scenario
Buy Zone: 4,007
Entry: Bullish reaction, liquidity sweep, or lower-timeframe CHoCH from the buy order Fibonacci zone
SL: Below 4,007 or below the nearest swing low
TP1: 4,044
TP2: 4,086
Breakout Buy
Condition: Break and hold above 4,044
Target: 4,086
Sell Scenario
Sell Zone: 4,044
Entry: Bearish rejection, failed reclaim, or lower-timeframe bearish CHoCH
SL: Above 4,086
TP1: 4,007
TP2: 3,980 – 3,960
Breakdown Sell
Condition: Clean break below 4,007
Target: 3,980 – 3,960
MY VIEW
Gold is under short-term selling pressure, but the weekly recovery is not fully broken yet.
The chart is now sitting between two important levels: 4,044 above and 4,007 below. If buyers defend 4,007, gold may still recover toward 4,086 before the weekly close. But if price rejects from 4,044 or breaks below 4,007, sellers may take control again.
For me, this is a decision-zone chart.
I do not want to chase the middle. I want to see whether gold can reclaim 4,044, or whether sellers push it back into the 4,007 liquidity zone.
Do you think gold will defend 4,007 and recover toward 4,086, or will sellers break the weekly support?
Long 
Long 
XAUUSD: Wave 5 Selling Targets 3,993Gold is still trading under bearish pressure after breaking below the previous uptrend trendline. From Kelly’s view, the current structure suggests that the market may still be moving inside a bearish Elliott Wave sequence, with wave 5 aiming towards the lower Fibonacci target area.
The key idea is simple: gold may rebound slightly first, but as long as price stays below the sell zone and strong liquidity resistance, the downside structure remains active.
⟡ Market structure
The chart shows gold completed a strong recovery earlier, but that bullish structure weakened after price rejected from the upper area and broke below the rising trendline.
After the breakdown, gold created a clear bearish sequence with lower highs and lower lows. Price is now trading around 4,026, sitting directly under the 4,028–4,032 sell zone.
This area is important because it may act as the wave 4 retest before wave 5 continues lower. If sellers defend this zone, gold may rotate back towards the 4,000 support, then the 3,993 Fibonacci 2.618 target zone.
The strong liquidity zone around 4,045–4,052 is the key resistance above. If gold cannot reclaim this area, the bearish wave structure remains in control.
➤ Key levels
◌ 4,028–4,032: sell zone and wave 4 retest area
◌ 4,045–4,052: strong liquidity resistance
◌ 4,026: current price reaction area
◌ 4,000: first support and downside checkpoint
◌ 3,990–3,995: Fibonacci 2.618 target / possible wave 5 end
◌ Above 4,052: area where the bearish setup starts to weaken
⌁ Elliott Wave view
From an Elliott Wave perspective, gold appears to be developing the final bearish leg of a 5-wave decline.
Wave 1 started after price lost bullish momentum from the upper area.
Wave 2 created a corrective rebound but failed to change the structure.
Wave 3 delivered the stronger bearish push below the trendline.
Wave 4 may now be forming around the 4,028–4,032 sell zone.
If this zone holds, wave 5 may continue lower towards 3,990–3,995.
The Fibonacci 2.618 level near 3,993 is important because it aligns with the projected wave 5 completion zone. This makes the lower support area a key target for sellers, but also a zone where a short-term reaction may appear.
▸ Trading scenario
Preferred scenario: wait for price to retest the sell zone and show bearish confirmation.
Sell zone: 4,028–4,032 if rejection appears
Stop loss: above 4,052 or above the confirmed rejection high
Take profit 1: 4,000
Take profit 2: 3,993
Take profit 3: 3,980 if wave 5 extends strongly
Alternative scenario: if gold breaks above 4,052 and holds with strong acceptance, the bearish wave 5 setup weakens. In that case, price may move into a larger corrective recovery before the next structure becomes clear.
⌁ Kelly’s view
For Kelly, this is still a bearish Elliott Wave setup. Gold has already broken the uptrend line, and the recovery attempts are still happening below resistance.
The cleanest plan is to wait for price reaction around 4,028–4,032. If sellers defend this zone, the next move may continue towards the Fibonacci wave 5 target near 3,993.
Gold remains weak below the sell zone. If resistance holds, wave 5 may continue lower before a stronger reaction appears.
Share your view below. Short 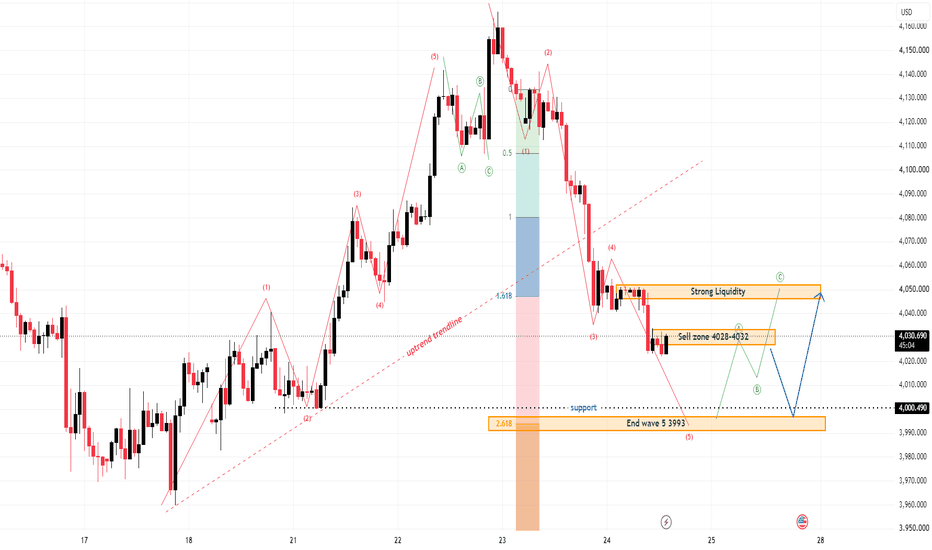
XAUUSD: Sellers Took the High, 4,000 Is Next XAUUSD: Sellers Took the High, 4,000 Is Next
Market Context
Gold is trading around 4,027 after a sharp rejection from the Weak High Sell Zone. The latest move shows that sellers are still active and the short-term structure is leaning bearish again.
Gold prices in India also softened, with the market showing weakness in local pricing as well. This confirms that the current pressure is not only visible on XAUUSD, but also reflected in broader gold demand conditions.
The main story is simple: gold rejected from the high, sellers are pushing strongly, and 4,000 - 4,010 is now the next decision zone.
Technical Structure
Gold is currently moving lower after losing momentum from the weak high area. The chart shows a strong selloff from the upper zone, and price is now approaching the main pullback support.
The short-term reaction zone around 4,045 - 4,050 is now the first area where sellers may defend if price rebounds. If gold retests this zone and fails, downside pressure may continue.
The key support below is 4,000 - 4,010. If this area holds, buyers may attempt a short reaction. But if it breaks, price can continue toward the Secondary Support Zone and the Deep Demand Zone around 3,965 - 3,990.
The Weak High Sell Zone remains the major resistance above. As long as price stays below that area, the market is still controlled by sellers.
Key Levels
Current Price: 4,027
Short-term Reaction Zone: 4,045 - 4,050
Main Pullback Support: 4,000 - 4,010
Secondary Support Zone: 3,990 - 4,000
Deep Demand Zone: 3,965 - 3,990
Weak High Sell Zone: 4,145 - 4,165
Bearish Continuation: Below 4,000
Bullish Recovery: Above 4,050
Trading Plan
Sell Scenario
Entry: 4,045 - 4,050
SL: Above 4,065
TP: 4,010 / 4,000 / 3,990
Condition: Price rebounds into the short-term reaction zone and gets rejected. Sellers regain momentum, buyers fail to reclaim 4,050, and price starts moving lower again.
Breakdown Sell
Entry: Below 4,000
SL: Above 4,020
TP: 3,990 / 3,980 / 3,965
Condition: Price breaks below the main pullback support, retest fails, and bearish momentum continues. This would confirm that sellers are still in full control.
Buy Reaction
Entry: 4,000 - 4,010
SL: Below 3,990
TP: 4,027 / 4,045 / 4,050
Condition: Price must hold the main support zone and show clear bullish confirmation. This is only a short-term reaction buy, not a full reversal.
Deep Demand Buy
Entry: 3,965 - 3,990
SL: Below 3,940
TP: 4,000 / 4,027 / 4,050
Condition: Price drops into the deep demand area and forms a strong bullish rejection. Buyers need a clear reaction before any long setup becomes valid.
Overall Bias
Gold is bearish in the short term after rejecting from the weak high sell zone. Sellers are still leading the move while price remains below 4,045 - 4,050.
If 4,000 - 4,010 holds, a small bounce can appear. But if this support breaks, gold may continue lower toward 3,990 and 3,965.
Best approach: prioritize watching sell reactions on rebound. Only consider buying if price shows a clear reaction from support or deep demand.
Will buyers defend 4,000, or will sellers push gold deeper into demand?
Short 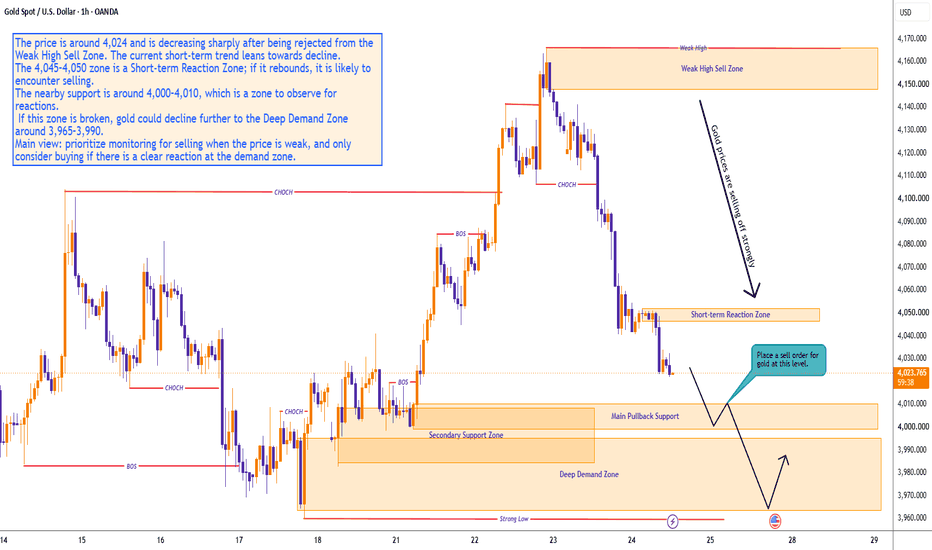
Short 
Gold H1: Is $4,000 the Perfect Buy Zone?Macro Driver: The US Dollar Index (DXY) holds a strong bullish undertone near 101.30, bolstered by surging oil prices above $100/bbl amidst ongoing Middle East geopolitical friction. Renewed inflation concerns are driving market expectations for sustained hawkish Fed monetary policy, temporarily capping immediate Gold upside and engineering a localized corrective pullback.
• Market Condition: Institutional order flow on the H1 timeframe is delivering a calculated discount re-accumulation sequence. Following the major Sell-Side Liquidity (SSL) sweep at $3,960, Smart Money is allowing price to compress before tapping key lower demand arrays to fuel the next upward expansion.
Technical Context
• Structure: Ascending Channel & Bullish Re-accumulation (H1). Gold is delivering higher-high and higher-low prints within a rising channel structure, currently resting at $4,037.900.
• Liquidity & Imbalance: Price is actively rejecting upper channel resistance. An internal Fair Value Gap (FVG) sits at $4,030 - $4,035, with a major institutional demand floor at the $4,000 - $4,005 psychological base. Above, unmitigated supply FVG arrays sit empty between $4,060 - $4,070 and $4,078 - $4,085.
Key Zones
• Upper Supply Array (BSL Target): 4,078.000 - 4,085.000
• Primary FVG Target: 4,060.000 - 4,070.000
• Internal FVG (Minor Support): 4,030.000 - 4,035.000
• Extreme Discount Demand (Strong Floor): 4,000.000 - 4,005.000
• Structural Base Low: 3,960.000
Trading Plan (IF–THEN)
• IF price delivers a minor bounce off $4,030 followed by a deeper flush into the Extreme Discount Demand ($4,000 - $4,005) -> THEN look for lower-timeframe (M5/M15) bullish CHoCH validation to execute Long positions.
• IF the trade triggers, primary targets are set at the channel breakout, extending toward the $4,060 - $4,070 FVG and $4,080 Buy-Side Liquidity.
• IF price invalidates the setup with a decisive H1 candle close below 3,995 -> THEN the bullish continuation setup is postponed.
MMFLOW View
• Bias: Bullish Expansion on Discount Mitigation. Avoid chasing long positions at mid-channel levels. The highest probability edge lies in waiting for the retail stop-run into the $4,000 demand floor before executing alongside institutional order flow.
Short 
Long 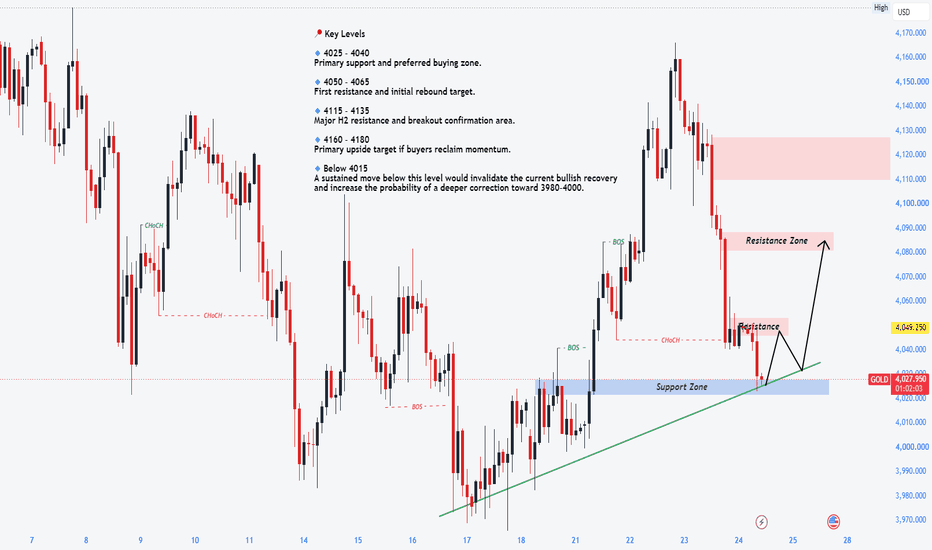
XAUUSD 4H — Rejection at Trendline, Bears Take ControlGold delivered a textbook rejection from the long-term descending trendline, confirming that sellers are still defending higher prices. The recent breakdown below the highlighted support zone has shifted short-term momentum back in favor of the bears.
🔴 Bearish Scenario:
As long as price remains below 4,040–4,060, selling pressure is likely to continue. A clean break below the recent swing low could accelerate the move toward the 3,920 support zone.
🟢 Bullish Scenario:
If buyers reclaim the broken support and close back above 4,060, the current breakdown may turn into a false breakout, opening the door for another test of the descending trendline.
📊 Why This Setup Matters:
• Strong rejection from the long-term downtrend line
• Former support has now become resistance
• Lower highs continue to favor bearish market structure
• Momentum remains with sellers unless key resistance is reclaimed
⚠️ Smart Money Insight:
Breakdowns often attract aggressive sellers, but the highest-probability trades usually come after a retest of broken support as new resistance. Watch how price reacts before chasing the move.
⏳ Trading Plan:
Patience pays. Monitor price action around 4,040–4,060. Rejection from this zone strengthens the bearish case, while a strong reclaim would invalidate the immediate downside outlook.
🔥 Bottom Line:
The trendline rejection has shifted control back to the bears. Until buyers reclaim key resistance, the path of least resistance remains lower, with 3,920 standing out as the next major downside target.
The trend has spoken… now let price confirm the next move. 📉🚀
#XAUUSD #Gold #TradingView #PriceAction #SmartMoney #Forex #Bearish #TechnicalAnalysis Short 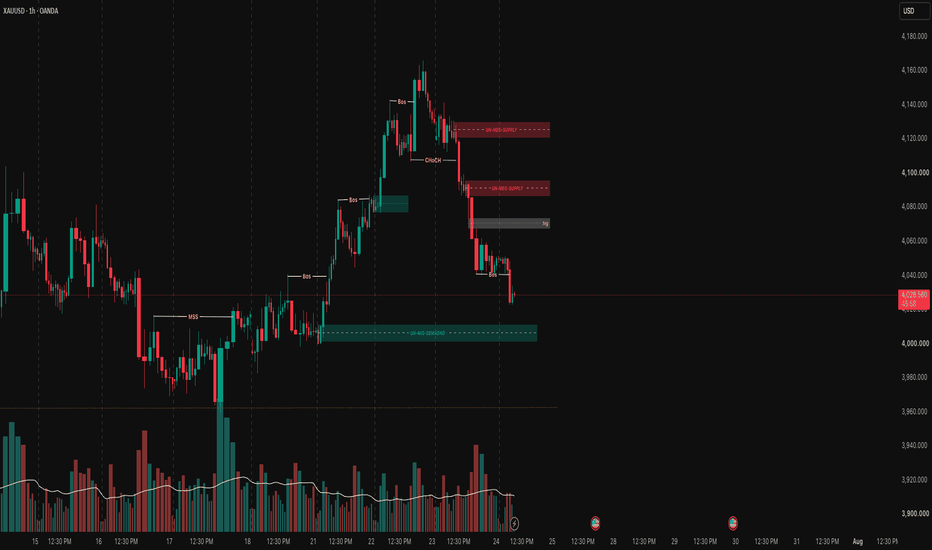
XAUUSD Forms Classic Head & Shoulders Pattern: Wait for retestXAUUSD had been moving in a strong uptrend, with buyers clearly in control. Each push higher carried solid momentum, but near the top, that strength began to fade.
The first pullback formed the left shoulder and gave the earliest sign of hesitation. Buyers then tried to regain control, driving price to a new high and forming the head, but the move failed to continue. That lack of follow-through was an important warning.
When price pulled back again and recovered into a lower high, the right shoulder was formed. This time, sellers responded with more conviction, showing that the balance was beginning to shift.
The break below the neckline is what confirms the pattern. If price now retests that level and gets rejected, it could offer a strong bearish continuation setup, with 4,075 as the next downside target. Short 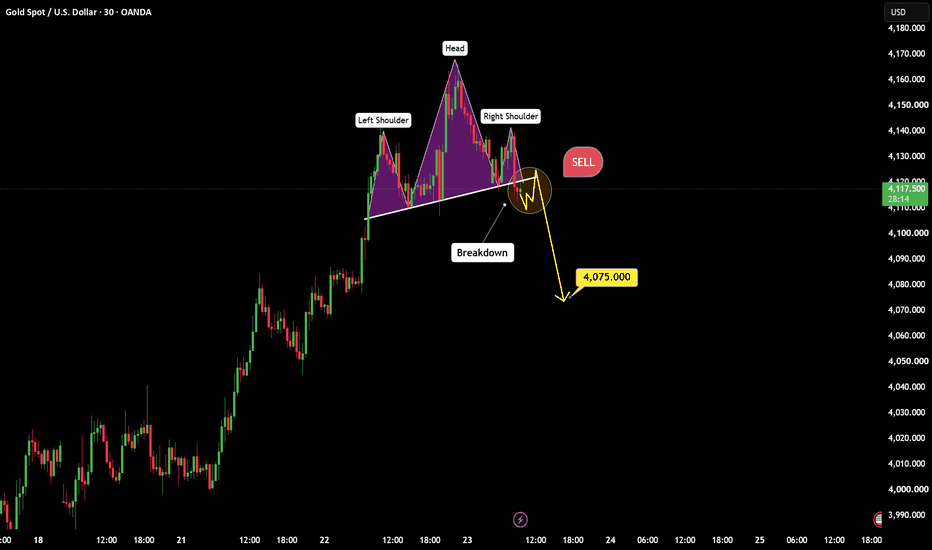
Short 
XAUUSD — 4,131 Trap or 4,071 Retest?Gold is showing early weakness after failing to extend above the recent high area.
Price is now trading around 4,115 - 4,120, below the OB sell zone near 4,131.
This is where the chart becomes interesting.
Because the short-term bullish move is still visible.
But buyers are starting to lose momentum near resistance.
The question today is simple:
Is gold only taking a small pause, or is the market preparing for a deeper retest?
The simple read
Gold recently created a strong upside move from the 4,000 area.
But after reaching the upper zone, price started forming lower reactions near resistance.
The 4,131 area is now the key OB sell zone.
As long as gold stays below 4,131, sellers may still try to push price lower.
The first weak line is around 4,110.
If this level breaks clearly, gold may continue toward the 4,071 OB buy / Fibo reaction zone.
A deeper support area is waiting near 4,027, which is also marked as a liquidity buy zone.
Key price zones
Current price area: 4,115 - 4,120
OB sell zone: 4,131
Weak line / short-term support: 4,110
OB buy / Fibo reaction zone: 4,071
Liquidity buy zone: 4,027
Bullish recovery improves above: 4,131
Trading plan
📉 Bearish retest scenario
If gold stays below 4,131 and loses 4,110:
The correction may continue toward 4,071.
This would be a normal retest after the previous strong bullish move.
I do not want to chase the sell too late.
The cleaner plan is to wait for confirmation below 4,110 or rejection from 4,131.
📈 Buy reaction scenario
If gold reaches 4,071 and shows a clean bullish reaction:
Buyers may try to rebuild the recovery structure.
Price could attempt to move back toward 4,110 and 4,131.
But without reaction from 4,071, there is no reason to force a buy.
📉 Deeper pullback scenario
If 4,071 fails clearly:
Gold may continue lower toward 4,027.
This is the deeper liquidity buy zone on the chart.
A strong reaction from 4,027 could become important later, but confirmation is still needed.
Tiara’s View
Gold is not fully bearish yet.
But the short-term momentum is no longer clean while price stays below 4,131.
For today, I am watching 4,110 first.
If 4,110 breaks, 4,071 becomes the main decision zone.
If gold reclaims 4,131, the bearish pressure weakens and buyers may try to recover again. Short 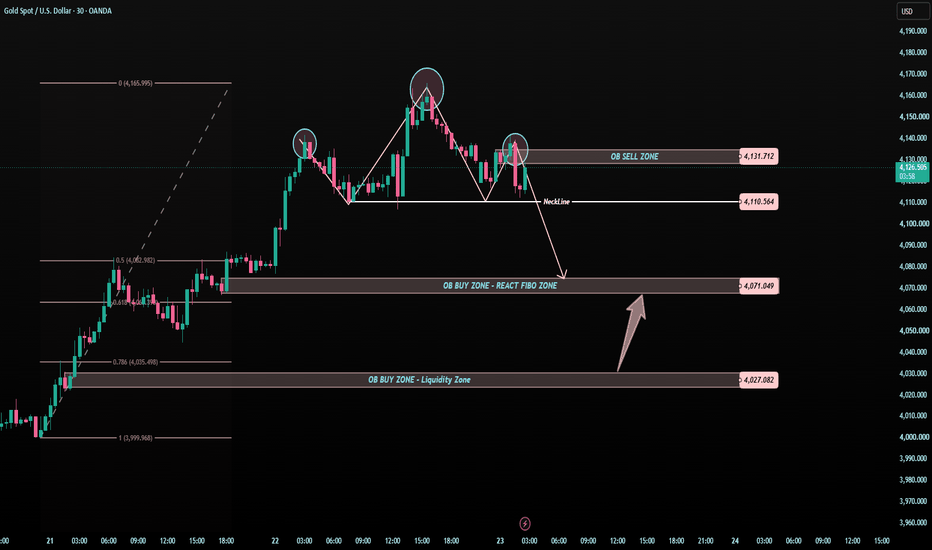
 Short
Short
Resistance Rejection Points to Bearish ContinuationMarket Structure
chart shows a strong bearish retracement after a sharp rally toward the 4,150–4,160 area. Price has fallen back into a previously tested resistance/supply zone around 4,050–4,060, where the chart anticipates another rejection.
The overall idea is based on resistance turning into a selling opportunity.
Key Levels
Resistance Zone: 4,050–4,060
Previously acted as support.
Now being retested from below, making it a potential supply zone.
Entry (Sell):
Around 4,055–4,060 after bearish confirmation (rejection candle, engulfing candle, or lower high).
Stop Loss:
Above 4,087.62
This gives room above the resistance and protects against a false breakout.
Target:
3,977.60
Matches the highlighted support area where buyers previously entered.
Trade Logic
The setup suggests:
Price retraces into resistance.
Sellers defend the zone.
Momentum resumes downward.
Price revisits the previous support around 3,980.
This is a classic pullback-to-resistance continuation trade.
Risk-to-Reward
Approximate values:
Risk: ~28–32 points
Reward: ~75–80 points
Risk-to-Reward Ratio: Approximately 1:2.5 to 1:3, which is generally favorable if the setup is confirmed.
Confirmation Signals to Watch
Before entering, look for:
Bearish engulfing candle on the 1H timeframe.
Long upper wick rejection.
Lower highs forming within the resistance zone.
Increasing bearish volume or momentum.
Failure to close above 4,060.
Invalidation
The bearish setup becomes weaker if:
A 1H candle closes decisively above 4,060.
Price breaks and holds above 4,088, indicating buyers have regained control.
Suggested Chart Title
XAU/USD 1H: Resistance Retest Signals Potential Drop Toward 3,977
Alternative titles:
Gold 1H Bearish Setup: Sell the Resistance Retest
XAU/USD Technical Analysis: Pullback into Supply Zone
Gold Forecast: Resistance Rejection Targets 3,977 Support
XAU/USD Short Trade Setup | 1:3 Risk-to-Reward Opportunity Short 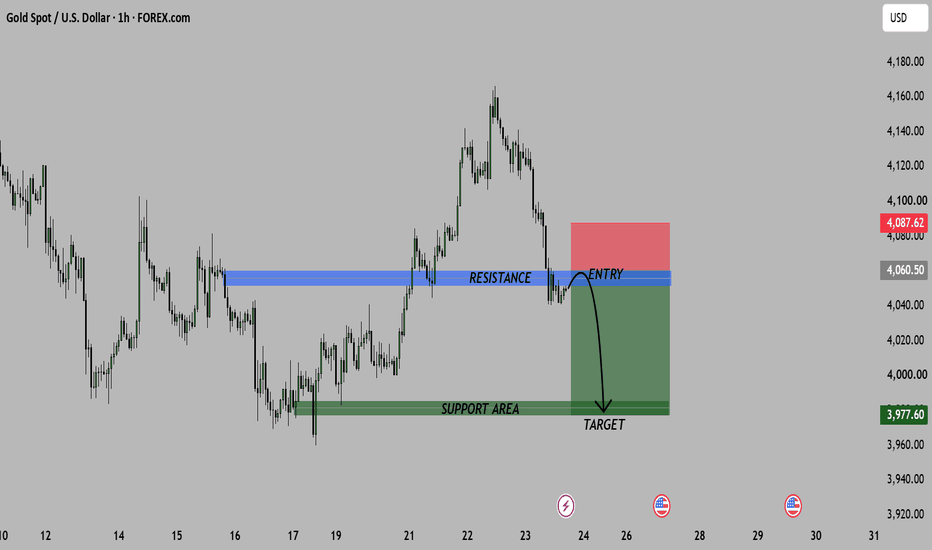
Gold Analysis & Trading Strategy | July 24✅ 4-Hour Trend Analysis
On the 4-hour chart, gold has fallen below the MA5, MA10, and MA20, and has also moved back below the MA200. The short-term structure has clearly weakened, shifting from a bullish rebound into a consolidation phase with a bearish bias.
The key support level to watch is around 4035. If this level holds, gold may experience a technical rebound. However, unless the price recovers the 4082–4100 zone and stabilizes above it, any upward move should still be viewed as a corrective recovery after the decline rather than the beginning of a new bullish trend.
If gold decisively breaks below 4035 on the 4-hour chart, the next downside target may be the 3993–3989 area.
✅ 1-Hour Trend Analysis
On the 1-hour chart, gold has continued to form lower highs and lower lows since falling from the 4166 high. It has also broken below the previous ascending trendline and the 4082 support level, confirming a clear short-term bearish trend.
However, the price is currently approaching the lower Bollinger Band and has begun consolidating around 4040. This suggests that an oversold technical rebound may occur following the recent decline.
The key resistance zone is located between 4055 and 4065. If the price fails to recover above this area, the possibility of another decline will remain. Short-term selling pressure would only ease significantly if the price breaks above 4082 and holds firmly above 4090.
🔴 Key Resistance Levels
● 4055–4065: Short-term resistance zone
● 4082–4090: Key resistance zone
● 4100–4125: 4-hour resistance zone
● 4135–4160: Major resistance zone
🟢 Key Support Levels
● 4040–4035: Short-term support zone
● 4023–4015: 1-hour lower Bollinger Band support
● 3993–3989: 4-hour lower Bollinger Band zone
● 3959–3950: Previous low support zone
✅ Trading Strategy Reference
🔰 Sell on Rebounds
👉 Sell zone 1: 4055–4065
👉 Sell zone 2: 4082–4090
🎯 Targets: 4035 → 4023 → 3993
🛑 If the price breaks above 4100 decisively and holds firmly above it, the short-term bearish strategy should be reassessed.
🔰 Short-Term Buying Near Support
👉 Buy zone 1: 4035–4023
👉 Buy zone 2: 3993–3989
🎯 Targets: 4055 → 4082 → 4090
🛑 Long positions are counter-trend rebound trades and should only be considered after a clear bullish reversal or price stabilization signal appears. If the price breaks decisively below 3989, avoid blindly buying while the decline continues.
🔔 If you find this analysis helpful, please like, share, and stay tuned for future updates. Your support motivates me to continue sharing professional market insights. Wishing everyone successful trades and consistent profits!
Bullish Recovery Setup After Sharp PullbackThe 2-hour XAU/USD chart shows a strong bullish impulse followed by a sharp corrective decline from the recent swing high. Price has rejected the upper resistance zone around 4,133–4,145, where multiple sell signals appeared, triggering profit-taking and a healthy retracement. Despite this decline, the broader market structure remains constructive as long as the key support area continues to hold.
Market Structure
Gold recently established a higher high before encountering strong resistance near 4,145. The rejection pushed price back toward the previous breakout region around 4,000–4,010, which now acts as a critical demand zone. This area also aligns with previous consolidation and may provide a base for renewed buying interest.
Key Technical Levels
Major Resistance: 4,133 – 4,145
Bullish Target: 4,158 – 4,160
Primary Support: 4,001 – 4,010
Bearish Invalidation: Sustained close below 4,000
Price Action & Momentum
The recent selloff appears corrective rather than trend-changing. Price has retraced toward a significant support level after failing to maintain momentum above resistance. If buyers defend the 4,001 support zone, a bullish reversal could develop, supported by improving trend structure and potential momentum recovery.
The projected path suggests an initial consolidation near support, followed by a rebound toward the previous highs. A confirmed break above 4,145 would strengthen bullish momentum and open the door to the next upside objective near 4,158.
Bullish Scenario
Price holds above 4,001–4,010.
Bullish candlestick confirmation appears near support.
Break above 4,133–4,145 confirms renewed buying pressure.
Upside target extends toward 4,158 and potentially higher.
Bearish Scenario
If support around 4,001 fails decisively with strong bearish volume, the current bullish outlook would weaken, exposing the market to a deeper correction toward lower demand zones.
Trading Outlook
The overall bias remains cautiously bullish while price trades above the 4,001 support. Rather than chasing the recent decline, traders may look for confirmation of buyer strength around support before targeting a recovery toward 4,158. A clean breakdown below support would invalidate this bullish setup and shift short-term sentiment in favor Long 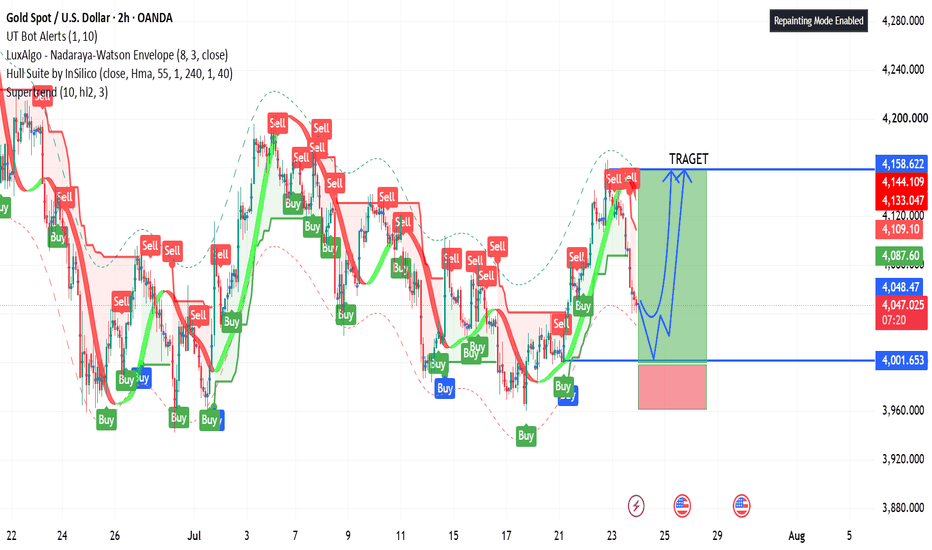
Long 
Long 
GOLD XAUUSD Extreme POI Buy Setup–Liquidity Sweep Completed
Gold experienced an aggressive bearish expansion after failing to sustain above the 4,120 region, sweeping sell-side liquidity and driving price directly into the Extreme Point of Interest (POI) around the 4,030–4,040 zone. This area aligns with a previously unmitigated demand zone and represents a high-probability reaction point.
From a market structure perspective, the recent decline appears overextended, suggesting that institutional participants may use this discount level for accumulation. The current candle behavior indicates seller exhaustion, while the liquidity sweep beneath short-term lows increases the probability of a counter-trend move.
A sustained hold above the Extreme POI could trigger a bullish market structure shift (MSS) on the lower timeframes, opening the path toward:
Traders should monitor for bullish confirmation signals such as engulfing candles, higher lows, or a break of the immediate bearish structure before committing to long positions. As long as price remains above the POI, the risk-to-reward profile continues to favor buyers.
Long