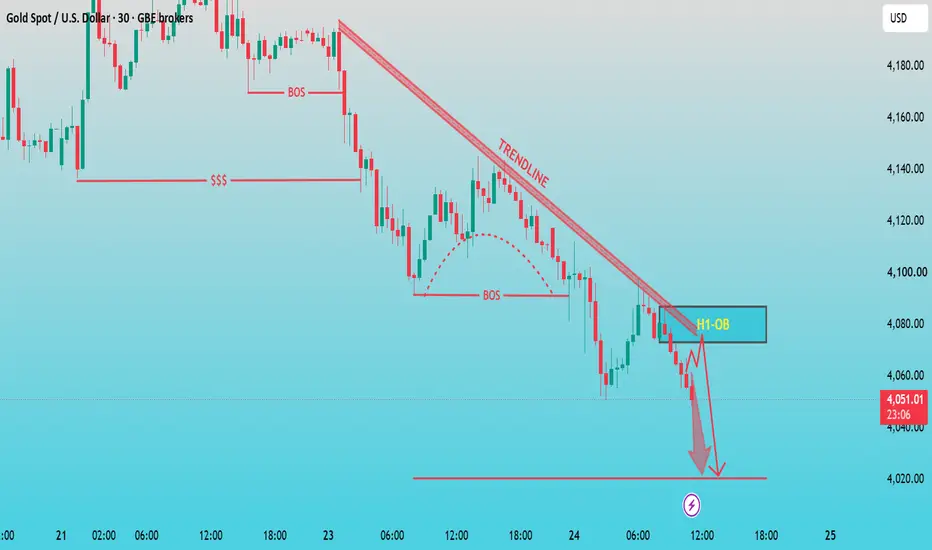
Long
Long
Gold Analysis & Trading Strategy | June 25🌐Hello traders! I’m Jack Blackwell, with 15 years of experience in analysis and trading in the futures and forex markets. Below are my technical analysis views based on the current XAUUSD (4H and 1H timeframes) chart structure.
✅ 4-Hour Trend Analysis
From the 4-hour chart, gold remains in a strong bearish trend. The recent sharp sell-off pushed gold to a new swing low near 3959, where a modest rebound has emerged. However, the current rebound appears to be driven mainly by short-covering and profit-taking rather than genuine bullish accumulation. Unless gold can recover above the 4025–4068 resistance area, the broader trend remains bearish.
✅ 1-Hour Trend Analysis
On the 1-hour chart, gold continues to form a clear pattern of lower highs and lower lows.After falling sharply toward the 3959 area, the market attempted a technical rebound, but price remains below the MA20 and below the previous breakdown levels.
In the short term, gold may enter a consolidation phase between 3960 and 4025, but any rebound toward resistance zones is likely to attract renewed selling pressure unless buyers can reclaim and hold above 4025.
🔴 Key Resistance Levels
● 4025–4050 (Immediate resistance zone)
● 4068–4095 (Previous support turned resistance)
● 4132–4145 (Major bearish control zone)
🟢 Key Support Levels
● 3960–3950 (Current key support zone)
● 3920–3900 (Psychological support zone)
● 3850–3830 (Next downside target zone)
📈 Trading Strategy Reference
🔰 Short Position Strategy (Sell the Rally)
👉 Sell Zone 1: 4025–4040
👉 Sell Zone 2: 4070–4090
🎯 Targets: 4000→ 3960 → 3920
📍 Rationale:
• Both 4H and 1H structures remain bearish.
• Previous support levels have turned into resistance.
• Price remains below all major moving averages.
🔰 Long Position Strategy (Oversold Rebound)
👉 Buy Zone 1: 3960–3950
👉 Buy Zone 2: 3920–3900
🎯 Targets: 3995 → 4025 → 4068
📍 Rationale:
• Price is testing a major support area.
• Market is becoming heavily oversold.
• Potential exists for a short-term technical rebound.
⚠️ Trend Outlook
👉 If gold breaks below 3950 and closes beneath this level on the 4-hour chart, bearish momentum could accelerate further toward 3920 → 3900 → 3850.
👉 If price can reclaim 4025 and hold above it, a short-term recovery toward 4068–4095 may develop.
🔔 Gold market conditions change rapidly, and seizing opportunities is essential!
If you feel uncertain or confused about the current market direction, you're always welcome to discuss the market with me. I can provide real-time trading signals, professional strategy support, and in-depth market analysis to help you make more informed trading decisions.
We are committed to helping you improve your trading efficiency, navigate market fluctuations with greater confidence, and achieve more stable and consistent profits over the long term. XAUUSD: Huge Trading Chance
If you missed gold’s rally from $3,000 to $5,600, and also missed its drop from $5,600 down to the current $4,000 level, you must not miss this upcoming trading opportunity. Gold is now trading at
$4,000, and many traders believe this price marks the bottom of the current downtrend.
However, my analysis shows gold will keep falling to the $3,500–$3,200 zone before bottoming out and staging a rebound.
For now, we need to wait patiently for clear reversal signals. Once a bottom forms, we will go long gold for a long-term hold and wait for the bull run to generate substantial profits.
This analysis is for reference only. Please implement strict risk management. I will update my trading strategy promptly if market conditions shift. Let’s seize this great opportunity together.  Short
Short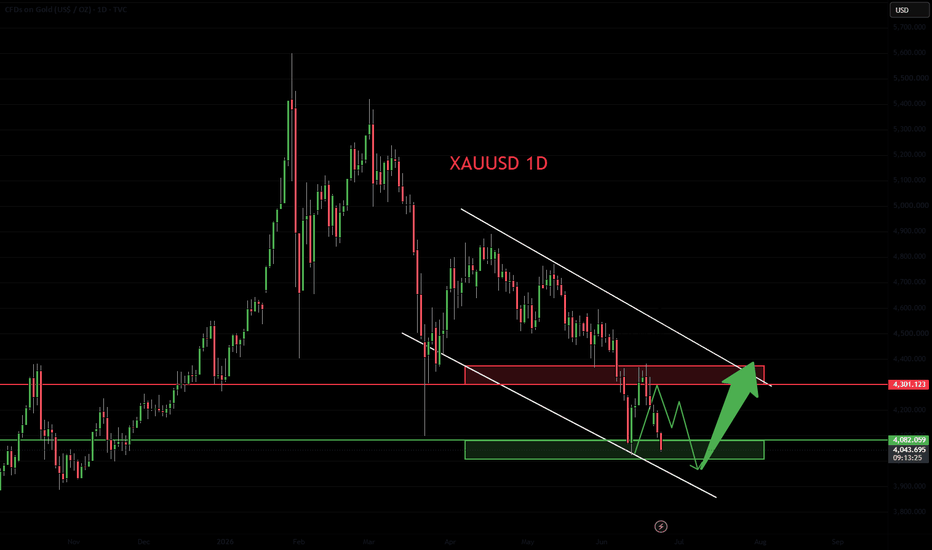
Silver Squeeze: Breakout or Sharp Breakdown?Silver is moving inside a triangle pattern on the 4-hour chart. XAGUSD is getting squeezed between resistance coming down from around 96 and support coming up from around 61. Right now, it’s trading near 73 to 74 , which is the middle of the range and not a good place to trade since there is no clear direction.
Recent price moves have been slow and messy, showing the market is still in a correction and not a strong trend.
From a wave view, this looks like a complex correction, and the triangle seems close to finishing. There could be one more move up, possibly a fake breakout, to trap buyers before price drops again.
Unless silver clearly breaks and holds above resistance, the overall view is still bearish. If the XAGUSD gets rejected from the upper area, it could fall toward 60 to 55 .
For now, expect choppy and confusing moves. It’s better to wait for confirmation instead of guessing early.
We will update further information soon! Short 
XAUUSD 4H – High-Probability Bullish Reversal SetupXAUUSD is trading at a critical support zone near the lower boundary of a descending channel. After an aggressive sell-off, price has swept liquidity below recent lows and is now showing signs of rejection from a key demand area.
The highlighted entry zone around 4,023 aligns with channel support, creating a favorable risk-to-reward opportunity for a potential bullish recovery. As long as buyers defend this level, gold could stage a corrective rally toward the upper boundary of the channel.
📊 Technical Highlights
Price is testing major channel support.
Liquidity grab below recent lows followed by a strong rebound candle.
Potential bullish reversal forming at a high-confluence area.
Risk-to-reward setup favors upside continuation if support holds.
🎯 Bullish Targets
Target 1: 4,100
Target 2: 4,200
Target 3: 4,341
🛑 Stop Loss
3,928
💡 Trading Outlook
A sustained move above the entry zone could attract fresh buyers and fuel a recovery toward channel resistance. However, a decisive break below 3,928 would invalidate the bullish setup and open the door for further downside pressure.
Conclusion
Gold is approaching a key turning point. The current price action suggests a potential bullish reversal from channel support, with 4,341 acting as the primary upside objective. Traders should monitor price confirmation and volume before entering the market.
#XAUUSD #Gold #Forex #TradingView #TechnicalAnalysis #PriceAction #GoldTrading #BullishReversal #SupportAndResistance #TradingSetup #SmartMoneyConcepts #MarketStructure Long 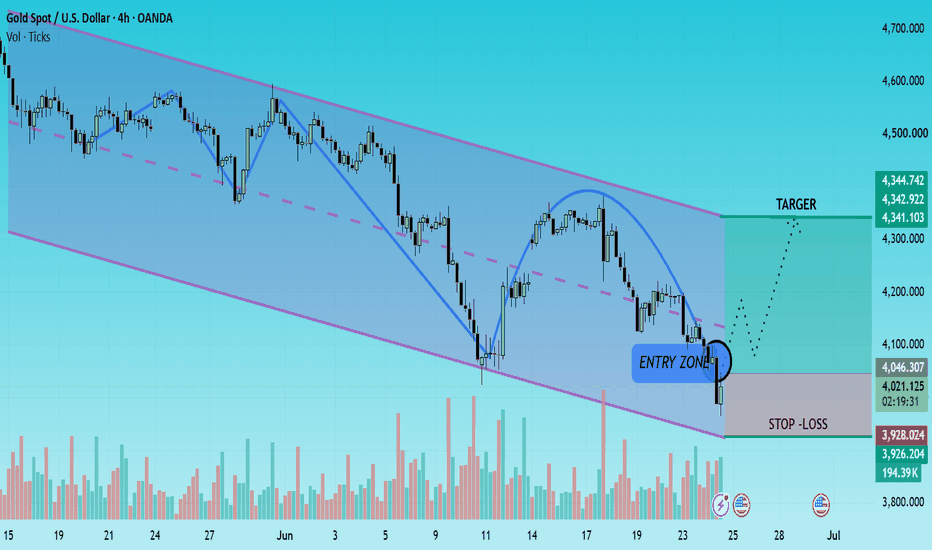
 Education

Education

Long 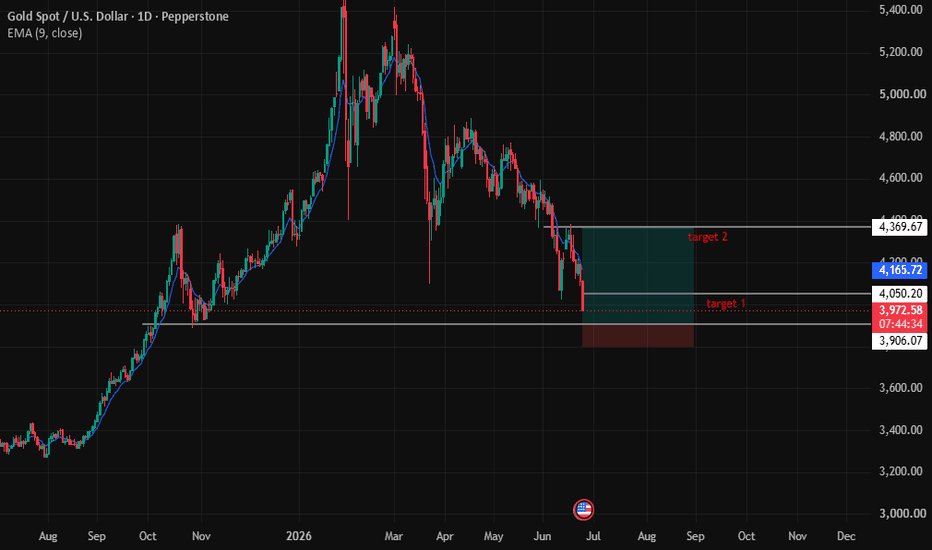
Short 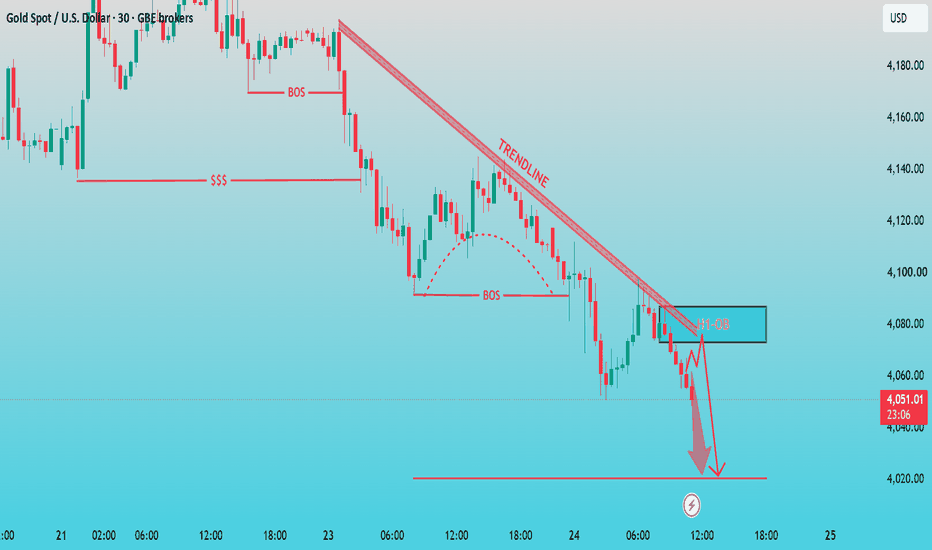
Short 
Long 
Short 
Short 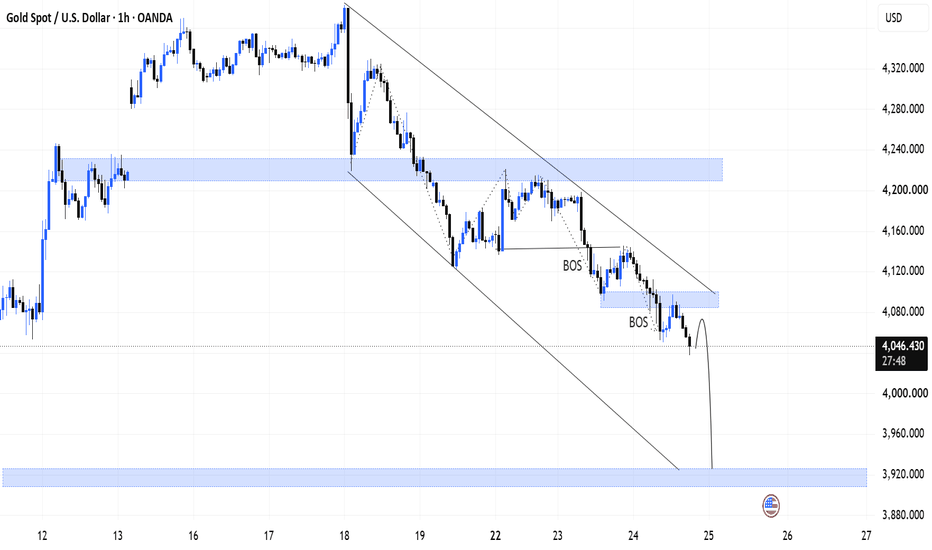
# XAU/USD (Gold Spot) – 45-Minute Chart Analysis### Market Structure Overview
On the 45-minute timeframe, XAU/USD continues to exhibit a strong bearish market structure following a significant rejection from the 4,350 region. The broader trend remains firmly under seller control, as evidenced by the consistent formation of lower highs and lower lows throughout the recent trading sessions. The sharp decline that originated from the upper resistance area has not yet shown any meaningful signs of trend reversal, indicating that bearish momentum remains the dominant force in the market.
Price action has steadily compressed toward the 4,040–4,000 support zone, a key psychological and technical area that may determine the next major directional move. Although buyers have attempted several short-term recoveries, each rally has been met with renewed selling pressure, preventing the market from establishing a sustainable bullish structure.
### Price Action Analysis
The recent sequence of candles highlights persistent downside pressure, with sellers successfully defending every significant retracement. The market remains below all recent swing highs, confirming that bulls have yet to regain control.
A notable characteristic of the current structure is the weakening nature of bullish corrections. Each rebound is becoming increasingly shallow, suggesting that institutional sellers may still be active and willing to distribute positions at higher levels.
The projected path on the chart suggests a potential corrective bounce toward nearby resistance before another bearish impulse develops. Such a scenario would align with the prevailing market structure, where pullbacks are viewed as opportunities for sellers to re-enter the market rather than indications of a trend reversal.
### Support and Resistance Zones
**Immediate Support:** 4,040
**Psychological Support:** 4,000
**Extended Bearish Target:** 3,980 – 3,950
**Near-Term Resistance:** 4,080 – 4,120
**Major Resistance Zone:** 4,180 – 4,220
The 4,000 level represents a major psychological support area and could attract short-term buying interest. However, if sellers manage to secure a decisive break below this zone, the market may accelerate toward lower support levels as stop-loss orders and fresh bearish positions enter the market.
On the upside, the 4,080–4,120 region serves as the first significant resistance. A failure to reclaim this area would reinforce the bearish outlook and increase the probability of another downward leg.
### RSI Momentum Analysis
The Relative Strength Index (RSI 14) is currently trading near 30, positioning momentum close to oversold territory. While oversold conditions can often trigger temporary relief rallies, traders should remain cautious about interpreting this as a bullish reversal signal.
In strong trending markets, RSI can remain oversold for extended periods while price continues to decline. Therefore, the current RSI reading should be viewed as a warning of potential short-term volatility rather than confirmation of a trend change.
The RSI remaining below the neutral 50 level further supports the broader bearish bias and confirms that sellers continue to dominate market sentiment.
### Trading Scenario Outlook
The primary bearish scenario remains valid as long as price stays below the 4,120–4,180 resistance region.
A short-term rebound toward resistance is possible due to oversold conditions, but unless buyers can break above key structural resistance and establish a higher high, the broader trend remains bearish.
Should sellers successfully defend resistance and regain momentum, the next objective would likely be the psychological 4,000 support level. A confirmed breakdown below this area could open the door for a deeper decline toward 3,980 and potentially 3,950.
From a market structure perspective, the path of least resistance continues to favor the downside until clear evidence of accumulation and bullish reversal emerges.
### Conclusion
XAU/USD remains under significant bearish pressure on the 45-minute timeframe, with price action continuing to respect a well-established downtrend structure. Although oversold RSI conditions may encourage a temporary corrective rally, the overall technical outlook remains negative while price trades below key resistance levels. Traders should closely monitor the 4,000 psychological support area, as a breakdown below this level could trigger the next phase of bearish continuation.
### Tags
#XAUUSD #Gold #GoldAnalysis #GoldTrading #TechnicalAnalysis #Forex #ForexTrading #PriceAction #MarketStructure #BearishTrend #BearishContinuation #TradingView #SupportAndResistance #RSIAnalysis #CommodityTrading #ForexAnalysis #DayTrading #SwingTrading #ChartAnalysis #MarketOutlook #TradingSignals #SmartMoneyConcepts #InstitutionalTrading #TechnicalForecast #PreciousMetals #FinancialMarkets #TrendAnalysis #SellSetup #RiskManagement #TradingEducation
Short 
Short 
USD attracts flows, gold's 401x support fragile.Gold is now testing one of the final support zones after several sessions of relentless selling pressure. What stands out is not the technical breakdown itself, but the macro backdrop behind it.
Over the past few weeks, many factors that would normally support gold have failed to generate sustainable buying interest. Geopolitical tensions have eased following ceasefire and peace-negotiation headlines, oil prices have cooled, and risk sentiment has improved across broader markets. As a result, capital continues rotating away from defensive assets and back toward the U.S. dollar.
The key driver remains the same: USD strength and higher-for-longer Fed expectations. Even after recent economic releases, the market still sees limited urgency for aggressive rate cuts. That keeps Treasury yields elevated and maintains demand for the dollar, creating persistent pressure on gold.
From a technical perspective, gold has reached a critical support area around the lower boundary of the current structure. However, the lack of meaningful recovery attempts suggests sellers remain firmly in control. Every rebound has been shallow, indicating that liquidity is not yet returning to the safe-haven space.
Market Scenarios
Primary Scenario – Continue Lower (Preferred)
Wait for corrective rallies into the 410x–415x demand/Fibonacci zones.
Look for bearish confirmation to rejoin the trend.
Targets remain the liquidity pools below 405x and potentially toward the 398x–400x support region.
Alternative Scenario – Technical Bounce
A reaction from current support may trigger a short-term recovery.
However, unless price reclaims and holds above the 415x structure, any rally is likely to remain corrective rather than trend-changing.
Lucas View
The market is sending a clear message: capital is not seeking safety in gold right now. As long as money continues flowing into the USD and expectations for tighter monetary conditions remain intact, rallies should be treated as opportunities to sell rather than evidence of a new bullish trend.
The final support is being tested, but the selling pressure remains dominant. The focus is not on catching a bottom—it is on waiting for liquidity to return before the next leg lower unfolds.
Bias: Bearish 📉
Key Zones: 410x–415x → Sell Zone
Targets: 405x → 400x → 398x
Strategy: Wait for recovery, avoid chasing price at support.
LucasGrayTrading Short 
Long 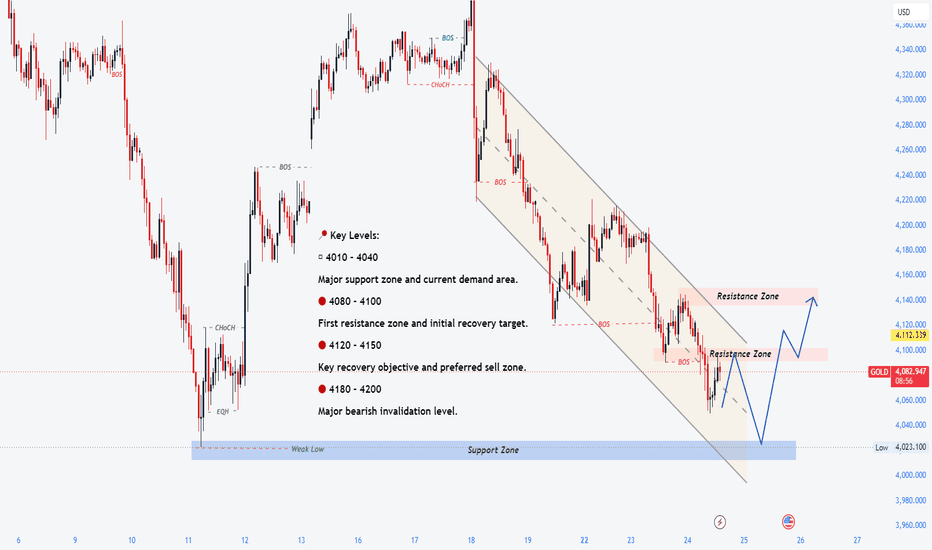
Gold Near Key Support as Traders Watch for a BounceGold remains under broader bearish pressure, but the market is approaching an area where short-term buyers may become active. The $4,040–4,060 zone looks important because price is already stretched far below its recent average levels.
From a trading perspective, this setup looks more like a technical rebound opportunity rather than a confirmed trend reversal. The reaction around support will be critical.
Trade Setup:
Buy Zone: $4,040 – $4,060
Stop Loss: $4,000
Take Profit 1: $4,180
Take Profit 2: $4,200
Take Profit 3: $4,240
As long as the $4,040 area holds, a recovery toward $4,180–4,200 remains a realistic short-term scenario. Long 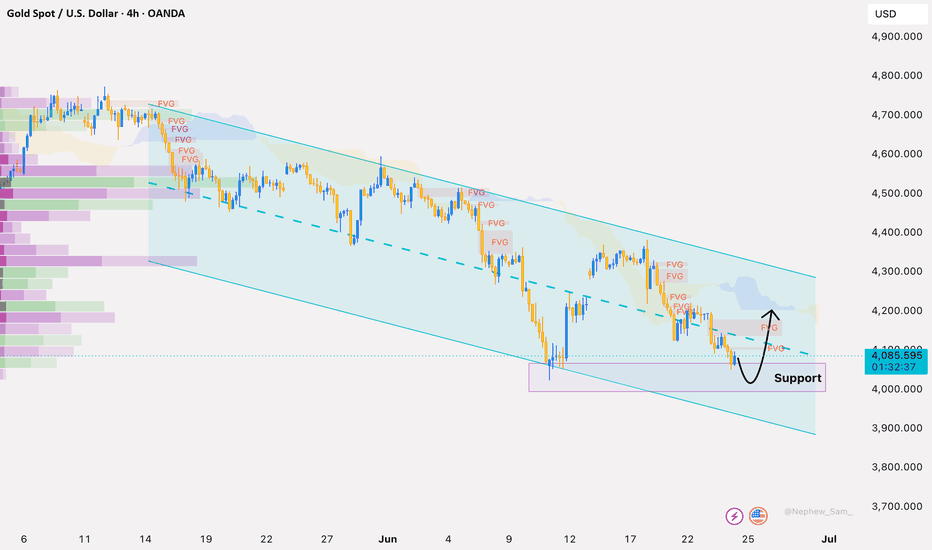
 Long
Long
Gold Market Psychology: How Traders Are Getting Trapped I’m still bullish on the market. Right now, the market is deliberately trying to shake buyers’ confidence and attract sellers at lower levels.
On Monday this week, we saw strong buying from around $4135. Ideally, that move should have continued, but instead, the market broke down below Monday’s low. The reason, in my view, is simple — a lot of price action traders were actively buying in that area, which made it a perfect zone for the market to trap them. This buying interest was justified as well, because after the breakdown of $4100, we saw strong buying volume coming in (clearly visible on the left side of the chart).
Even on the 4H timeframe, bullish volume is strong, and the daily candle has formed in a very solid and clean structure. This is something that should be respected. However, the market is intentionally shaking confidence so that buyers give up and shift their bias toward selling.
One strong reason why I still expect upside movement is this: the market has already broken down below $4100, and we’ve been seeing continuous downside for the past few weeks. From this zone, it makes sense for the market to pause and move upward. Also, the sellers entering randomly at lower levels need to be trapped.
If you look at the chart, selling came in around $4370 on June 9, and again around June 17 (last week), the market showed rejection from the same area and continued downward. To me, this looks like a well-formed trap — a perfect setup to attract sellers at lower levels.
As long as the market is holding above the support zone of $4040–$4075, I don’t think we should give up on buying. As I mentioned, the market has repeated similar price action from last week by rejecting $4370, forming a lower high structure. Because of this, many price action traders are now confidently in sell positions, expecting a bigger swing toward $4000 or even lower.
No doubt, the breakdown of $4000 is very likely — but since it’s such an important psychological and technical level, I don’t expect it to break easily or immediately. Before that happens, the market may move up, bring buyers back in, and build liquidity for the next major move.
So as long as the market stays above my marked green support zone, I’ll maintain a bullish bias.
What’s your plan? Let me know.
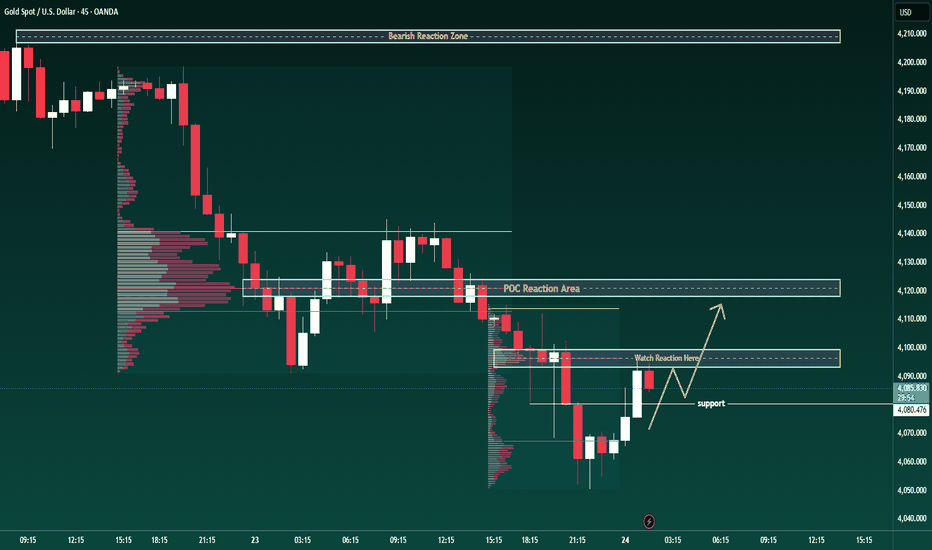
BRIAN XAUUSD – GOLD BOUNCES FROM SUPPORT, BUT THIS ISBRIAN XAUUSD – GOLD REACTS FROM SUPPORT, BUT THIS IS NOT A STRONG BUY
Gold is bouncing from support, but make no mistake — this is NOT a confirmed strong buy. The market is still under pressure after the previous sell-off, and price remains trapped below the key Volume Profile resistance. What we are seeing now is only a technical rebound, nothing more.
The critical question is clear: will buyers take control, or is this just a temporary bounce before sellers strike again?
Technical structure
On the short-term chart, gold has reacted from the support zone around 4,070 - 4,080. This is where buyers are trying to defend the bottom after the recent drop.
But the real battlefield is above. The POC Reaction Area at 4,115 - 4,122 is the key resistance. If price cannot break and hold above this zone, the current bounce is weak and vulnerable.
Higher up, the major bearish reaction zone at 4,205 - 4,210 still dominates the bigger picture. As long as gold stays below this level, sellers remain in control.
Important zones
Support area: 4,070 - 4,080
This is the base where buyers must defend. Lose this, and downside continues.
Watch Reaction Area: 4,090 - 4,100
First test after the bounce. Expect reaction here.
POC Reaction Area: 4,115 - 4,122
This is the key level. Break it, hold it — only then can buyers gain strength.
Bearish Reaction Zone: 4,205 - 4,210
Major resistance. If price reaches here, expect heavy selling pressure.
Trading scenario
Buy reaction from support 4,070 - 4,080
Entry:
Only buy if price holds firmly above 4,070 - 4,080 and shows strong bullish rejection. No confirmation, no trade.
Stop Loss:
Place below the support zone or below the recent sweep low. Protect capital at all costs.
Take Profit:
TP1: 4,090 - 4,100
TP2: 4,115 - 4,122
TP3: Only if price breaks and holds above the POC Reaction Area
This is a reaction trade — NOT a trend reversal.
Final view
Gold can bounce, but this is NOT a strong buy setup.
The only real confirmation comes when price breaks and holds above 4,115 - 4,122. If gold fails at this zone, this bounce will turn into a trap, and sellers will push the market lower again.
The strategy is simple and decisive: buy only with confirmation from support. Do NOT chase price into resistance.
React first. Confirm second. Trade with discipline. Long