MCX Crude Oil (15M) Setup Initial Consolidation to Bullish TrendCrude Oil Futures on the MCX (15-minute timeframe) are exhibiting an initial consolidation phase followed by a strong upside projection along ascending trendline support. The price is hovering near 8,219, having established clear intraday demand zones while aiming for major overhead resistance targets.
Technical Breakdown
Early Selling & Base Formation: Price experienced early selling pressure toward lower support zones around 8,120 – 8,148, where strong buying demand stepped in to create a solid structural floor.
Consolidation & Recovery: After stabilizing above 8,168, the market pushed back through local resistance, forming higher lows and confirming ascending trendline support.
Upside Move (Post-Breakout): A sustained hold above the 8,235 – 8,255 hurdles opens up liquidity expansion toward the upper resistance band around 8,280 – 8,311.
Execution Plan
Bullish Scenario (Long):
Trigger: Sustained hold along ascending trendline support or a clean 15M close above 8,235.
Take Profit 1: 8,280
Take Profit 2: 8,311
Stop Loss: Below 8,168
Bearish Scenario (Short / Breakdown):
Trigger: Breakdown below the trendline and key support at 8,148.
Take Profit 1: 8,120
Stop Loss: Above 8,210
 Long
Long
XAUUSD — Corrective Repricing Buy Setup
Market Context
Gold is trading around $4,393 after pulling back from the $4,430 area. The H1 structure remains constructive after the recent bullish MSS and BOS, but price is currently correcting through nearby imbalance before the next potential expansion.
The macro backdrop is mixed. Rising Treasury yields and stronger oil prices are limiting Gold’s upside today, while softer recent US data has reduced expectations for immediate Fed tightening. Markets are also waiting for the July FOMC minutes on Wednesday, which could increase volatility around the current liquidity zones.
SMC View
The bullish MSS and BOS confirm that buyers still control the broader H1 order flow. The current decline therefore looks more like corrective repricing than a confirmed bearish reversal while the lower demand structure remains protected.
The $4,368–$4,378 Reaction POI is the main decision zone. Buying near the current price would mean entering during the correction, so the cleaner setup is a controlled retracement into demand followed by bullish structure confirmation.
Main Trading Scenario
Condition:
Gold retraces into the $4,368–$4,378 Reaction POI and forms a clear bullish rejection. A lower-timeframe bullish MSS or CHOCH is required before entry.
Entry: $4,368–$4,378 after bullish confirmation
SL: Below $4,360 and the reaction low
TP1: $4,410–$4,420
TP2: $4,430–$4,440
TP3: $4,485–$4,495
Key Zones to Watch
Current price: $4,393.085
Main buy zone: $4,368–$4,378
Deep Discount POI: $4,340–$4,350
FVG: $4,408–$4,420
Trendline liquidity: $4,430–$4,440
Main target: $4,485–$4,495
Invalidation: Acceptance below $4,360
Confirmation: Bullish rejection with MSS or CHOCH
Prime Gold View
The buy bias remains valid while Gold protects the Reaction POI and maintains the bullish H1 structure. The preferred plan is to wait for a confirmed pullback into $4,368–$4,378 rather than chase price during corrective repricing.
If buyers defend the zone, price could reclaim the nearby FVG and expand toward bearish trendline liquidity, followed by the External BSL near $4,490. Acceptance below $4,360 would weaken the immediate setup.
No confirmation, no trade.
 Long
Long
XAU/USD - Breakout Holds Stance, Next BullHello traders, how are you all viewing this breakout?
OANDA:XAUUSD has broken out of the prolonged downtrend line and is currently holding firmly above the Ichimoku cloud. The price maintaining around 4,300+ after the strong rally shows that buyers are still in control of the H8 structure.
My most important area is 4,196–4,301. If a pullback occurs but this area continues to be defended, I still favor a further uptrend rather than a reversal.
🎯 Target 1: 4,500
🎯 Target 2: 4,600
On the other hand, the macroeconomic outlook is leaning towards gold as weak US employment data has reduced expectations of a Fed interest rate hike, while the USD remains near its two-month low. This is a fairly favorable foundation for XAUUSD at the start of the new week, although upcoming US CPI data still needs to be monitored.
I advise against FOMO in the current area. A retest of support would be noteworthy.
The bullish scenario weakens if the price loses 4,300; a clear H8 close below 4,196 would necessitate a reassessment of this structure.
AURICVERSE View: The breakout is there; the question now is whether buyers can hold the breakout zone. If so, 4,500 and 4,600 remain the two areas I'm monitoring.
How are you reading this structure? Share your view below. Long 
XAU/USD - Bulls strong, Next signal upwardHi traders, are you waiting for gold to pull back before continuing?
OANDA:XAUUSD has clearly broken the descending trendline and left the consolidation zone around 4,050–4,100 with a fairly decisive upward move. The price is currently above the Ichimoku cloud, so the H4 structure is still leaning towards buyers.
My area of interest right now is 4,300–4,360. If gold corrects to this level but the selling pressure isn't strong enough to break through, this will be a noteworthy area for a continued upward move.
🎯 Target: 4,550
On the other hand, the new day's macroeconomic outlook continues to support the bulls: weak US labor data has reduced expectations of a Fed interest rate hike, while US-Iran tensions continue to maintain safe-haven demand.
However, tomorrow's US CPI data could significantly increase volatility, so I still prefer waiting for price confirmation rather than FOMO.
If the H4 chart loses 4,300 and retraces back into the breakout zone, the bullish scenario will need to be reconsidered.
AURICVERSE View: The current trend remains positive, but after such a rapid increase, a clean pullback would be more appealing than chasing the price.
How are you reading this structure? Share your view below. Long 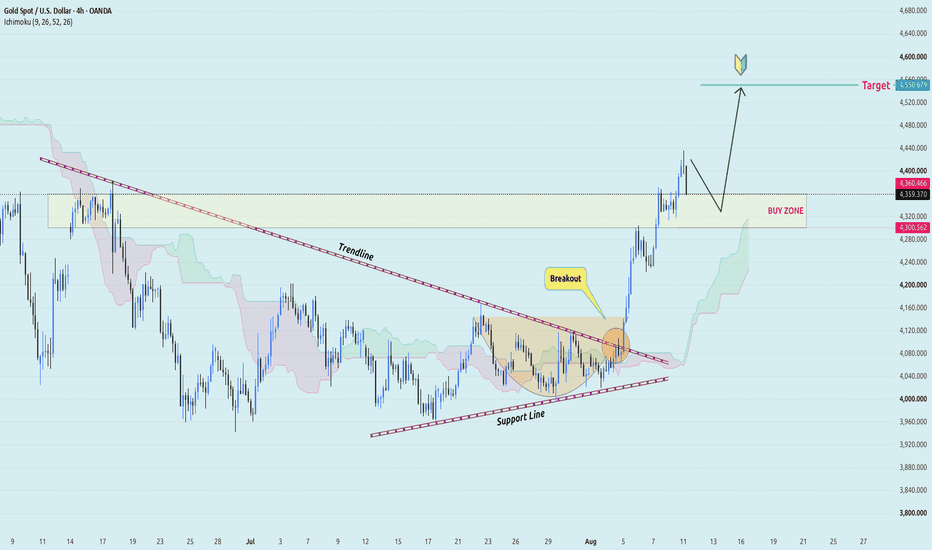
XAU/USD - Buyers Heading Towards New Aim!Hi traders, are you viewing this dip as a pullback or a sign of losing momentum?
OANDA:XAUUSD is correcting quite well after a series of consecutive higher highs at H1 chart. The price is currently back in the 4,350–4,390 range, and is close to the lower edge of the ascending channel — this is the area I want to observe the buyer reaction.
If this area holds and buying pressure returns on the H1 chart, I still favor the scenario of a continued upward movement:
🎯 Target: 4,530
In my opinion, the key point is that short-term momentum has slowed down and the price is below the Ichimoku cloud, so I don't want to enter too early before confirmation.
If the H1 chart clearly breaks 4,350 and loses the lower edge of the ascending channel, the current bullish structure will weaken significantly.
AURICVERSE View: The overall trend isn't bad yet, but the 4,350–4,390 range is where buyers need to prove they still have control.
How are you reading this structure? Share your view below. Long 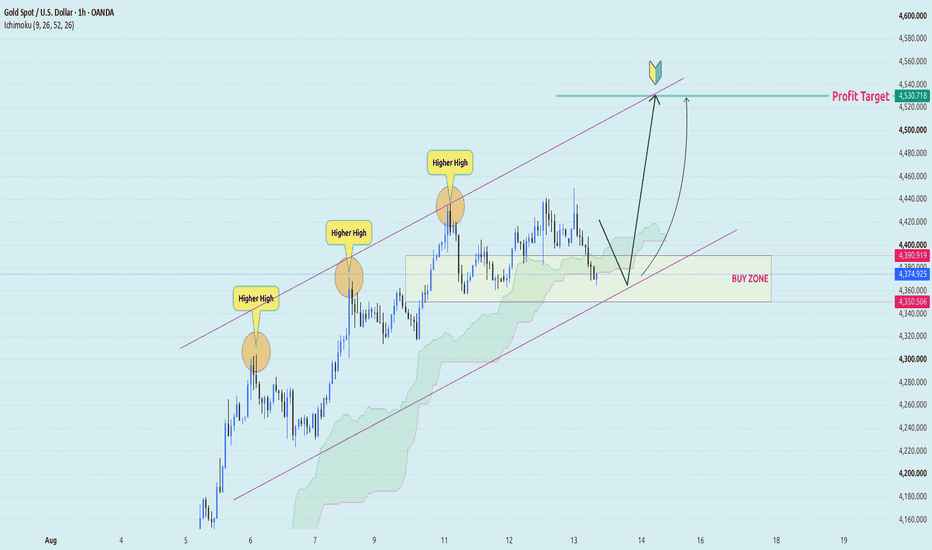
H4 Bullish Retest Before Liquidity Expansion
XAUUSD is trading around 4,353 after pulling back from the 4,440 area. The H4 market structure remains bullish, although price is currently rotating within internal liquidity and may require a deeper retracement before the next expansion higher.
Gold is stabilising as US Treasury yields ease from recent highs, following a sharp sell-off earlier this week as yields moved higher. Attention now turns to today’s Federal Reserve minutes at 18:00 GMT. Meanwhile, elevated oil prices and continued uncertainty surrounding US–Iran tensions are keeping inflation risks in focus.
Technical Outlook
The broader H4 structure remains constructive following consecutive Breaks of Structure (BOS) and the strong expansion from the August lows.
Price is currently trading within the 4,335–4,375 internal liquidity zone. This area could produce short-term consolidation; however, the cleaner bullish opportunity remains lower.
The 4,275–4,310 area is the primary buy/retest zone. It aligns with the previous breakout structure and represents the preferred area for the formation of another higher low.
Should price retrace further, 4,205–4,240 becomes the key H4 demand zone. As long as buyers defend this area, the broader bullish continuation structure remains intact.
To the upside, the previous high and buy-side liquidity (BSL) at 4,435–4,465 represent the first major objective. Sustained acceptance above this area could open the way towards external liquidity at 4,515–4,540.
Key Levels
Current Price: 4,353.440
Internal Liquidity: 4,335–4,375
Primary Buy / Retest Zone: 4,275–4,310
H4 Demand Zone: 4,205–4,240
Previous High / Buy-Side Liquidity: 4,435–4,465
External Liquidity Target: 4,515–4,540
Bullish Invalidation: Below 4,205
Trading Plan
Buy Priority: 4,275–4,310
Confirmation: Wait for an H4 pullback followed by bullish rejection, a liquidity sweep and reclaim, or confirmation of a new higher low.
Stop-Loss: Below 4,205
TP1: 4,350–4,375
TP2: 4,435–4,465
TP3: 4,515–4,540
Important Note
Price is currently trading within internal liquidity, meaning that chasing the rebound at current levels offers less favourable positioning.
A deeper liquidity sweep into 4,205–4,240 would not necessarily invalidate the bullish outlook, provided buyers reclaim the demand zone and the H4 structure remains intact.
The release of the Fed minutes could trigger sharp liquidity sweeps in either direction before the market establishes a clearer directional move.
Final Outlook
Gold remains bullish on the H4 timeframe, but the higher-quality setup is to wait for a controlled retracement towards 4,275–4,310.
If demand holds and bullish structure is confirmed, the next expansion could initially target the 4,450 region, followed by external liquidity above 4,515.
Will gold complete its H4 retest before taking out the previous high around 4,450? Long 
XAUUSD H3 – Buyers Pressing Into a Breakout ZoneXAUUSD H3 – Buyers Pressing Into a Breakout Zone
🔍 Market Overview
Gold remains supported by a softer U.S. dollar and reduced expectations of further Fed tightening. That backdrop continues to favour buyers, although elevated oil prices and bond yields could still create short-term volatility.
📈 Market Structure
On the H3 chart, XAUUSD is holding above its rising trendline after forming a series of higher lows from the 4,310 area.
Price is now compressing beneath the descending resistance line around 4,440–4,450. This is an important zone: a clean break above it would confirm that buyers are ready to extend the broader recovery.
Market Bias: Bullish
Current Phase: Compression below resistance
Key Support: 4,375–4,385
🚀 Bullish Scenario — Primary Bias
The preferred scenario is for price to respect the rising trendline, break above 4,440–4,450, and then retest that area as new support.
If buyers hold the retest, the structure would favour another push toward 4,510.
❌ Invalidation Scenario
A sustained H3 close below 4,310 would invalidate the higher-low structure and weaken the bullish setup.
📍 Key Levels
🟢 Support: 4,375–4,385
📈 Breakout zone: 4,440–4,450
🎯 Target: 4,510
🔴 Invalidation: H3 close below 4,310
⚠️ Trading Perspective
The opportunity is not in chasing price below resistance. The stronger setup comes after a confirmed breakout or a clear bullish defence of support.
No confirmation, no trade.
This analysis is for educational purposes only and should not be considered financial advice. Manage risk and protect your capital. Long 
XAUUSD: Respecting support, repeating opportunityThe XAUUSD chart is showing a notable technical setup, where price structure and the reaction from support point toward a potential recovery. My focus is on the support zone—a clearly defined area that has been tested several times and consistently held, showing that demand remains present.
Each time XAUUSD returns to this area, buyers have produced a meaningful reaction rather than allowing price to decline further. The current move follows the same logic: price reaches support, rebounds, and then attempts to rebuild bullish momentum.
For that reason, I view this zone as an important base and expect gold to continue recovering toward $4,372.
This target is not only a potential take-profit area but also the nearest resistance that needs to be retested after the recent decline. If price sustains its recovery and breaks above this area with solid momentum, the short-term structure would become more constructive. Conversely, a clear H1 candle close below support would weaken this bullish idea.
I do not react to every small fluctuation. I focus on price zones that have repeatedly produced clear reactions—where probability tends to favor patience. Long 
Long 
Short 
Long 
Short 
XAUUSD INTRADAY LEVELS ANALYSIS 17-04-2026Gold is currently trading around 4,394.95 USD (+0.17%), maintaining its bullish bias following a powerful upward move off the 4,320.00 base. After pushing past psychological resistance at 4,400.00 to hit a peak near 4,410.00, price action met sharp selling pressure, leaving a upper liquidity wick before pulling back into the current purple consolidation zone (4,395.00 – 4,405.00).
The recent 15-minute candles display tight-range body sizes with balanced wicks, signaling temporary equilibrium and a breather for buyers. If the bulls can re-establish control and secure a clean 15-minute close back above 4,400.00, momentum could drive a retest of the high near 4,410.00, opening the door toward overhead targets at 4,428.52 and 4,443.05. On the flip side, failing to hold 4,390.00 would suggest exhaustion, likely triggering a deeper corrective retracement toward immediate structural support at 4,375.50, with secondary demand resting down at 4,355.29. Long 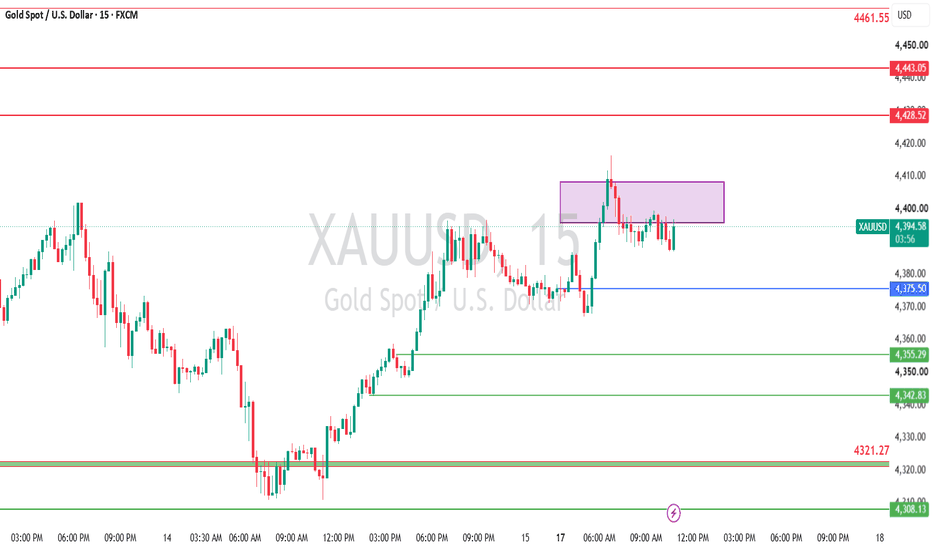
XAUUSD 15M Technical Analysis – Aug 18, 2026 | Day 02The chart shows Gold Spot / U.S. Dollar (XAUUSD) on a 15-minute timeframe, currently trading around $4,392.52. After reaching a recent peak near the $4,430 area near the D(R1) resistance level, price experienced a sharp sell-off down into a short-term consolidation zone near D(S2).
Immediate resistance above sits between $4,408.60 and $4,415.75, with major dynamic resistance further up along the red upper trendline near $4,439.39. Key support levels below are located around the $4,375.00–$4,377.00 zone (D(S3)), followed by deeper daily supports at $4,367.22 (D(S4)) and $4,353.92 (D(S5)). Short 
Long 
Long 
BSL Sweep Before Bearish Rotation
Fundamental Analysis
Gold remains highly sensitive ahead of today’s FOMC Minutes. The Federal Reserve kept interest rates unchanged at 3.50%–3.75% in July, while July retail sales declined by 0.6% and the PPI remained unchanged, leaving the outlook for the next rate decision uncertain.
Technical Analysis
On the H1 timeframe, Gold reacted strongly from the 4,324 SLL area and has now reclaimed the 4,380–4,393 Fibonacci Zone + POI.
The bullish recovery may continue towards the 4,430–4,436 Buy-Side Liquidity (BSL) zone, where previous highs and significant liquidity are concentrated. This is the key area to monitor for a potential bearish rotation.
The Volume Profile also indicates strong trading activity around 4,390, making this an important reaction zone should price pull back.
Important Key Levels
4,430–4,436 — BSL / Major Resistance
4,380–4,393 — Fibonacci Zone + POI
4,324 — SLL / Lower Liquidity
Trading Scenario
The preferred SELL setup comes after a push into 4,430–4,436, followed by a clear H1 rejection or bearish structure confirmation.
Primary Target: 4,380–4,393
Invalidation: Sustained H1 acceptance above 4,436
Overall View
The current price leg remains bullish towards upper liquidity, but the primary focus is on a potential SELL reaction after the BSL has been swept.
Rather than selling too early, the cleaner setup is to allow price to attack the liquidity above the previous highs first and then wait for bearish confirmation.
Will Gold sweep the 4,436 BSL before sellers regain control? Short 
XAU/USD — Professional Technical Analysis. Market Structure
The daily chart shows a significant shift in structure after Gold declined from the **5,300–5,400** region into the **3,950–4,050** area.
Since the July low, price has formed a recovery characterized by:
* A strong rejection from the **~4,000** demand area.
* Higher lows during the August recovery.
* A decisive move back above the **4,200–4,250** region.
* Price now trading around **4,370**, above the marked support zone.
This suggests that the previous bearish structure is weakening and a **bullish continuation structure is developing**.
### 2. Key Support / Entry Zone
The marked **4,200–4,270** region is the most important zone on this chart.
It represents the potential **breakout-retest/support area**.
If price pulls back into this zone and produces bullish confirmation—such as a rejection wick, bullish engulfing candle, or strong daily close—the area can act as a favorable continuation entry.
**Primary support:** 4,200–4,270
**Structural invalidation:** sustained daily acceptance below ~4,150–4,180.
A clean break below the support zone would weaken the bullish thesis and could expose the market to another move toward **4,000–4,050**.
### 3. Upside Targets
The chart's projected targets are logical relative to the current structure:
**TP1: ~4,500**
This is the first important upside objective and a reasonable area for partial profit-taking.
**TP2: ~4,600–4,650**
This corresponds with the marked **RESISTANCE** zone and represents the major target of the current setup.
The **4,600 area** is particularly important because it is where sellers could re-enter and where price may experience significant profit-taking.
### 4. Bullish Scenario
The preferred scenario is:
**4,200–4,270 support → bullish retest → 4,400 → 4,500 → 4,600–4,650**
For continuation, ideally price should remain above the support zone and continue printing **higher highs and higher lows** on the daily timeframe.
A daily close above **4,400–4,450** would further strengthen the case for a move toward the **4,500–4,600** region.
### 5. Bearish Alternative
The bullish setup becomes questionable if Gold fails to hold the breakout area.
A decisive daily close below **4,200** would indicate that the breakout may have been a false move.
Potential downside levels would then be:
* **4,100–4,050**
* **4,000**
* Potentially lower if the 4,000 region fails.
### 6. Risk Management
At the current price of ~4,370, chasing the move offers a less attractive risk/reward than waiting for a controlled pullback.
A more disciplined approach would be to monitor the **4,200–4,270 support zone** and look for confirmation rather than entering purely because price is rising.
For a long setup:
**Entry:** 4,200–4,270 on confirmation
**Invalidation:** below ~4,150–4,180
**TP1:** ~4,500
**TP2:** ~4,600–4,650
### Overall Bias: 🟢 BULLISH
The chart currently favors **buy-the-dip / bullish continuation** rather than aggressive shorting, provided the **4,200–4,270 support zone remains intact**.
The key question is not whether Gold can continue higher—it is whether the market can **hold the breakout and turn 4,200–4,270 into support**. If it does, the marked **4,500 and 4,600–4,650 targets** become the natural upside objectives.
**Professional summary:**
> **Bullish above 4,200–4,270. Buy confirmed pullbacks into support. TP1 4,500; TP2 4,600–4,650. A decisive daily break below 4,200 invalidates the bullish continuation setup.**
Long 
Liquidity Sweep Before Bearish Reversal
Fundamental Analysis
Gold remains supported by a softer U.S. dollar and fading expectations of another near-term Fed hike. July CPI rose by only 0.1%, PPI was unchanged, while retail sales declined 0.6%, keeping pressure on U.S. rate expectations. Market attention now turns to the Fed’s July meeting minutes for further policy clues.
Technical Analysis
On the H1 timeframe, Gold has staged a strong recovery from the 4,310–4,320 SLL zone and reclaimed the 0.5–0.618 Fibonacci retracement area.
Price is now consolidating just below the 4,416.672 buy-side liquidity and the 4,420–4,426 FDC resistance zone.
The primary setup is to watch for one final bullish push into the upper liquidity area, followed by signs that sellers are stepping back in.
The Volume Profile also shows significant activity around the current balance area, making the reaction around the upper liquidity zone particularly important.
Key Levels
4,420–4,426 — FDC / Resistance
4,416.672 — Buy-Side Liquidity
4,376.208 — Fibonacci 0.618
4,363.890 — Fibonacci 0.5
4,350–4,364 — Fibonacci Retracement Zone
4,310–4,320 — SLL / Downside Liquidity
Trading Scenario
The preferred short setup would come after a liquidity sweep into 4,416–4,426, followed by a clear H1 rejection or bearish structure shift.
Target: 4,350–4,364
Extended Target: 4,310–4,320 if the Fibonacci zone breaks decisively
Invalidation: Sustained H1 acceptance above 4,426
Overall View
Gold may still have room for one more push higher before sellers attempt to take control. For now, the key area to monitor is 4,416–4,426, where a liquidity sweep and rejection could provide the first signal for a bearish reversal.
Do you expect Gold to sweep 4,420 first before the next move lower? Short 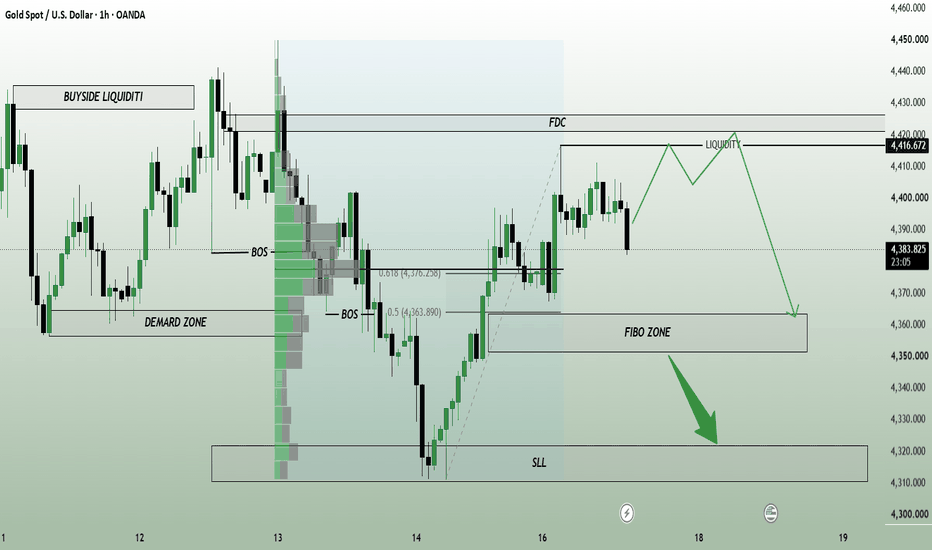
THE GOLD TRAP IS SET — $4,373 IS THE KEY!Everyone thought Gold was finally ready to continue selling after Tuesday's bearish move — but this is exactly where the market can trap the majority. The selling we saw on Tuesday forced many traders to completely flip their bias from bullish to bearish, and now the market is showing the kind of price action that can make those sellers regret their entries. Wednesday's upside move wasn't random — the trap was already being built, and we may now be getting very close to the real move.
Basically, this upside momentum came because a lot of traders had built a bullish bias on Tuesday. However, they kept getting trapped, and during the New York session on Tuesday, we finally saw a strong selling move in the market. Looking at that move, many of the traders who were bullish on Tuesday quickly shifted their bias toward selling. And whenever traders aggressively start selling based on recent price action, the market often takes advantage of that psychology and plays the opposite game to trap them. That is exactly what we saw today.
Right now, I believe many of the traders who were selling throughout the day are confused, and some of them may still be holding onto their selling bias. If we look at the price action, the Tuesday Asian low and the area where the market formed a low around the London session were both around $4,377. From that area, the market is currently showing some resistance.
So, somewhere around here, I believe the market is already making its third or even fourth attempt to push lower. We saw sellers coming in during the Asian session, then they were trapped. After that, we saw another selling move before the London session, and now we are seeing another selling attempt during the pre-New York session. But in my view, this could be the final selling attempt of the day.
I believe we could see the $4,373 high getting broken in the short term. Once that happens, the traders who have been selling throughout the day may start giving up on their positions, thinking that the market is finally going higher. And once the majority of sellers give up and exit their selling positions, that is when I believe we could see the real selling move begin. Basically, the market could first force the sellers to give up by breaking $4,373, and then reverse aggressively to the downside — leaving those sellers with nothing but regret.
However, there is one very important condition I am watching. If the market manages to close below $4,356, then we could see a strong selling move, with the next levels around $4,330, $4,317, and eventually a breakdown toward $4,300. This move could happen within the next few hours or potentially during tomorrow's Asian session.
Now, talking about the downside, as I mentioned earlier, $4,300 has become a very important liquidity area. The market has been sustaining above $4,300 since breaking out of that level last week. Because of this, a lot of traders are currently holding buy positions around $4,300, with their stop losses placed below this area.
And this is exactly where I believe the market makers are looking for liquidity. If enough buyers are positioned around $4,300 with their stop losses underneath, the market has a clear pool of liquidity to target. So, in my view, there is a strong possibility that we could see a proper breakdown toward the downside over the next few hours.
I hope you enjoyed this quick update and, more importantly, understood the psychology behind today's move. There is a lot to learn from the way the market trapped both buyers and sellers.
Good luck, everyone. Make sure you trade with patience and discipline, and if the setup comes, lock in some good profits from Gold. And by the way, what is your current view on Gold? Let me know in the comments. Thank you.
Education