XAUUSD – Bullish Recovery Toward Key ResistanceGold is showing signs of a short-term recovery on the 1-hour chart after finding support near 4,324.
Price has started forming higher lows and bullish candles from the support area, suggesting improving short-term momentum. The current structure leaves room for a move toward the 4,436 resistance zone, where price may encounter renewed selling pressure.
Key levels:
- Support: 4,324
- Current area: 4,367
- Resistance: 4,436
The bullish scenario remains technically relevant while the 4,324 support area holds. A clear break below this level would weaken the current recovery structure and require reassessment.
This is a technical market analysis for educational purposes only, not financial advice. Market conditions can change, and the outlined scenario is not guaranteed.  Long
Long
XAUUSD Technical Analysis — 2H
Market Structure: Price rejected the upper supply zone after taking buy-side liquidity, showing potential bearish reversal.
Supply / Resistance: 4,425–4,448
Liquidity: Buy-side liquidity swept near 4,435 before rejection.
SMT: Bearish SMT divergence supports the reversal idea.
Key Support: 4,380–4,390
Next downside target: 4,365, around the sell-side liquidity.
Ichimoku: Price is losing momentum around the cloud, adding bearish confirmation.
Bias: Bearish below 4,425–4,435.
Invalidation: Sustained 2H close back above the supply zone could invalidate the short setup.
Potential path: Liquidity sweep → rejection → 4,380 → 4,365 sell-side liquidity. XAUUSD — Is This Bounce Real or Just a Retest?Gold is trying to breathe after the sharp bearish move, but the structure is still not fully bullish again.
Price is holding around 4,330 - 4,340, right under the downtrend pressure.
This is the area where many traders can get trapped.
A small bounce can look bullish.
But if price cannot break the right resistance, that bounce can become only a retest before the next drop.
The simple read
4,332 is the first support to watch.
If gold stays above this area, price may try to recover toward 4,365.
But 4,365 is the important trap zone.
This level combines downtrend pressure, Fibo reaction, and sell-zone structure.
If gold rejects from 4,365, sellers may push price back toward 4,314 and 4,300.
If buyers break and hold above 4,365, the next resistance becomes 4,391.
Key price zones
Current price area: 4,330 - 4,340
First support: 4,332
Main retest / sell reaction: 4,365
Strong OB Sell zone: 4,391
Main support: 4,314
Buy reaction zone: 4,300
Deep Fibo reaction zone: 4,263
Trading plan
If gold holds 4,332:
A recovery toward 4,365 can appear.
But I will not chase the bounce.
The real signal comes from the reaction at 4,365.
If gold rejects from 4,365:
The bearish structure remains active.
Price may rotate lower toward 4,314, then 4,300.
If 4,300 fails, 4,263 becomes the deeper reaction zone.
If gold breaks above 4,365:
Buyers may try to reach 4,391.
But even there, I will still watch for resistance reaction. Short 
Short 
XAUUSD – ABC Rebound Before Selling RotationGold is holding a short-term recovery structure after bouncing from the 4,320 area, but this move still looks more like an A-B-C rebound than a full buying reversal. From Kelly’s view, price may continue pushing higher first into resistance, then face renewed selling pressure once the corrective structure is completed.
⟡ Market structure
The chart shows a completed selloff into the 4,320–4,330 region, followed by a rebound forming an A-B-C pattern. Wave A has already pushed price back above 4,350, while wave B created a shallow pullback. If buyers stay in control in the short term, wave C can extend toward the resistance band around 4,370 first, and possibly into the higher sell zone near 4,392–4,398.
That upper zone is important because it aligns with the projected end of the corrective wave and the 1.618 extension area marked on the chart. If price reaches that zone and loses momentum, the market may rotate lower again.
➤ Key levels
◌ Current price area: 4,360
◌ Near resistance: 4,368–4,372
◌ Main sell zone: 4,392–4,398
◌ Short-term support: 4,345–4,350
◌ Lower downside target: 4,330–4,333
⌁ Trading scenario
Kelly’s preferred path is a bullish push first, with price trying to complete wave C into 4,370 and then 4,392–4,398. If gold reacts bearishly from that zone, sellers may take control again and drive price back toward 4,345, then deeper into 4,330.
◌ Invalidation
If price breaks cleanly above 4,398 and holds, the bearish follow-up scenario becomes weaker and gold may extend higher.
▸ Do you think gold will complete wave C into the sell zone first, or reject earlier from 4,370? Short 
Short 
Short 
XAUUSD 4342 fade — 4250 rebuild first? XAUUSD 4342 fade — 4250 rebuild first?
That rejection under 4,430 is the warning.
Gold had the big bullish run already. BOS after BOS. Price launched from the institutional demand floor around 4,000 - 4,030, built above the origin support shelf near 4,025 - 4,055, then expanded hard into the upper range.
Clean run. No debate.
But now?
Momentum is not as clean anymore.
Price pushed into the Liquidity Reaction Ceiling around 4,395 - 4,430, failed to keep pressing, then started bleeding back under 4,360. That orange reaction near 4,320 was cute, but not enough to flip control back to buyers yet.
Main bias is bearish pullback while gold stays below 4,395 - 4,430.
This looks like price needs to rebuild lower before the next real attempt higher. The key downside area is the Discount Rebuild Zone around 4,230 - 4,260. That zone makes sense. Previous structure. Discount pricing. A cleaner place for smart money to reload if the bigger bullish trend is still alive.
I’m not shorting blindly into every dip though.
The move is simple. If gold fails below 4,360 - 4,385, sellers can drag price toward 4,300 first. Below that, 4,260 - 4,230 becomes the real target. That is where I’d watch for the next trap against late sellers.
Trading scenario:
Sell idea only if gold rejects 4,360 - 4,385 or loses 4,320 with clean pressure.
Entry zone: 4,360 - 4,385 after rejection
Alternative entry: below 4,320 after breakdown confirmation
Stop loss: above 4,430
TP1: 4,300
TP2: 4,260
TP3: 4,230
No rejection, no sell. No breakdown, no chase.
If gold closes strong above 4,430, this pullback idea is cooked. Then buyers can attack the liquidity ceiling again.
For now, I’m reading this as ceiling rejection first, discount rebuild next.
You think gold reloads at 4,250 before the next push?
Short 
BRIAN XAUUSD – GOLD BREAKS VALUE, BUT THE REACTION ZONE IS HERE BRIAN XAUUSD – GOLD BREAKS VALUE, BUT THE REACTION ZONE IS HERE
Gold is showing a deeper corrective move after failing to hold the upper value structure near 4,420 - 4,430.
The important detail on this chart is not only the drop. The key point is where gold is dropping into now.
Price has already lost the POC Acceptance Zone around 4,390 - 4,400 and then failed to reclaim the VAL Resistance Flip around 4,350 - 4,360. That means the previous support has now become short-term resistance.
This is a clear value shift.
Technical structure
On the H1 chart, gold previously moved inside a bullish recovery structure, but sellers stepped in near the upper value area and pushed price back below the main acceptance zone.
The POC Acceptance Zone around 4,390 - 4,400 is now the first major resistance above price. If gold rebounds into this zone but fails to hold above it, sellers may continue to defend the market.
The VAL Resistance Flip around 4,350 - 4,360 is the closest reaction zone. Price is currently trading below this level, which shows that buyers are losing short-term control.
Below current price, the next important support is around 4,324 - 4,330. If gold sweeps this area and reacts strongly, a short-term rebound can appear.
The deeper support remains the LVN Deep Support around 4,315 - 4,320. This is the final lower value zone where buyers may try to defend the bigger structure.
Important zones
Current price area: 4,335 - 4,340
Gold is trading below the flipped VAL zone after the breakdown.
VAL Resistance Flip: 4,350 - 4,360
Nearest resistance. Buyers must reclaim this level to reduce selling pressure.
POC Acceptance Zone: 4,390 - 4,400
Main value resistance after the breakdown.
VAH Rejection Zone: 4,445 - 4,455
Upper supply zone where sellers previously controlled the move.
Short-term support: 4,324 - 4,330
First reaction area if price sweeps lower.
LVN Deep Support: 4,315 - 4,320
Major lower support and buyer defence zone.
Trading scenario
Buy reaction from 4,315 - 4,330
Entry:
Look for buy positions only if price sweeps into 4,315 - 4,330 and shows clear bullish rejection.
Stop Loss:
Below the LVN Deep Support or below the local sweep low.
Take Profit:
TP1: 4,350 - 4,360
TP2: 4,390 - 4,400
TP3: Trail higher only if gold reclaims the POC Acceptance Zone with strength
This setup is based on a reaction from lower value after gold has already broken down. It is not a blind buy. The rejection must be clear.
Alternative scenario
If gold rebounds into 4,350 - 4,360 and fails to reclaim this flipped VAL zone, sellers can continue to pressure price back towards 4,324 and 4,315.
A bullish recovery only becomes stronger if gold reclaims 4,360 first, then accepts back above 4,390 - 4,400.
Final view
Gold is correcting after losing value.
The short-term structure is weaker because price is now below both the POC Acceptance Zone and the VAL Resistance Flip. However, gold is approaching an important lower support area where buyers may attempt a reaction.
For now, the plan is simple:
Do not chase sells late near support.
Do not buy early without confirmation.
Wait for the reaction around 4,315 - 4,330.
If buyers defend this zone, gold can rebound towards 4,350 and 4,390.
If this zone breaks, the correction can extend deeper.
This is the key question now:
Is this only a value reset before buyers return, or has gold started a deeper bearish rotation?
Long 
Short 
Gold M30 Trendline Retest —0.618 Fibo Rejection Ahead of FOMC?
Market Overview
• Macro Driver: The US Dollar Index (DXY) stabilizes near 99.60 as institutional participants position defensively ahead of tonight's release of the July FOMC Meeting Minutes and the upcoming Jackson Hole Symposium.
• Smart Money Flow: Following an aggressive markdown leg from recent session highs, institutional order flow is engineering a corrective relief pull to mitigate premium supply and induce retail buyers before executing the next markdown expansion.
Technical Context
• Structure: Dominant Bearish Shift on M30. Sequential CHoCH and BOS breaks confirm that sell-side delivery is firmly established.
• Fibonacci & Imbalance: Price is delivering an internal relief leg toward the confluence of the Descending Trendline and the 0.5 - 0.618 Fibonacci Retest Supply Array (4,365 - 4,375). A rejection here will confirm continuation toward discount liquidity pools below.
Key Zones
• Macro Resistance (Recent High): 4,435.00
• Trendline & Fibo Retest Array (0.5 - 0.618): 4,365.00 - 4,375.00
• Intraday Reaction Pivot (0.382 Fib): 4,352.00
• Interim Base Support: 4,320.00 - 4,325.00
• Macro Floor (Strong Swing Low): 4,311.79
Trading Plan (IF–THEN)
• IF price tests the Trendline + 0.618 Fib Supply Array (4,365 - 4,375) AND prints a lower-timeframe (M3/M5) bearish displacement -> THEN look to execute Short positions targeting 4,340, expanding down to sweep the Strong Swing Low floor at 4,311.796.
• IF price invalidates the trendline resistance with an M30 candle close firmly above 4,385.000 -> THEN the immediate bearish continuation scenario is paused, resetting the structure into a wider range.
MMFLOW View
• Bias: Bearish Continuation on Pullback. Do not chase the current green bounce into descending resistance. Our mathematical edge favors selling the premium Fibonacci array down to the major sell-side liquidity floor.
How are you positioning Gold ahead of the FOMC Minutes release tonight? Short 
How Institutions Quietly Move Billions Before Your Chart ReactsAlmost half of all equity trading in the United States takes place in dark pools. This means that roughly 40-45% of all equity volume trades off-exchange in alternative trading systems, as of 2026. Most retail traders' charts only tell them part of the story, as a significant amount of trading volume never appears on traditional exchanges. In this article, we're going to talk about what dark pools are, why trading takes place outside of traditional exchanges, and how this information can help you before a stock makes its next big move.
What are dark pools?
When a large institution such as a mutual fund or an asset manager wants to buy or sell a large amount of stock, it can cause unintended price movement on public exchanges. This can occur when the buying demand or selling pressure of a large trade gets "picked up" by other traders on the other side of the trade, causing price movement that hurts the very institutions that initiated the trade in the first place.
Dark pools solve this issue by allowing these institutions to execute large trades outside the public eye, so as not to cause undue price pressure before the trade is completed
The trades that take place in dark pools still have to be reported to FINRA, but they aren't reported in real time. This means that a significant amount of trading volume in a given stock is hidden from view, as far as traditional exchanges are concerned.
Dark pools themselves are completely legal and normal facets of financial markets, but this simply means that there is a significant amount of trading volume in a security that never appeared on an exchange and, therefore, is hidden from view. The next part of this article is going to discuss why this hidden volume is important to you and me.
Importance of dark pools to trading
If you're only looking at the volume that appears on-exchange, you are only seeing a small part of the story. Dark pool volume tells you when institutions are accumulating or distributing large amounts of a security, which in turn can give you indications about where a stock might be headed. The reason for this is that large institutions typically don't make their moves on public exchanges, as this causes unnecessary price movement and exposes their positions.
These institutions will use dark pools to complete large buys or sells before initiating smaller trades on public exchanges, so as to not raise suspicions. This means that when you see large volume prints on a stock, it most likely has already been heavily accumulated or distributed by institutions a few days beforehand. This information can be valuable to you because it often gives you a heads-up before smaller retail traders. The amount and frequency of dark pool prints can be used to identify institutional buying or selling.
How to read dark pool volume
FINRA provides information regarding dark pool trading, and there are websites that provide this information for individual stocks in real-time. It's important to read dark pool volume trends, rather than individual numbers, as institutions can take multiple days to complete a trade.
If a stock has abnormally high dark pool volume, this typically indicates that an institution is accumulating or distributing a sizable amount of stock, depending on what the print said (whether it was a buy or a sell). If dark pool prints occurred above the VWAP, it indicates substantial buying pressure unseen by most retail traders on traditional exchanges. If prints occurred below the VWAP, this indicates selling pressure and potential value.
You can think of this in terms of supply and demand: buying pressure higher than average indicates that demand is outpacing supply, which is a bullish signal. Selling pressure indicates the opposite, so it's bearish.
A word of caution: dark pool volume itself never indicates buying or selling pressure; it just indicates that a large trade has occurred off-exchange, and roughly where it occurred relative to the day's VWAP. You should always take this information with a grain of salt and analyze it in context.
A practical example
Say that a stock has shown little movement or interest as of late. If you check the dark pool data and see that dark pool volume prints have been occurring in this stock, with a substantial amount of the trading volume being executed in dark pools, you can use this to assume that there could be value in this stock, as institutions want to buy it. This is just one example of how dark pool volume can give you valuable insight into what institutions are doing before it shows up on your own charts.
Then, when the news catalyst or earnings report finally comes out and the stock gaps up on public view, retail traders who watched the daily chart get surprised because those who watched the dark pool already knew about the accumulation.
Why this information remains hidden is because retail platforms do not show it by default; it takes effort to research FINRA's ATS reports or another dark pool aggregator, and there is a two-week lag on the publicly available data from FINRA, so it's all historical.
Thus, the dark pool is not something that gives you real-time information for immediate execution; it's more about finding those clues that the big players have already been doing something. And while it might seem like a lot to process, it's worth looking into the next time you're on the hunt for accumulation.
The way to use this information is not to chase every suspicious print but rather look for consecutive days of accumulation on a specific side of the VWAP, analyze the location of those print sizes in the order flow, confirm the strength of the breakout with your own technical analysis, and use this data on more liquid names.
My Conclusion
When a security has a higher amount of shares crossing the exchange in dark pools, it means that institutional traders are doing some heavy lifting on it, and it's not unusual for the number to tip on one side of the VWAP more than the other for several days in a row. A stock that printed a suspicious print on the upper half of the VWAP on Thursday, jumped again on Friday, and then went up on the news on Monday is a more reliable breakout than a stock that had no suspicious dark pool prints at all during the week.
Thank You
@VertexQore Education 
Long 
Long 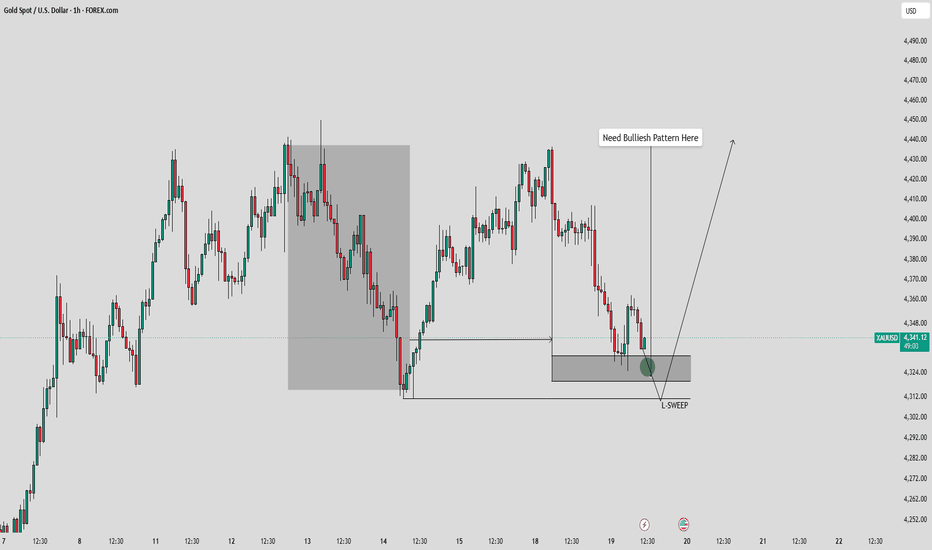
BRIAN XAUUSD – GOLD BREAKS VALUE, BUT THE REACTION ZONE IS HERE BRIAN XAUUSD – GOLD BREAKS VALUE, BUT THE REACTION ZONE IS HERE
Gold is showing a deeper corrective move after failing to hold the upper value structure near 4,420 - 4,430.
The important detail on this chart is not only the drop. The key point is where gold is dropping into now.
Price has already lost the POC Acceptance Zone around 4,390 - 4,400 and then failed to reclaim the VAL Resistance Flip around 4,350 - 4,360. That means the previous support has now become short-term resistance.
This is a clear value shift.
Technical structure
On the H1 chart, gold previously moved inside a bullish recovery structure, but sellers stepped in near the upper value area and pushed price back below the main acceptance zone.
The POC Acceptance Zone around 4,390 - 4,400 is now the first major resistance above price. If gold rebounds into this zone but fails to hold above it, sellers may continue to defend the market.
The VAL Resistance Flip around 4,350 - 4,360 is the closest reaction zone. Price is currently trading below this level, which shows that buyers are losing short-term control.
Below current price, the next important support is around 4,324 - 4,330. If gold sweeps this area and reacts strongly, a short-term rebound can appear.
The deeper support remains the LVN Deep Support around 4,315 - 4,320. This is the final lower value zone where buyers may try to defend the bigger structure.
Important zones
Current price area: 4,335 - 4,340
Gold is trading below the flipped VAL zone after the breakdown.
VAL Resistance Flip: 4,350 - 4,360
Nearest resistance. Buyers must reclaim this level to reduce selling pressure.
POC Acceptance Zone: 4,390 - 4,400
Main value resistance after the breakdown.
VAH Rejection Zone: 4,445 - 4,455
Upper supply zone where sellers previously controlled the move.
Short-term support: 4,324 - 4,330
First reaction area if price sweeps lower.
LVN Deep Support: 4,315 - 4,320
Major lower support and buyer defence zone.
Trading scenario
Buy reaction from 4,315 - 4,330
Entry:
Look for buy positions only if price sweeps into 4,315 - 4,330 and shows clear bullish rejection.
Stop Loss:
Below the LVN Deep Support or below the local sweep low.
Take Profit:
TP1: 4,350 - 4,360
TP2: 4,390 - 4,400
TP3: Trail higher only if gold reclaims the POC Acceptance Zone with strength
This setup is based on a reaction from lower value after gold has already broken down. It is not a blind buy. The rejection must be clear.
Alternative scenario
If gold rebounds into 4,350 - 4,360 and fails to reclaim this flipped VAL zone, sellers can continue to pressure price back towards 4,324 and 4,315.
A bullish recovery only becomes stronger if gold reclaims 4,360 first, then accepts back above 4,390 - 4,400.
Final view
Gold is correcting after losing value.
The short-term structure is weaker because price is now below both the POC Acceptance Zone and the VAL Resistance Flip. However, gold is approaching an important lower support area where buyers may attempt a reaction.
For now, the plan is simple:
Do not chase sells late near support.
Do not buy early without confirmation.
Wait for the reaction around 4,315 - 4,330.
If buyers defend this zone, gold can rebound towards 4,350 and 4,390.
If this zone breaks, the correction can extend deeper.
This is the key question now:
Is this only a value reset before buyers return, or has gold started a deeper bearish rotation?
Long 
Long 
Silver Breakdown Loading !! 55 Is the Real Line in the Sand ..Silver is still firmly bearish in my view and I see the market is building for another proper downside leg rather than preparing for a fresh breakout higher. If you zoom out, the structure after that massive vertical expansion is ugly the top was followed by violent liquidation, every meaningful recovery since then has failed to restore the previous momentum and price has spent months forming lower highs while repeatedly coming back into the same demand. That is the part I don’t like for bulls. The 58–60 zone keeps getting revisited, each reaction from it is producing less upside and the latest bounce could only push into roughly 65–67 before sellers took control again. To me that looks more like distribution and demand being absorbed than accumulation. The 70.85 region remains the major resistance above and that is the level bulls would have to reclaim on a daily basis before I even consider changing the bigger picture. Until then I’m treating upside moves as corrective rallies inside a bearish structure. The immediate battle is obviously 58–60, but I don’t think that is the most important level on this chart. 55 is the real yearly structural support. Once price starts trading below 58–60, I expect 55 to get attacked fairly quickly, and if we get a convincing daily breakdown and acceptance below 55, that would confirm to me that this entire higher-timeframe floor has failed. At that point the market loses the last major support created during the previous expansion and there is a huge amount of open space underneath. That is where I would expect downside momentum to accelerate rather than another small controlled pullback. My larger target remains the old breakout/base structure around 46.58–45.15. That area makes much more sense to me as the place where silver could finally find serious higher-timeframe demand again. So my roadmap remains 65–67 is the nearest rejection area, 70.85 is the major bearish invalidation, 58–60 is the support currently being eaten away, 55 is the level that confirms the real breakdown and 46.58–45.15 remains my final downside objective. I’m not interested in forcing a bullish story while price keeps failing to reclaim structure. My base case is still that this support eventually gives up and silver moves considerably lower. Trade safe !
 Short
Short
XAUUSD Intraday Short Setup: Rejection Off Supply Zone, 19-08-26Looking at XAUUSD (15m), price action shows a clear intraday bearish bias following a sharp impulse drop from the upper supply region. We are currently observing a corrective pullback into key shorting levels.
🔑 Key Technical Zones
Supply Zone / Resistance (Sell Area): 4,367 - 4,372
Secondary Resistance: 4,382 and 4,405 - 4,407
Current Consolidation / Minor Pivot: Around 4,345
Demand Zone / Support (Target Area): 4,326
Extended Demand Target: 4,316 - 4,319
Major Key Support: 4,300
🎯 Trading Plan & Bias
Bias: Bearish / Short
Trigger: Looking for price to sweep into or reject near the 4,367 - 4,372 supply region, showing lower time-frame confirmation (bearish engulfing or market structure break) before entering short.
Target 1: 4,326 (Primary Demand Zone)
Target 2: 4,316 - 4,319 (Secondary Liquidity Target)
Invalidation / Stop Loss: A clean break and acceptance above 4,382 invalidates this short setup. Short 
Short 
XAUUSD – Gold Breaks Support, Sellers Eye 4,308 XAUUSD – Gold Breaks Support, Sellers Eye 4,308
Gold is showing clear short-term weakness after failing to hold the upper range.
Price is currently trading around 4,351 after a strong drop from the resistance area near 4,430 – 4,440. The move broke below the previous short-term structure, and gold is now trying to stabilize under the sell zones.
This is not a clean bullish chart anymore. Buyers may still create a reaction, but sellers now have the stronger short-term structure unless price can reclaim the resistance zones above.
FUNDAMENTAL VIEW
Gold remains sensitive to USD movement, U.S. yields, inflation expectations, and geopolitical headlines.
After a strong bullish phase, profit-taking can appear when price reaches major resistance. If the dollar stays firm or yields recover, gold may continue to face pressure in the short term.
For now, the chart is showing correction pressure, so I prefer to follow price reaction around resistance instead of chasing the market in the middle.
TECHNICAL VIEW – SMC + FIBONACCI
From an SMC perspective, gold rejected from the upper range and created bearish displacement below the short-term support structure.
The market is now trading under the 4,366 sell scalping zone. This area may act as the first resistance if price pulls back.
Above that, 4,380 is the Fibonacci 50 support-turned-resistance area. If gold retests this zone and rejects, sellers may continue to control the next move.
The strongest sell area is around 4,392, where swing liquidity is resting. A move into this area without strong bullish continuation may become another seller reaction zone.
Below current price, the first liquidity area sits around 4,347. If gold breaks lower from here, the next downside target is 4,308.
KEY PRICE ZONES
Current Price: 4,351
Near Liquidity: 4,347
Sell Scalping Zone: 4,366
Fibonacci 50 Resistance: 4,380
Swing Liquidity / Sell Order Zone: 4,392
Main Downside Target: 4,308
Bearish Pressure Valid: Below 4,366
Recovery Confirmation: Above 4,380
Invalidation for Sell View: Above 4,392
TRADING SCENARIOS
Sell Setup – Priority View
Zone: 4,366 – 4,380
Entry: Bearish rejection, failed reclaim, or lower-timeframe bearish CHoCH
SL: Above 4,392 or above the rejection swing high
TP1: 4,347
TP2: 4,308
Sell Setup – Swing Liquidity Reaction
Zone: 4,380 – 4,392
Entry: Wait for rejection after liquidity grab
SL: Above 4,392
TP1: 4,366
TP2: 4,347
TP3: 4,308
Buy Setup – Only Short-Term Reaction
Zone: Around 4,308
Entry: Liquidity sweep, bullish rejection, or lower-timeframe bullish CHoCH
TP1: 4,347
TP2: 4,366
Invalidation: If price breaks and holds below 4,308, the buy reaction becomes weak.
VIEW
Gold is correcting after rejecting from the upper range.
The important thing now is whether sellers can defend 4,366 – 4,380. If price fails to reclaim this area, the path toward 4,308 remains open.
For buyers, gold needs to recover above 4,380 first. Without that reclaim, the structure still favors sellers.
No chase here. I want to see the reaction around 4,366 – 4,380.
Do you think gold will reject from the sell zone and move toward 4,308, or will buyers reclaim 4,380 first?
Long 
 Short
Short
XAUUSD — 4,355 Is the Retest XAUUSD — 4,355 Is the Retest
Gold just gave us a very different message from the clean bullish push we had earlier in the week.
Price was climbing inside a strong bullish channel, printing BOS and holding structure well, but the moment it lost that channel support, the rhythm changed. That breakdown from the rising path matters because it tells me buyers are no longer controlling every pullback the same way. Now gold is trying to bounce from the 4,330 area, but the bounce is moving straight back into a retracement zone, not into fresh bullish space.
For newer traders, this is where the chart becomes important. A bounce after a sharp drop does not automatically mean buyers are back. Sometimes price simply breathes back into the 0.5 - 0.618 area, attracts late buyers, and then sellers use that liquidity to continue the correction.
That is why my main view is bearish for a deeper pullback while gold stays below the FVG and supply area around 4,385 - 4,420. The current reaction near 4,355.595 looks like a retest after the breakdown. If price fails to reclaim the FVG above, I would expect sellers to keep aiming for the downside liquidity around 4,290.130.
The bigger bullish trend is not fully dead yet, but it needs a cleaner reset. If gold reaches 4,290 and reacts strongly, buyers may try to rebuild. If that level breaks, the deeper buy reaction zone near 4,248.578 becomes the next important area.
This bearish correction idea becomes weak only if gold reclaims 4,420 and holds above it. That would show buyers have taken back the broken structure.
Key price zones to watch
Current reaction area: 4,350 - 4,360
Main supply / FVG retest zone: 4,385 - 4,420
Bearish confirmation zone: rejection below 4,385
First downside liquidity target: 4,290.130
Main downside reaction zone: 4,248.578
Lower support if selling expands: 4,220 - 4,230
Upper resistance if buyers recover: 4,420 - 4,440
Invalidation: clean reclaim and hold above 4,420
Do you see this 4,355 bounce as a real recovery, or just a retest before gold hunts 4,290 liquidity?
Short 


