XAUUSD Demand Zone Reversal SetupXAUUSD showed a liquidity sweep above consolidation, capturing buy-side liquidity (BSL) before a strong bearish rejection. Sellers clearly defended the premium zone, pushing price back into a key interest area.
Price is now nearing a strong demand zone and Fair Value Gap (FVG), where buyers may step back in. This is a crucial decision zone in the current structure. As long as this demand zone holds, the overall bullish trend remains intact.
The main expectation is a bullish reaction from the demand zone, reclaiming the range high and moving toward liquidity targets around 4,300 and 4,400. This would confirm the recent drop as a liquidity-driven pullback.
However, a breakdown below the demand zone would invalidate the bullish setup and open the door for further downside.
Key Levels
🔹 BSL: 4,400
🔹 Reclaim Zone: 4,240 – 4,260
🔹 Demand Zone (FVG): 4,185 – 4,230
🔹 Targets: 4,300 → 4,350 → 4,400
🔹 Invalidation: Close below 4,185
Bias: Bullish above demand | Bearish below 4,185 Brian Gold holding above 4,300 ahead.BRIAN XAUUSD – GOLD HOLDING ABOVE 4,300 AHEAD OF FOMC
Gold is struggling to extend its weekly recovery, but price is still holding above the 4,300 area during the Asian session. The market is not in a clean breakout phase yet. Buyers are defending the upper structure, but momentum remains limited ahead of the FOMC decision.
From a macro view, optimism around a temporary US-Iran peace agreement is keeping the US dollar under pressure, which gives gold some short-term support. However, XAUUSD is still trading below the recent weekly swing high and below the important 200-day SMA area. This means traders are likely waiting for the FOMC outcome before committing to the next major move.
Technical structure
On the 2H chart, gold is moving inside a short-term rising structure after reacting strongly from the lower Volume Profile base.
Price is currently holding near the Buy zone around 4,320 - 4,335. This is the key area buyers need to defend. As long as gold stays above this zone, the recovery structure remains valid.
Below current price, the most important Volume Profile support is the Buy zone POC at 4,215 - 4,220. This is the main high-volume area where a deeper pullback could attract buyers again.
The liquidity imbalance zone above 4,240 - 4,280 has already supported the recovery, but gold now needs a stronger push to break higher towards the upper trendline area.
Important zones
Buy zone: 4,320 - 4,335
Current support and short-term decision area.
Confirm sell level: 4,305
If price breaks below this level, short-term pressure can increase.
Buy zone POC: 4,215 - 4,220
Main Volume Profile support and deeper buy-reaction area.
Liquidity imbalance zone: 4,240 - 4,280
Recovery base after the previous strong bounce.
Lower POC: 4,075 - 4,085
Major lower value support if the market breaks down.
Upside trendline target: 4,400 - 4,420
Next bullish target if buyers hold the current structure.
Trading scenario
Buy reaction from Buy zone 4,320 - 4,335
Entry:
Look for buy positions only if price holds the 4,320 - 4,335 Buy zone and shows clear bullish rejection.
Stop Loss:
Below 4,305 or below the local swing low.
Take Profit:
TP1: 4,350
TP2: 4,375
TP3: 4,400 - 4,420
This setup is based on the current buy zone where price is holding above the Volume Profile recovery structure. If buyers continue to defend this area, gold can push higher towards the upper trendline.
Final view
Gold is still holding a constructive recovery structure, but the market is waiting for FOMC before confirming the next direction.
The main plan is simple: as long as price holds above 4,320 - 4,335, the buy structure remains valid. If gold breaks below 4,305, the market can rotate lower towards the Buy zone POC at 4,215 - 4,220.
For now, I prefer waiting for confirmation around the current Buy zone instead of chasing price before FOMC.
Trade the retest. Respect the volume zone.  Long
Long
XAUUSD (Gold) – 2H Chart AnalysisGold is showing a potential Bullish ABCD harmonic pattern on the 2-hour timeframe. After a strong decline into the major support zone around 4,000–4,040, price formed point A and rallied sharply toward resistance at 4,380 (point B).
The recent pullback into point C has completed near the 50% Fibonacci retracement of the AB leg, aligning with a key demand area around 4,200–4,220. This confluence increases the probability of a bullish continuation.
Key Levels
🔹 Entry Zone: 4,200 – 4,220
🔹 Resistance: 4,380
🔹 Target (D): 4,515
🔹 Support Zone: 4,000 – 4,040
Bullish Scenario
If buyers defend the current retracement area and price breaks above 4,380 resistance, the ABCD pattern could complete at 4,515, offering a potential upside move of approximately 100% of the BC projection.
Invalidation
A sustained break below the 4,200 support area would weaken the bullish structure and could expose gold to a deeper correction toward the major support zone.
Trading Idea: Watch for bullish confirmation around the current entry zone before targeting the resistance breakout and eventual completion of the harmonic structure.
Always manage risk and wait for price confirmation before entering a trade.
#XAUUSD #GOLD #Forex #TradingView #TechnicalAnalysis #ABCDPattern #HarmonicTrading #PriceAction #GoldAnalysis #BullishSetup Long 
Short 
XAUUSD — EMA Consolidation Before Bearish Continuation
Fundamental Analysis
Gold remains under short-term pressure as traders continue to watch USD momentum, Treasury yields, and upcoming U.S. macro data.
For now, the recovery has not confirmed a bullish reversal. Price is still reacting around the EMA area, so the current move may be only a short-term consolidation before sellers attempt another push lower.
Technical Analysis
On the 2H chart, XAUUSD is trading around 4,304 after a strong rejection from the upper value range. Price is now consolidating near the EMA 34 and EMA 89 area, showing that the market is pausing before choosing the next direction.
The key zone to watch is 4,301 - 4,320. This area aligns with the Fibonacci retracement zone, volume reaction, and short-term EMA structure. If price fails to hold above this area, sellers may regain control.
The stronger resistance remains around 4,359 - 4,382. As long as gold stays below this value range, the bearish view remains preferred.
If price breaks below the current EMA consolidation zone, the next downside levels are 4,257 and 4,219. A deeper bearish continuation may target the larger convergence support zone around 4,118 - 4,125.
Important Key Levels
Current price area: 4,304
EMA consolidation zone: 4,301 - 4,320
Fibonacci retracement + volume zone: 4,301 - 4,320
Upper value range resistance: 4,359 - 4,382
First downside target: 4,257
Second downside target: 4,219
Major convergence support zone: 4,118 - 4,125
Invalidation area: above 4,382
Trading Scenario
Main Sell Scenario
Entry: 4,301 - 4,320
Stop Loss: 4,382
Take Profit 1: 4,257
Take Profit 2: 4,219
Take Profit 3: 4,118 - 4,125
Sell Condition
The preferred setup is to wait for gold to react around the 4,301 - 4,320 EMA and Fibonacci value zone.
A sell setup becomes more valid if price forms bearish rejection from this zone, such as a long upper wick, bearish engulfing candle, failed breakout, or a lower high below the upper value range.
If price breaks below 4,257 with clear bearish momentum, the next downside focus will be 4,219. Below that, the larger target zone is 4,118 - 4,125.
Entry Conditions
Wait for rejection around 4,301 - 4,320.
Do not sell if price breaks strongly above the value zone.
A move below 4,257 confirms stronger bearish pressure.
If price breaks and holds above 4,382, the sell setup is invalid.
Overall, the main view remains bearish while XAUUSD stays below the upper value range and fails to reclaim stronger resistance. Price may continue to consolidate around the EMA zone in the short term, but if sellers defend 4,301 - 4,320, gold may continue lower toward 4,257, 4,219, and 4,118 - 4,125.
Do you share the same bearish view on gold, or are you waiting for a clearer breakdown below the EMA consolidation zone?
Short 
XAUUSD: Rising channel supports bullish trend.Gold is trading inside a clear rising channel, and the current price action shows that buyers are still defending the short-term recovery structure. From Kelly’s view, the market is building a new Elliott Wave sequence, with the latest pullback looking more like a healthy correction than a full bearish reversal.
The key idea is simple: as long as price holds above the trend-following buy zone, the bullish wave structure remains valid.
⟡ Market structure
Gold has recovered strongly from the lower area and is now moving within an upward channel. The previous resistance around 4,350 acted as a strong barrier, but price has already tested that zone several times and is now trying to build support above the rising trendline.
The current pullback into the 4,275–4,300 area is important because it aligns with the trend-following buying zone. If buyers defend this area, gold may continue forming higher lows and prepare for the next upside leg.
The upper liquidity area around 4,520–4,530 remains the larger upside reference if momentum continues.
➤ Key levels
◌ 4,275–4,300: trend-following buying zone
◌ 4,307: current reaction area
◌ 4,350–4,375: strong resistance and breakout area
◌ 4,420: next upside checkpoint
◌ 4,520–4,530: wave 5 completion / upper liquidity zone
◌ Below 4,275: area where the bullish channel structure weakens
⌁ Elliott Wave view
From an Elliott Wave perspective, gold appears to be forming a bullish 5-wave structure inside the rising channel.
Wave 1 started from the lower base.
Wave 2 corrected into channel support.
Wave 3 pushed price towards the strong resistance zone.
Wave 4 may now be forming as a controlled pullback into the buy zone.
If this area holds, wave 5 may begin and push gold towards the upper channel target.
This is why Kelly would not read the current pullback as bearish yet. The correction is happening inside an uptrend channel, not below it.
▸ Trading scenario
Preferred scenario: wait for price to hold the 4,275–4,300 buying zone and show bullish confirmation.
Entry zone: 4,275–4,300 if bullish confirmation appears
Stop loss: below 4,260 or below the confirmed reaction low
Take profit 1: 4,350
Take profit 2: 4,420
Take profit 3: 4,520–4,530
Alternative scenario: if gold breaks below 4,275 and loses the rising channel support, the bullish Elliott structure weakens and the chart may need a new read.
⌁ Kelly’s view
For Kelly, this is a buy-the-pullback structure inside a rising channel. The market is not showing a clean bearish reversal yet because buyers are still defending the channel rhythm.
The cleaner setup is to watch the reaction around the trend-following buying zone. If price holds there, the next bullish wave may develop towards the upper liquidity area.
Gold is still building an Elliott Wave recovery.
As long as the rising channel holds, the upside structure remains active.
Share your view below. Long 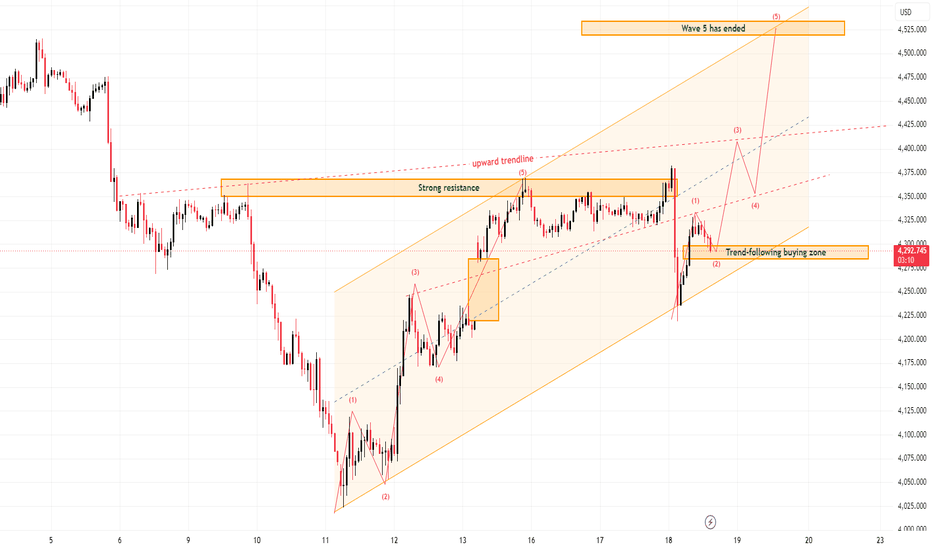
Gold Is Getting Squeezed Before the Next MoveGold is moving inside a tight triangle, and this is the moment where patience matters more than prediction.
THE SIMPLE READ
Gold is not giving a clean direction yet.
Price is being pressed down by the upper trendline, while buyers are still trying to protect the lower trendline. This means the market is slowly getting squeezed.
When gold moves like this, many traders try to guess the breakout too early.
But the cleaner plan is simple: wait for one side to break clearly, then watch how price reacts at the next important zone.
WHAT I SEE
The first area I’m watching is 4,323.
This zone matters because it sits near the lower trendline and is marked as the breakdown area. If gold breaks below this level and cannot recover quickly, the short-term structure may become weaker.
The next area below is 4,285.
This is the first OB Buy Scalping zone. It matters because if price drops here, buyers may try to create a reaction. This does not mean we buy blindly — it only means this is the first place to watch for buyer response.
The deeper support is around 4,212.
This zone is more important because it sits inside the broader rising channel and is marked as a stronger Order Buy area. If gold reaches this level, it may become a larger reaction zone for buyers.
Above the market, the trendline resistance around 4,345 - 4,351 is still important.
As long as gold stays below this area, buyers have not fully taken control yet.
THE PLAN
📈 IF gold holds above 4,323 and breaks back above the upper trendline:
→ Buyers may try to recover again
→ Price can retest the 4,345 - 4,351 resistance area
→ Possible entry idea: after bullish confirmation above the trendline
→ Invalidation: below 4,323
→ Target 1: 4,351
→ Target 2: 4,370
📉 IF gold breaks below 4,323 and fails to reclaim it:
→ The triangle structure becomes weaker
→ Price may move lower toward 4,285 first
→ If 4,285 fails to hold, the deeper support near 4,212 becomes the next area to watch
→ Possible entry idea: after confirmation below 4,323
→ Invalidation: back above the broken trendline
→ Target 1: 4,285
→ Target 2: 4,212
⏳ No confirmation = no trade.
💡 Tiara’s Tip:
When price is squeezed between two trendlines, the first move can often be emotional.
For beginners, do not ask:
“Should I buy or sell right now?”
Ask instead:
“Which level did price confirm first?”
If gold breaks support and holds below it, sellers may gain control.
If gold breaks resistance and holds above it, buyers may return.
That simple mindset helps you trade the reaction, not the fear.
YOUR TURN
💬 What’s your view today — will gold break below 4,323 first, or will buyers defend the trendline again?
Drop a 🟢 for buyer defense or 🔴 for breakdown below 👇 Short 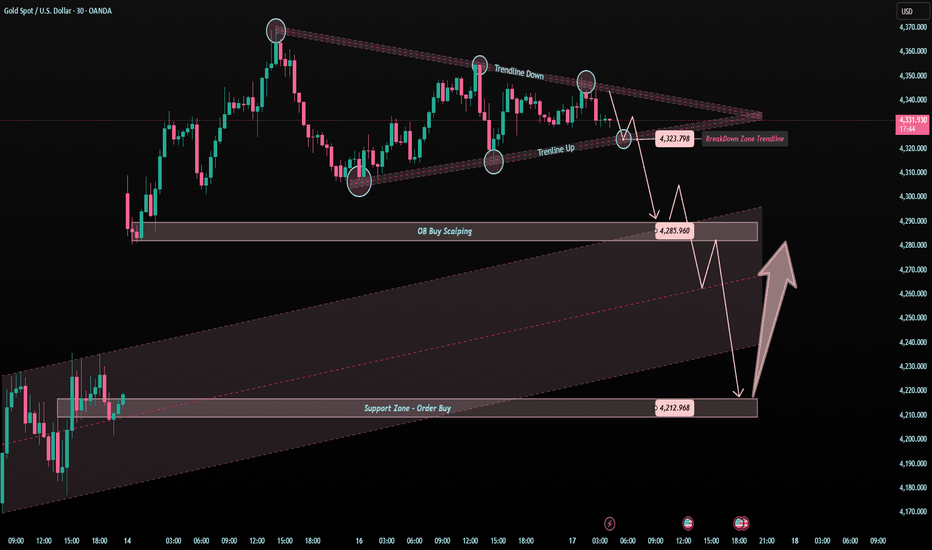
Gold: Strong Buy Zone at $4,258–$4,246? (Post-FOMC Setup)At the $4,258 – $4,246 support zone, the best high-probability decision is a cautious strong buy (long) setup with tight risk management — but only on confirmation of a bounce.
Why Strong Buy Bias Here?
This zone represents a key short-term demand/support area (often cited as Support A in recent analyses). It sits near the 23.6% Fibonacci and structural levels where buying interest has historically appeared during the current correction.
Broader context: Gold remains in a larger bearish correction from 2026 highs (~$5,595), but $4,258–$4,246 is viewed as a potential higher-probability exhaustion or reversal zone for a relief rally, especially if it aligns with oversold conditions (e.g., RSI dipping lower)
Post-FOMC reaction (today's event) could provide the catalyst: A neutral-to-dovish tone from Chair Warsh might support a rebound from this level toward $4,300–$4,350+ resistance.
Trading Plan if Price Reaches $4,258–$4,246
Strong Buy (Long) Setup (Preferred):
Entry: On bullish candlestick confirmation (e.g., hammer, engulfing) or bounce off the zone.
Target: Initial $4,300–$4,319 (stronger support turned resistance), then $4,350–$4,400.
Stop Loss: Tight, below the zone (e.g., $4,230–$4,220) for good risk-reward.
Rationale: High chance of reaction/bounce in a corrective market.
Avoid Strong Sell unless:
Clear breakdown with strong bearish momentum (e.g., decisive close below $4,246 on high volume + hawkish Fed fallout).
In that case, targets would shift to $4,195–$4,100 or lower.
Key Risks & Context (June 17, 2026)
Current price is holding ~$4,320–$4,350 ahead of/around FOMC. A break lower to $4,258 would likely stem from stronger USD or hawkish signals.
Overall bias remains bearish on higher timeframes (below 200-day SMA), so any long here is a counter-trend bounce play, not a trend reversal.
Volatility will be high post-FOMC — wait for confirmation rather than anticipating.
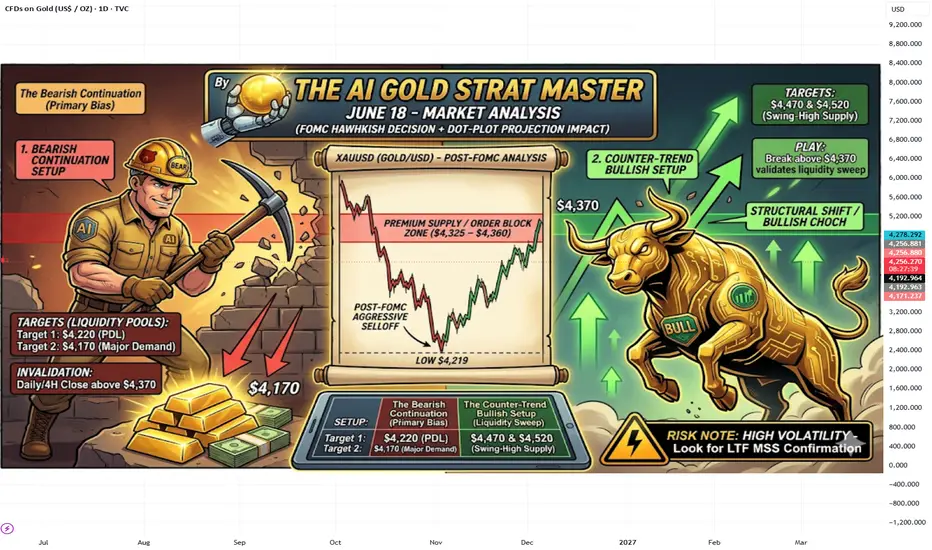
Bottom line: Treat $4,258–$4,246 as a buying opportunity zone with strong buy potential on bounce, but confirm with price action and manage risk strictly (1-2% account risk max). This is not financial advice — markets can break supports and continue lower. Always use proper position sizing and stay updated on Fed news. Gold (XAUUSD): 4H Order Block Retest – Short or Structural Flip?Following yesterday's (June 17) hawkish Federal Reserve interest rate decision and dot-plot projection, XAUUSD experienced an aggressive selloff down to a low of $4,219, breaking structure locally before staging a strong intraday rebound during today's Asian and European sessions back up toward the $4,320–$4,330 region.
From an SMC and Supply/Demand perspective, the market is currently presenting a high-probability bearish premium mitigation or short continuation setup, unless a specific structural flip occurs.
1. The Bearish Continuation Setup (Primary Bias)
Premium Supply / Order Block Zone: The key area of interest sits between $4,325 and $4,360. This zone aligns with a 4H Fair Value Gap (FVG), a bearish Order Block, and key Fibonacci retracement levels.
Invalidation / Structural Shift: $4,360 – $4,370. A daily or sustained 4H close above $4,370 invalidates the bearish bias, completing a bullish Change of Character (ChoCh) and clearing the descending trendline.
Targets (Liquidity Pools): If the price shows lower-timeframe (LTF) rejection or a distribution pattern inside the $4,330–$4,360 zone, the high-probability targets are:
Target 1: Previous Day Low (PDL) / Liquidity Pool at $4,219
Target 2: Major HTF Demand Zone at $4,170
2. The Counter-Trend Bullish Setup (Liquidity Sweep)
Some buyers are actively defending the major higher-timeframe demand zone just below the recent lows.
The Play: If the current upward momentum aggressively breaks and closes above $4,370, it confirms yesterday's drop was a massive liquidity sweep of the lower ranges.
Targets: A structural break above $4,370 shifts the targets immediately upward to $4,470 and $4,520 into the swing-high supply zones.
Risk Note: With massive macroeconomic shifts playing out this week, volatility remains highly expanded. If entering the premium supply zone, look for a clean LTF market structure shift (MSS) on the 5-minute chart before executing to keep stops tight. XAUUSD: Premium Supply Mitigation After FOMC SelloffFollowing yesterday's (June 17) hawkish Federal Reserve interest rate decision and dot-plot projection, XAUUSD experienced an aggressive selloff down to a low of $4,219, breaking structure locally before staging a strong intraday rebound during today's Asian and European sessions back up toward the $4,320–$4,330 region.
From an SMC and Supply/Demand perspective, the market is currently presenting a high-probability bearish premium mitigation or short continuation setup, unless a specific structural flip occurs.
1. The Bearish Continuation Setup (Primary Bias)
Premium Supply / Order Block Zone: The key area of interest sits between $4,325 and $4,360. This zone aligns with a 4H Fair Value Gap (FVG), a bearish Order Block, and key Fibonacci retracement levels.
Invalidation / Structural Shift: $4,360 – $4,370. A daily or sustained 4H close above $4,370 invalidates the bearish bias, completing a bullish Change of Character (ChoCh) and clearing the descending trendline.
Targets (Liquidity Pools): If the price shows lower-timeframe (LTF) rejection or a distribution pattern inside the $4,330–$4,360 zone, the high-probability targets are:
Target 1: Previous Day Low (PDL) / Liquidity Pool at $4,219
Target 2: Major HTF Demand Zone at $4,170
2. The Counter-Trend Bullish Setup (Liquidity Sweep)
Some buyers are actively defending the major higher-timeframe demand zone just below the recent lows.
The Play: If the current upward momentum aggressively breaks and closes above $4,370, it confirms yesterday's drop was a massive liquidity sweep of the lower ranges.
Targets: A structural break above $4,370 shifts the targets immediately upward to $4,470 and $4,520 into the swing-high supply zones.
Risk Note: With massive macroeconomic shifts playing out this week, volatility remains highly expanded. If entering the premium supply zone, look for a clean LTF market structure shift (MSS) on the 5-minute chart before executing to keep stops tight. FOMC WEEK (15-18/06): GOLD RECOVERY OR BEARISH CONTINUATION?After two consecutive weeks of heavy selling, gold plunged from the 44xx region down to 40xx, losing more than 4,000 pips in a relatively short period. The move was driven not only by economic data but also by a major shift in global capital flows and market expectations.
Although softer inflation readings were expected to support gold, investors largely stayed on the sidelines. Safe-haven demand failed to return in a meaningful way, while liquidity continued to leave the precious metals market. As a result, every recovery attempt was sold into, creating a persistent downtrend throughout the first half of June.
Toward the end of last week, however, gold finally found significant buying interest around the 402x support zone, a major daily support area that also aligns with an important Fibonacci extension level. From this region, price rebounded more than 200 points, suggesting that short-term selling pressure may be easing after an extended liquidation phase.
That said, this rebound should still be viewed as a corrective recovery within a broader bearish structure. The key question for next week is not how far gold can bounce, but whether capital will genuinely return to safe-haven assets.
MACRO OUTLOOK
The market narrative is shifting away from inflation and toward monetary policy and economic growth expectations.
The main event next week is the FOMC Meeting and Federal Reserve Interest Rate Decision on June 18. Markets overwhelmingly expect rates to remain unchanged, meaning investors will focus on the Fed's economic projections and guidance regarding potential rate cuts later in 2026.
Key events to monitor:
BOJ Policy Rate (June 16) – Potential impact on safe-haven flows across Asia.
US Retail Sales (June 17) – A key gauge of consumer strength and economic momentum.
FOMC Economic Projections & Fed Decision (June 18) – Likely to drive market expectations for the second half of the year.
Beyond economics, traders are closely watching geopolitical developments, particularly signs of easing tensions and possible progress toward a peace agreement between the United States and Iran.
If geopolitical risks continue to decline, demand for gold as a defensive asset could remain weak. This helps explain why recent rebounds have struggled to attract sustained institutional buying.
PRIMARY SCENARIO
Gold appears to be forming a temporary base around the 402x–410x region after an aggressive selloff.
In the short term, price may continue recovering toward overhead liquidity and resistance zones, particularly the 43xx–45xx Demand + Fibonacci areas highlighted on the chart.
However, as long as price remains below the major daily descending trendline and key liquidity zones overhead, the broader bearish structure remains intact. Current rallies should still be viewed as corrective moves within a larger downtrend.
If the Fed maintains a cautious stance and US economic data remains resilient, gold could face renewed selling pressure from those higher resistance areas before resuming its bearish trend.
ALTERNATIVE SCENARIO
If the Fed adopts a more dovish tone than expected, or if new geopolitical risks emerge that drive capital back into safe-haven assets, gold could extend its recovery from the current lows.
In that case, the market may attempt to reclaim the 43xx–45xx Demand + Fibonacci zones, with the potential to test the higher FVG liquidity area above.
Such a move would be the first indication that medium-term selling pressure is weakening and that the broader bearish structure may require reassessment.
SHORT-TERM BIAS
Bullish recovery from major support.
LONG-TERM BIAS
Still bearish while price remains below the major descending trendline and key liquidity zones overhead.
LucasGrayTrading 📉🔥 Short 
GOLD RISES FROM 430X, BUT FOMC MAY CAUSE SELLOFFGold continues to respect the recovery scenario outlined at the start of the week. After establishing a temporary bottom around the 40xx liquidity zone, price has maintained a strong technical rebound and is now trading firmly above the previously broken H4 descending trendline.
The key difference compared with last week's recovery attempts is that buyers are no longer reacting only from oversold conditions. Instead, the market is beginning to stabilize above the 430x region, suggesting that short-term liquidity accumulation is taking place ahead of the week's major macro events.
From a macro perspective, gold is benefiting from a combination of factors. Markets are entering a waiting phase before the upcoming FOMC decision, while expectations for a stable Fed stance have reduced aggressive USD buying. At the same time, geopolitical risks remain present but have not escalated enough to trigger a full safe-haven rush. The result is a market environment where traders are reducing directional exposure and allowing gold to recover part of the heavy losses suffered during the previous week.
However, the broader picture remains unchanged. Last week's decline from the 44xx region toward 40xx created significant liquidity imbalances. While gold is currently filling part of that imbalance, the market still faces several important overhead liquidity zones that could attract fresh selling pressure.
PRIMARY SCENARIO
As long as gold holds above the 430x Supply + Fibonacci support zone, the current recovery remains valid.
Price may continue extending higher toward the Demand + Fibonacci resistance around 436x–438x, where the descending trendline and key liquidity clusters converge. This remains the most important area to monitor before the FOMC meeting.
ALTERNATIVE SCENARIO
If buyers fail to maintain control above 430x and momentum weakens beneath the recovery structure, gold could return to retest lower support zones before attempting another directional move.
Until the market receives fresh guidance from the Federal Reserve, price action is likely to remain heavily driven by liquidity positioning rather than long-term conviction.
SHORT-TERM BIAS
Bullish recovery while price remains above the 430x support region.
LONG-TERM BIAS
Still bearish below the major Daily trendline and overhead Demand zones. Current upside remains a corrective recovery within a larger bearish structure.
LucasGrayTrading 📈🔥📉 Short 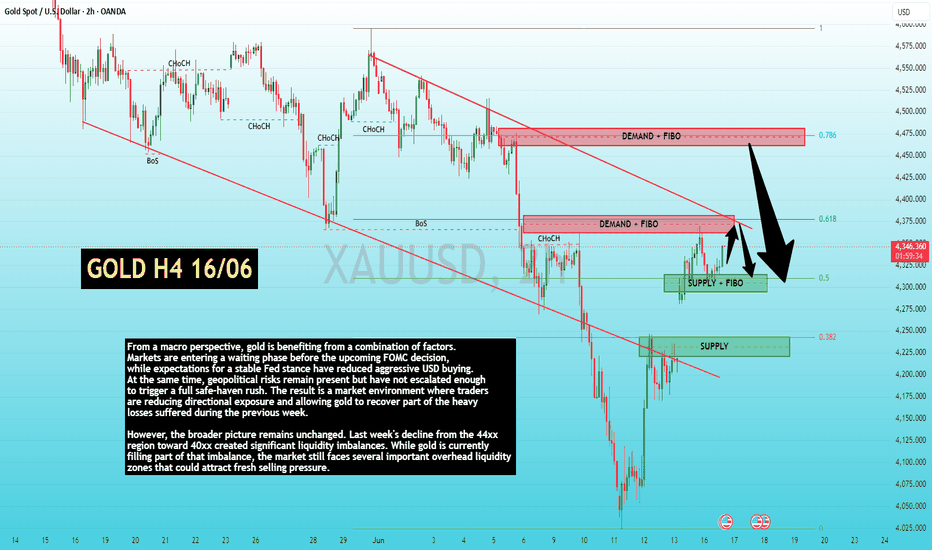
Reliance Shows Strength AheadHighlights
* Reliance Industries is maintaining a positive technical structure, supported by steady buying interest near key levels.
* The stock is trading above important moving averages, indicating that the medium-term trend remains favorable.
* Momentum indicators suggest improving strength, though the stock may witness some consolidation after recent movements.
* Immediate resistance is positioned near recent highs; a decisive breakout could support further upside momentum.
* Key support levels remain important, as holding these zones would preserve the bullish setup.
* Developments across Reliance’s key businesses, including digital, retail, energy, and new-age initiatives, continue to influence investor sentiment.
Takeaway
Reliance Industries’ technical outlook remains positive as long as the stock sustains above its major support zones. A breakout above resistance could attract fresh buying interest, while any decline towards support levels may provide opportunities for accumulation. Traders should monitor price action and volume trends for confirmation of the next move.
Short 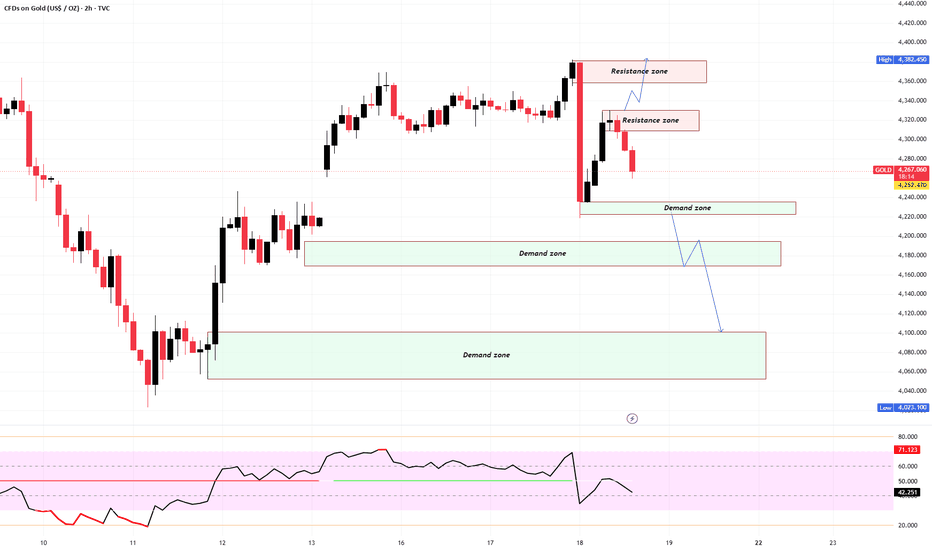
FED Stays Firm, Peace Talks Surge: Gold Outlook?Gold remains trapped between two opposing macro narratives.
On one side, the Federal Reserve kept interest rates unchanged and maintained a cautious tone regarding future policy easing. This effectively confirmed that the recent decline was not simply a short-term correction but part of a broader repricing process as markets adjust to a higher-for-longer rate environment.
On the other side, optimism surrounding peace negotiations and easing geopolitical tensions has sparked a strong technical rebound from last week's panic low. The recovery above the broken descending trendline attracted short-covering flows and helped gold reclaim part of the previous selloff.
However, from a market-structure perspective, the rebound has not changed the bigger picture yet.
Price is currently testing a key Demand + Fibonacci resistance zone around 432x–434x, while the broader daily structure remains bearish. More importantly, the rally appears driven primarily by sentiment and positioning rather than a meaningful shift in monetary policy expectations.
This is why the current recovery should still be viewed as a corrective move until buyers can reclaim higher liquidity zones.
PRIMARY SCENARIO
If the market continues to digest the Fed's message and upcoming economic data fails to support aggressive rate-cut expectations, gold may struggle to sustain gains above the current resistance cluster.
In this scenario, the 432x–434x Demand + Fibonacci zone could act as a distribution area, opening the door for another rotation lower toward the 423x–425x Supply zone, where liquidity remains unfinished.
As long as price remains below the major resistance structure, sellers retain the broader advantage.
ALTERNATIVE SCENARIO
If geopolitical developments continue to support safe-haven demand or markets begin pricing a more dovish Fed outlook, gold could extend its recovery.
A decisive break above 434x would expose the next liquidity pool around 437x–445x, where larger timeframe resistance and resting liquidity converge.
SHORT-TERM BIAS
Bullish corrective recovery above the broken trendline.
LONG-TERM BIAS
Still bearish while price remains below the 432x–445x resistance cluster and the market continues to operate within a broader post-FOMC bearish structure.
LucasGrayTrading 📊🔥 Short 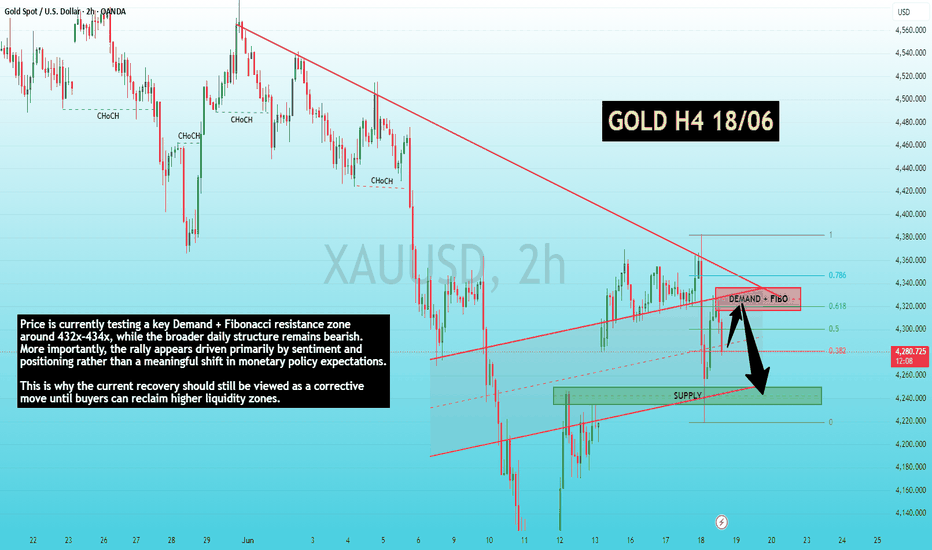
Will Gold Break Higher or Retest Support First?Gold has recovered from the lower support, but now price is testing a very important reaction area. This is where the next move can become much clearer.
THE SIMPLE READ
Gold bounced strongly from the 4,226 area and is now trading near 4,320.
This looks positive, but price is also sitting close to a resistance and volume reaction zone. That means buyers are active, but they still need to prove strength above the next level.
For beginners, this is a simple lesson:
A bounce is good, but a confirmed breakout is stronger.
WHAT I SEE
The key area right now is 4,320 - 4,332.
This zone matters because it combines volume reaction, Fibonacci level, and short-term resistance. If buyers can break and hold above 4,332, the recovery may continue higher.
Above that, 4,380 is the next resistance zone.
This is the area where gold may slow down again if the bullish move continues.
Below the market, 4,274 is the first clean support zone.
If gold cannot break above 4,332, price may pull back toward 4,274 first. This zone is important because buyers may use it as a place to defend the recovery.
The deeper support is 4,226.
If 4,274 fails, gold may return toward this lower support before finding balance again.
THE PLAN
📈 IF gold breaks and holds above 4,332:
→ Buyers may gain more control
→ Price may continue toward the next resistance zone
→ Possible entry idea: after confirmation above 4,332
→ Invalidation: back below 4,320
→ Target 1: 4,350
→ Target 2: 4,380
📉 IF gold rejects from 4,320 - 4,332:
→ A pullback may come first
→ Price may retest the 4,274 Order Buy zone
→ If buyers react well there, gold may try another recovery
→ Possible entry idea: wait for bullish reaction around 4,274
→ Invalidation: below 4,226
→ Target 1: 4,320
→ Target 2: 4,332
⏳ No confirmation = no trade.
💡 Tiara’s Tip:
When price reaches resistance after a strong bounce, do not rush to buy just because the candles look bullish.
A clean setup usually comes from one of two things:
Price breaks resistance and holds above it.
Or price pulls back to support and buyers defend it.
Both are better than chasing in the middle.
YOUR TURN
💬 What’s your view on gold today — breakout above 4,332 or pullback to 4,274 first?
Drop a 🟢 for breakout or 🔴 for pullback below 👇 Long 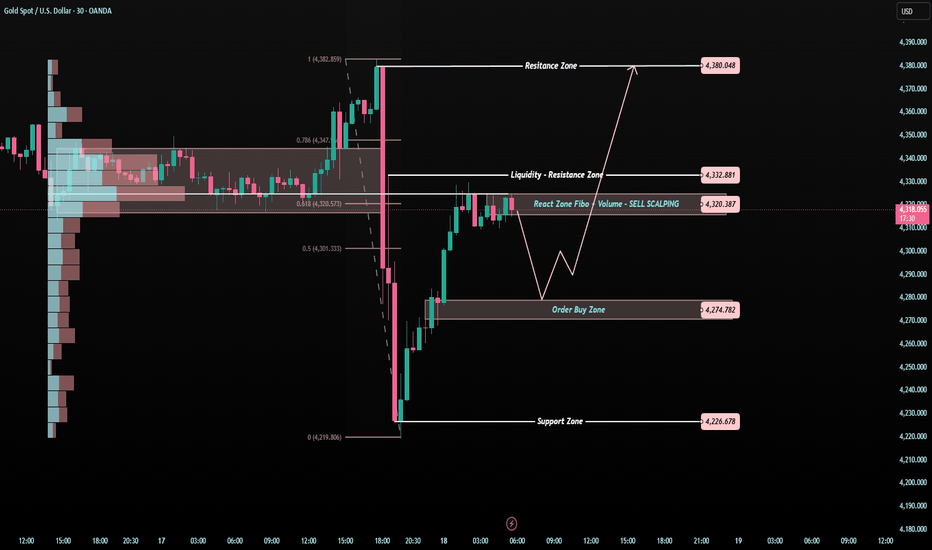
Long 
XAUUSD — Sell From Fibonacci & EMA Value Zone
Fundamental Analysis
Gold remains sensitive as traders continue to watch USD strength, Treasury yields, and upcoming U.S. macro data. While the recent recovery is visible, the broader structure still stays under EMA resistance.
For now, any upside move should be treated as a corrective pullback unless gold can break and hold above the main EMA value zone.
Technical Analysis
On the 1H chart, XAUUSD is recovering from the lower liquidity area around 4,077, but the main trend is still under bearish EMA pressure.
EMA 34, EMA 89, and EMA 200 are still positioned above or near price, showing that the market has not fully shifted bullish. The recent move looks more like a retracement into value rather than a confirmed trend reversal.
The key sell zone is around 4,375 - 4,423. This area aligns with the Fibonacci retracement zone, EMA resistance, previous structure, and the upper side of the corrective channel.
If price reaches this zone and shows bearish rejection, sellers may regain control. The first downside reaction area is the VL zone around 4,230 - 4,247. Below that, the deeper liquidity target remains around 4,077.
Important Key Levels
Current price area: 4,323
Fibonacci & EMA value sell zone: 4,375 - 4,423
Short-term support / VL zone: 4,230 - 4,247
Liquidity target: 4,077
EMA reaction area: 4,375 - 4,423
Invalidation area: above 4,423
Trading Scenario
Main Sell Scenario
Entry: 4,375 - 4,423
Stop Loss: 4,440
Take Profit 1: 4,247
Take Profit 2: 4,230
Take Profit 3: 4,077
Sell Condition
The preferred setup is to wait for gold to pull back into the 4,375 - 4,423 value zone. This area combines Fibonacci retracement, EMA resistance, and previous price reaction.
A sell setup becomes more valid if price forms bearish rejection from this zone, such as a long upper wick, bearish engulfing candle, failed breakout, or lower high formation below the EMA structure.
If price rejects from the sell zone and breaks back below 4,291 - 4,300, bearish pressure may return toward 4,247 and 4,230. A deeper breakdown may then target the liquidity zone around 4,077.
Entry Conditions
Wait for price to reach 4,375 - 4,423.
Look for bearish rejection before entering sell.
Do not sell directly while price is still in the middle of the range.
If price breaks and holds above 4,423 - 4,440, the sell setup is invalid.
Overall, the main view remains bearish while XAUUSD trades below the key EMA value zone. The preferred plan is to wait for a corrective pullback into 4,375 - 4,423, then look for sell confirmation toward 4,247, 4,230, and 4,077.
Do you share the same bearish view on gold, or are you waiting for a cleaner rejection from the Fibonacci and EMA value zone?
Short 
XAUUSD – Gold Is Accumulating Below LiquidityXAUUSD – Gold Is Accumulating Below Liquidity, Sell Pressure Still Favoured
Gold is currently moving inside a short-term accumulation structure on the H1 chart. Price is trading around 4,317 after reacting from the IFVG and the buy zone around 4,285 – 4,290.
The market has not confirmed a clean breakout yet. The current structure shows that gold is still building liquidity between the buy zone below and the short-term resistance around 4,329. As long as price cannot break strongly above the upper liquidity area, sell pressure should still be watched carefully.
FUNDAMENTAL ANALYSIS
Gold is still reacting to U.S. dollar movement, Treasury yields and market expectations after recent high-impact news. The latest recovery has slowed near resistance, showing that buyers still lack strong confirmation.
For now, the technical structure is more important. If gold fails to hold the buy zone or rejects from the upper liquidity area, sellers may regain control.
TECHNICAL ANALYSIS – SMC + FIBONACCI
From an SMC perspective, gold has recovered from the monthly low around 4,025 and created a bullish reaction earlier. However, the current price action is now moving sideways below the buyside liquidity area, which suggests accumulation rather than a confirmed bullish continuation.
The IFVG zone below price is important because it has acted as a reaction area. The buy zone around 4,285 – 4,290 is the key short-term support. If this zone holds, gold may attempt another move toward 4,329 and 4,383.
However, the main issue is that price has not broken above 4,329 with strong momentum. If gold fails around this area or sweeps toward 4,383 and rejects, sellers may step back in.
Below the buy zone, 4,218 is the key sellside liquidity. If price breaks below 4,285 – 4,290, the accumulation may turn into a bearish continuation setup, targeting 4,218 and 4,170.
KEY PRICE ZONES TO WATCH
Current price area: 4,317
Buy zone: 4,285 – 4,290
Short-term resistance: 4,329
Buyside liquidity: 4,383
Strong support-turned-resistance: 4,430 – 4,445
Higher resistance: 4,476
IFVG support zone: 4,218 – 4,285
Sellside liquidity: 4,218
Strong liquidity: 4,170
Lower FVG zone: 4,110 – 4,130
Month low: 4,025
Invalidation area for sell view: Above 4,383
TRADING SCENARIOS
Sell Scenario – Priority H1 View
If gold breaks below the 4,285 – 4,290 buy zone and confirms weakness, I will watch for a sell continuation setup.
Sell Zone: Below 4,285 after confirmation
Entry Condition: Clean break below the buy zone, bearish retest, lower-timeframe CHoCH, or strong bearish displacement.
Stop Loss: Above 4,329 or above the nearest swing high.
Take Profit:
TP1: 4,218
TP2: 4,170
TP3: 4,110 – 4,130
Alternative Sell Scenario
If gold pushes toward 4,329 – 4,383 and shows rejection, sellers may react again from the upper liquidity area.
Sell Condition: Wait for bearish rejection, failed breakout, or lower-timeframe bearish CHoCH around 4,329 – 4,383.
Target: 4,285 – 4,218
Buy Scenario – Only Short-Term Reaction
Buy is not the main view while gold remains below the upper liquidity area. However, if price holds above 4,285 – 4,290, a short-term recovery may still appear.
Buy Zone: 4,285 – 4,290
Entry Condition: Bullish rejection, liquidity sweep, or lower-timeframe bullish CHoCH from the buy zone.
Take Profit:
TP1: 4,329
TP2: 4,383
Invalidation: If price breaks and holds below 4,285, the buy idea becomes weaker.
MY VIEW ON GOLD
My current view for gold is accumulation with sell priority. Price is holding above the buy zone for now, but the market has not confirmed a strong bullish breakout.
The cleaner plan is to avoid entering in the middle of the range. If gold loses 4,285 – 4,290, sellers may push price toward 4,218 and 4,170. If price moves higher first but rejects around 4,329 – 4,383, that area may also provide a better sell reaction.
Overall, gold is still consolidating below liquidity. I prefer waiting for confirmation, with sell setups becoming more attractive if the buy zone fails or the upper liquidity area rejects.
Do you think gold will break below 4,285 first, or sweep 4,383 before sellers return? Long 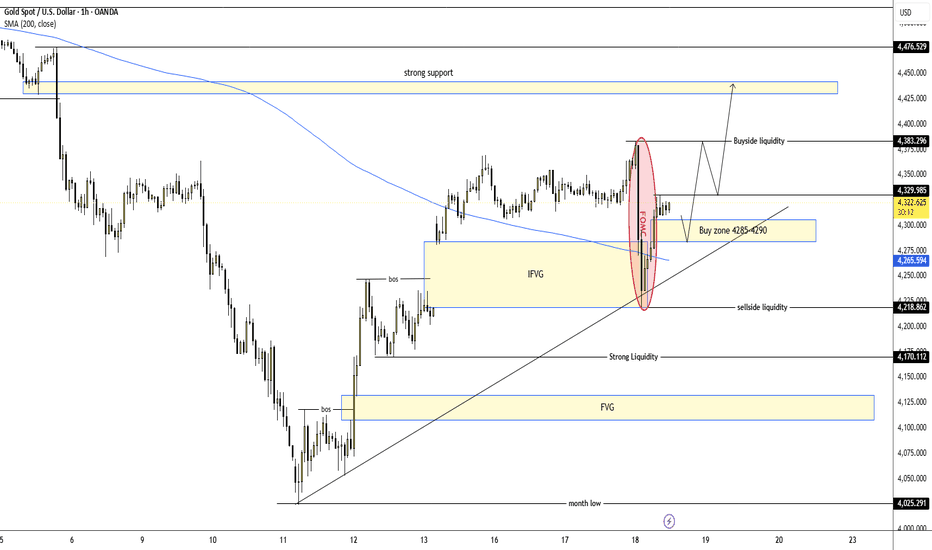
XAUUSD -Strong Bullish Reaction After FOMC Strong Bullish Reaction After FOMC, Buy Retest Remains Priority
Gold is trading around $4,320 after a strong bullish reaction following the FOMC move. Price swept the weekly low near $4,219, then recovered sharply and reclaimed short-term structure.
From an SMC perspective, the market has already shown CHoCH and strong bullish displacement. The current pullback into $4,311–$4,320 is important because this area aligns with the FVG and retest liquidity zone. As long as gold holds above this zone, the bullish continuation scenario remains active.
The next upside liquidity sits around the week high at $4,383, followed by the trendline area near $4,421. If buyers continue to defend the retest zone, gold can extend toward the main OB sell zone at $4,466–$4,471.
Buy setup 1
Condition:
Gold holds the $4,311–$4,320 retest liquidity zone and prints bullish rejection with lower-timeframe MSS / CHOCH.
Entry: $4,311–$4,320
SL: below $4,290
TP1: $4,383
TP2: $4,421
TP3: $4,466–$4,471
Buy setup 2
Condition:
If gold breaks and holds above the week high at $4,383, wait for a retest before looking for continuation.
Entry: $4,380–$4,390 after breakout retest
SL: below $4,350
TP1: $4,421
TP2: $4,450
TP3: $4,466–$4,471
Sell setup
Condition:
Selling is not the priority right now. A sell setup is only valid if gold reaches the $4,466–$4,471 OB sell zone and shows clear rejection with bearish MSS / CHOCH.
Entry: $4,466–$4,471 after rejection
SL: above $4,490
TP1: $4,421
TP2: $4,383
TP3: $4,320
Key levels
Current price area: $4,320
Buy retest liquidity: $4,311–$4,320
Week low: $4,219
Week high: $4,383
Trendline target: $4,421
Main OB sell zone: $4,466–$4,471
Bullish invalidation: clean 1H close below $4,290
My current view is bullish after the FOMC reaction while gold holds above the $4,311–$4,320 retest zone. The best Prime Gold plan is to wait for price to confirm support at liquidity, then follow the next upside move toward the upper OB zone.
No confirmation, no trade.
Long 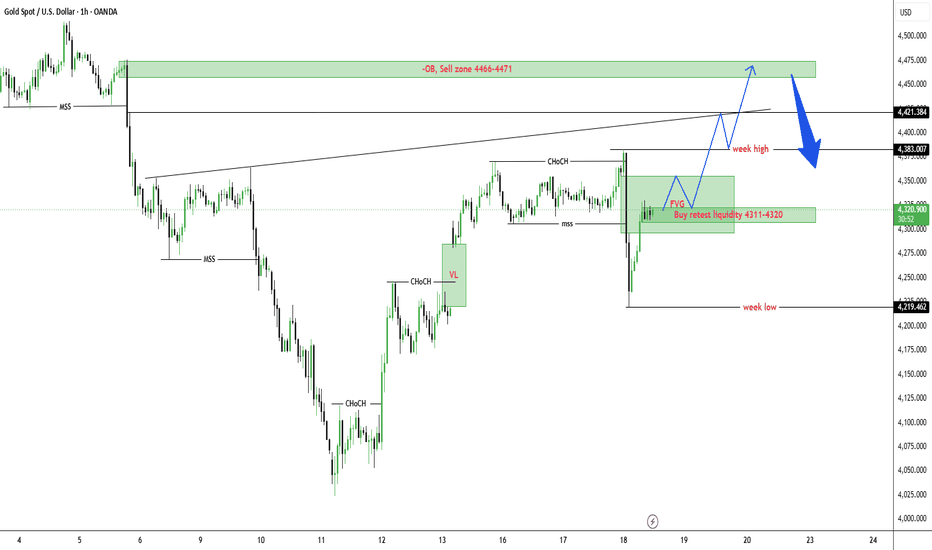
XAUUSD M45: Gold Recovers From Weekly Low, But 4,360 Remains XAUUSD M45: Gold Recovers From Weekly Low, But 4,360 Remains Key Resistance
Fundamental Analysis
Gold is recovering after the sharp post-FOMC drop into the weekly low area. Optimism around the US-Iran peace agreement is supporting short-term demand as traders take profit on the US dollar.
However, the Fed’s hawkish tone still limits the upside. As long as USD remains supported by rate expectations, gold needs stronger confirmation before the recovery can turn into a clean bullish continuation.
Technical Analysis
On the M45 timeframe, gold is trading around 4,314 after being rejected from the 4,360 - 4,380 resistance zone. This area is the main sell zone on the chart and also sits near the current strong high.
From an SMC view, price has recovered from the weekly low and returned above the internal bullish OB. However, buying momentum is not strong enough yet while price remains below 4,330 - 4,340.
The key buy reaction zone is 4,220 - 4,240. If price pulls back into this area and buyers defend it, gold may create another recovery move. If price loses 4,220, the next downside area is 4,180 - 4,200.
Key Price Zones
Current price: 4,314
Short-term resistance: 4,330 - 4,340
Main sell zone: 4,360 - 4,380
Buy reaction zone: 4,220 - 4,240
Lower support: 4,180 - 4,200
Deep demand zone: 4,055 - 4,080
Bullish confirmation: Above 4,340
Bearish risk: Below 4,220
Trading Plan
Primary Scenario: Buy From Pullback
Entry: 4,220 - 4,240 after bullish confirmation
Stop Loss: Below 4,180
Take Profit 1: 4,330 - 4,340
Take Profit 2: 4,360 - 4,380
Take Profit 3: 4,400
Entry Conditions
Price pulls back into the 4,220 - 4,240 buy zone.
Buyers show clear rejection from this area.
M45 or lower timeframe forms bullish CHOCH.
Price reclaims 4,304 - 4,314 with strength.
Avoid buying if price breaks and holds below 4,220.
Alternative Scenario: Sell From Resistance
Entry: 4,360 - 4,380 after bearish confirmation
Stop Loss: Above 4,400
Take Profit 1: 4,330
Take Profit 2: 4,240
Take Profit 3: 4,200
Sell Conditions
Price needs to retest the 4,360 - 4,380 sell zone and fail to break higher. If bearish rejection appears there, gold may correct back toward the lower support zones.
Breakdown Scenario
Entry: Below 4,220 after confirmed breakdown and retest
Stop Loss: Above 4,250
Take Profit 1: 4,200
Take Profit 2: 4,180
Take Profit 3: 4,080
Overall View
Gold has recovered from the weekly low, but the structure is not fully bullish yet. The first key level buyers need to reclaim is 4,330 - 4,340, while 4,360 - 4,380 remains the main resistance zone.
The better plan is to avoid chasing price in the middle. Wait for either a clean pullback into 4,220 - 4,240 for buy confirmation, or a rejection from 4,360 - 4,380 for a short-term sell reaction.
Do you think gold will defend 4,220 - 4,240 and recover again, or reject from 4,360 - 4,380 first?
Short 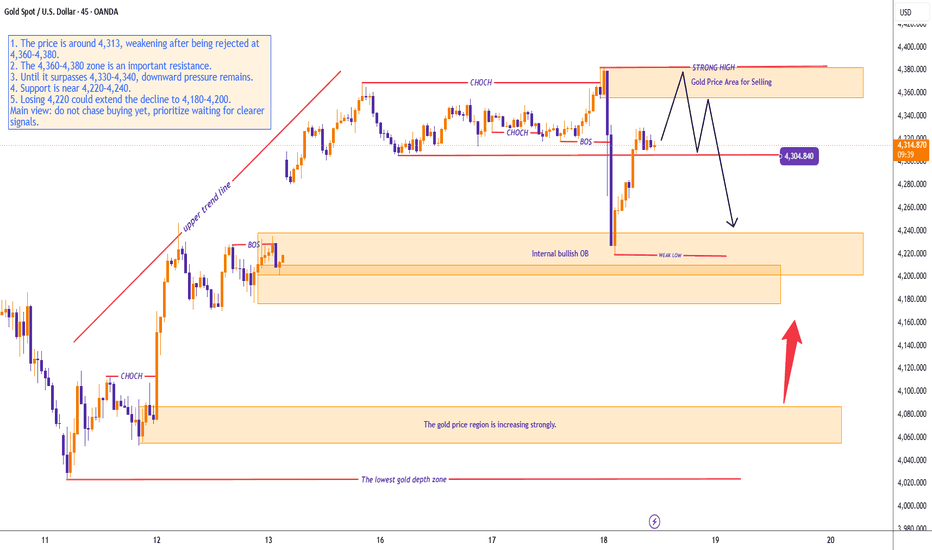
XAUUSD — Recovery Into FVG, Then Bearish Reaction Expected
Gold is trading around $4,327 after holding above the short-term support near $4,306. Price is showing a recovery move, but the larger structure is still not fully bullish.
From an SMC perspective, gold is likely moving toward the upper FVG zone around $4,420–$4,430. This area is important because it was previous strong support, and now it can act as a reaction zone if price retests it from below.
My main view is that gold can continue higher first to fill the FVG and test the old support zone. After that, if price shows rejection, the next move may turn bearish again toward the lower liquidity zones.
Buy setup
Condition:
Gold must hold above $4,306 and confirm bullish continuation on lower timeframe.
Entry: $4,310–$4,330
SL: below $4,285
TP1: $4,360
TP2: $4,400
TP3: $4,420–$4,430
This buy setup is only for the recovery move into the FVG zone, not a full bullish reversal.
Sell setup
Condition:
Gold reaches the $4,420–$4,430 FVG zone and shows rejection with bearish MSS / CHOCH confirmation.
Entry: $4,420–$4,430
SL: above $4,455
TP1: $4,306
TP2: $4,205
TP3: $4,104
Continuation sell setup
Condition:
If gold breaks below $4,306 and retests it as resistance, bearish continuation becomes valid.
Entry: below $4,306 after retest
SL: above $4,335
TP1: $4,205
TP2: $4,160
TP3: $4,104
Key levels
Current price area: $4,327
Strong support: $4,306
FVG / old support reaction zone: $4,420–$4,430
Buy zone OB: $4,205
Lower liquidity target: $4,104
Bullish invalidation: clean 4H close below $4,285
Bearish invalidation: clean 4H close above $4,455
My current view is gold may rise first to test the FVG and old support zone, but this area is where I will watch for a bearish reaction. The best Prime Gold plan is to avoid chasing the middle range and wait for price to reach a major liquidity zone before entering.
No confirmation, no trade.
Short 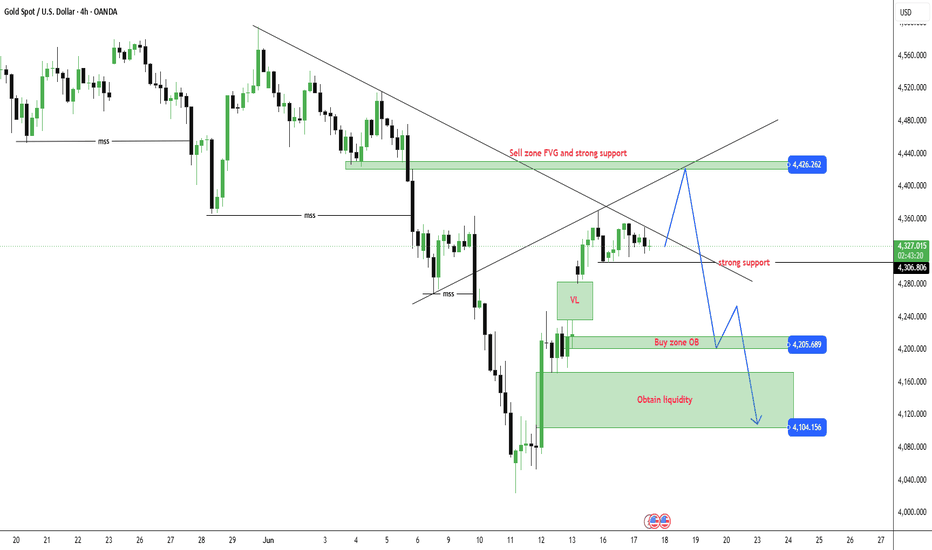
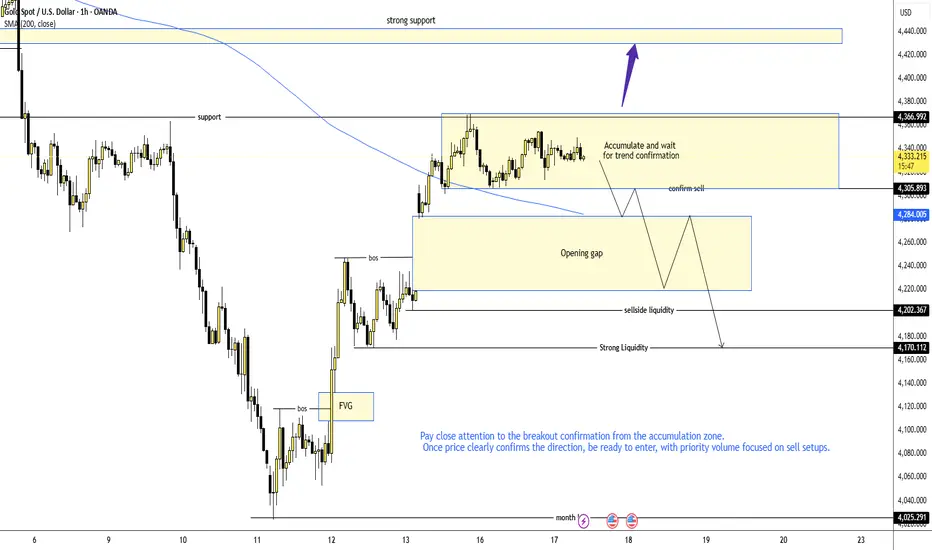
XAUUSD – Gold accumulating, selling confirmation needed.Gold is currently moving inside a clear accumulation range on the H1 chart. Price is holding between the upper resistance around 4,366 and the lower confirmation area near 4,305. The market has not broken direction yet, so the best approach is to wait for confirmation from this range before considering the next setup.
FUNDAMENTAL ANALYSIS
Gold is still reacting to the U.S. dollar, Treasury yields and upcoming U.S. data. For now, the market is showing hesitation, so the technical breakout from the accumulation zone will be more important.
If price fails to break higher and loses the lower range, sellers may regain short-term control.
TECHNICAL ANALYSIS – SMC + FIBONACCI
From an SMC perspective, gold has recovered strongly from the monthly low around 4,025 and created a bullish structure shift earlier. However, after reaching the current resistance area, price has started to slow down and move sideways.
The main accumulation zone is sitting around 4,305 – 4,366. This area shows that buyers and sellers are still fighting for direction. As long as price remains inside this range, the market may continue to build liquidity before the next strong move.
The key level to watch is 4,305. If gold breaks and holds below this level, the accumulation may turn into a distribution structure, opening the path for a deeper correction into the opening gap around 4,220 – 4,285.
Below that, sellside liquidity near 4,202 and strong liquidity around 4,170 may become the next downside targets. On the upside, only a clean breakout above 4,366 would weaken the sell view and open a possible move toward the strong support-turned-resistance zone around 4,435 – 4,445.
KEY PRICE ZONES TO WATCH
Current price area: 4,332
Accumulation range: 4,305 – 4,366
Confirm sell level: Below 4,305
Opening gap zone: 4,220 – 4,285
Sellside liquidity: 4,202
Strong liquidity: 4,170
Upper resistance: 4,366
Strong support-turned-resistance: 4,435 – 4,445
Month low: 4,025
Invalidation area for sell view: Above 4,366
TRADING SCENARIOS
Sell Scenario – Priority H1 View
If gold breaks below 4,305 and confirms weakness, I will watch for a sell continuation setup from the accumulation range.
Sell Zone: Below 4,305 after confirmation
Entry Condition: Clean break below the range, bearish retest, lower-timeframe CHoCH, or strong bearish displacement.
Stop Loss: Above 4,366 or above the nearest swing high.
Take Profit:
TP1: 4,285 – 4,220
TP2: 4,202
TP3: 4,170
Alternative Sell Scenario
If gold retests the upper range around 4,350 – 4,366 and shows rejection, sellers may react earlier from the accumulation high.
Sell Condition: Wait for bearish rejection from the upper range with confirmation on the smaller timeframe.
Target: 4,305 – 4,220
Buy Scenario – Only If Breakout Confirms
Buy is not the priority view while price is still inside the accumulation zone. However, if gold breaks and holds above 4,366, the short-term structure may shift higher.
Buy Zone: Above 4,366 after breakout confirmation
Entry Condition: Clean breakout, retest, bullish rejection, or lower-timeframe bullish CHoCH.
Take Profit:
TP1: 4,435 – 4,445
TP2: 4,476
Invalidation: If price fails to hold above 4,366 and returns back into the range, the buy idea becomes weaker.
MY VIEW ON GOLD
My current view for gold is accumulation with sell priority. The market is moving sideways between 4,305 and 4,366, so entering in the middle of the range is not clean.
The better plan is to wait for a clear breakout from the accumulation zone. If price breaks below 4,305, sellers may push gold into the opening gap around 4,220 – 4,285, then toward 4,202 and 4,170.
Overall, gold is not giving a clean direction yet, but the sell setup becomes more attractive if the lower range fails. Until then, confirmation is more important than prediction.
Do you think gold will break below the 4,305 accumulation support, or will buyers defend this range one more time? Short