BRIAN XAUUSD – GOLD STARTS THE WEEK ABOVE VALUE, BUT 4,400 IS BRIAN XAUUSD – GOLD STARTS THE WEEK ABOVE VALUE, BUT 4,400 IS THE REAL TEST
Gold begins the new week with buyers still holding control after the strong recovery from the 4,300 area. Price has pushed back above 4,400, but the market is now trading near an important decision zone where momentum needs confirmation.
From the fundamental side, the US dollar is facing renewed pressure as expectations for another Fed rate hike continue to fade. This gives gold short-term support. At the same time, Middle East tension remains active, so traders will closely watch new updates from the region and the upcoming July FOMC meeting minutes.
The technical picture is still bullish, but gold is now testing high value. This is where buyers must prove that the breakout is not only a reaction, but real acceptance.
Technical structure
On the H1 chart, gold has recovered strongly from the Lower Value Refill Zone around 4,348 - 4,352 and is now holding near the POC Acceptance Zone around 4,392.
This POC zone is the key level for the start of the week. As long as price holds above 4,390 - 4,395, buyers still have control and gold can continue towards the HVN Resistance Zone around 4,420.
Above that, the VAH Target Zone around 4,445 - 4,450 becomes the next major upside target.
However, if gold loses the POC Acceptance Zone, price may rotate back into the Lower Value Refill Zone before the next buyer reaction appears.
Important zones
POC Acceptance Zone: 4,390 - 4,395
Current decision zone and short-term buyer control area.
Lower Value Refill Zone: 4,348 - 4,352
Main pullback support if gold needs a deeper reset.
HVN Resistance Zone: 4,415 - 4,420
First resistance where sellers may react.
VAH Target Zone: 4,445 - 4,450
Main upside target if buyers keep momentum.
Current price area: 4,390 - 4,400
Gold is holding high value, but still needs acceptance above 4,400.
Trading scenario
Buy reaction from POC Acceptance Zone 4,390 - 4,395
Entry:
Look for buy positions only if price holds around 4,390 - 4,395 and shows clear bullish rejection.
Stop Loss:
Below the POC Acceptance Zone or below the local pullback structure.
Take Profit:
TP1: 4,415 - 4,420
TP2: 4,445 - 4,450
TP3: Trail higher only if gold accepts above the VAH Target Zone
This setup follows the current bullish structure, but avoids chasing price blindly after a strong rebound.
Alternative scenario
If gold fails to hold 4,390 - 4,395, the better reaction may come lower around 4,348 - 4,352.
That would not immediately destroy the bullish trend. It would only mean gold needs to refill lower value before continuing higher.
Final view
Gold starts the week with a bullish structure. Buyers are still active, the daily setup remains positive, and price is holding above reclaimed value.
But the 4,400 area is not a simple level. It is where momentum must prove itself.
If buyers defend the POC Acceptance Zone, gold can continue towards 4,420 and 4,450.
If this zone breaks, I will wait for the deeper value reaction around 4,350.
For now, the plan is simple:
Do not chase the top.
Wait for value.
Let 4,390 decide the next move.
Will gold accept above 4,400 this week, or will buyers need one more pullback before the next push?
 Long
Long
GOLD MAY BE READY TO WIPE OUT THE BUYERS — HERE’S WHYGood morning, everyone. Before you take any buy trade on Gold today, I want you to stop and look at what the market is actually doing. Yesterday’s upside move may have looked bullish, but I believe there is something much bigger happening underneath the price action. The market is currently sitting in a zone where buyers are heavily crowded, sellers are disappearing, and liquidity is becoming extremely important. And when the majority starts expecting the same breakout, that is exactly when the market can turn against them. My bias is still strongly bearish below $4423–$4417, and if the market plays out the way I’m expecting, today’s upside movement could simply be the setup for a much bigger downside move. 🔥
As I explained yesterday, the low from last Friday was around $4310, which was formed very close to the starting low of last week. Because of this, a lot of traders have entered buying positions from that area, expecting the market to continue higher and potentially break last week’s high around $4450 with strong upside momentum.
As I mentioned, the bullish bias in the market is already very active, while the number of sellers is relatively low. And if there are not enough sellers in the market, there is not enough selling liquidity available for the market to use. The market always needs liquidity to create a meaningful move. So, when selling liquidity is limited, I do not expect the market to sustain a strong upside move from the current levels. In my view, the market needs to move lower first.
Yesterday, we saw upside momentum, but I believe that move was mainly designed to trap traders who were heavily biased toward $4400 and to trap sellers while encouraging more buyers to enter the market. If you look closely at yesterday’s price action, the upside move was extremely choppy. Sellers repeatedly tried to enter around this area, but they were continuously trapped. Because of this, many sellers may have already lost the confidence to continue selling, while a random bullish bias has now developed across the market.
This is exactly why the stop-loss levels of those buyers are becoming important. The first key level is around $4397, where the stop-loss is currently positioned. The market is trying to hold above this level, while $4400 remains a very important psychological number. Because of its psychological importance, we are repeatedly seeing breakouts and breakdowns around this area.
My advice is simple: do not aggressively buy or sell directly around $4400. Let the market create a clear bias first. If we see some short-term buying momentum, I would rather wait for the market to move higher and then look for a selling opportunity from the top.
Overall, I remain strongly bearish below the $4423–$4417 area. If the market moves and sustains above this zone, I may reconsider and change my plan. But as long as price remains below it, my overall bias remains bearish. Considering the strong selling volume that came into the market during the Asian session from around $4440, I believe the conditions are favoring another selling move.
Another important point is Monday’s low. I am expecting the possibility of a breakdown of that low today. Just like Monday, many traders may prefer to buy the dip and wait for a breakout of the previous high. However, if you look carefully at the structure, the Asian low formed on Tuesday has already been broken. Because of this, we may see a short-term upside move from here that could convince traders that the market is preparing for another breakout.
But I don't think that will necessarily happen. The market may attempt to move higher multiple times, and each attempt could make traders believe that the previous high is about to break. However, if buyers continue getting trapped on these attempts, the market could eventually reverse sharply to the downside. This is the kind of projection I am currently seeing for today.
At the same time, $4440 has acted as a strong resistance level. The market moved toward this area because the closer price gets to the previous high, the more traders start entering buy positions expecting breakout momentum. That exact behavior has already happened, and as a result, buyers are currently heavily trapped.
So overall, my plan remains bearish because I have a strong conviction that there is still significant liquidity around $4300, where a large number of traders remain active. With so much positioning and bias concentrated around that area, I don't expect the market to simply deliver a clean upside breakout from the current levels. In my view, a downside move needs to happen first so that the buyers currently trapped in the market can be liquidated and fresh selling liquidity can build up.
I hope you guys enjoyed yesterday’s analysis and are now prepared for today’s trading session. As always, make sure you trade with proper risk management and money management. And let me know in the comments what your trading plan for Gold is today.
Thank you, and trade safe. ♥️
XAUUSD: 4,416 Breaks, Bulls Take the WheelXAUUSD: 4,416 Breaks, Bulls Take the Wheel
Market Context
Gold starts the new week holding a positive technical tone, but price is now sitting right under an important decision area. On the daily chart, XAUUSD remains supported above key moving-average structure, while RSI is still bullish but not yet overbought. This means buyers still have room to push higher if they can break resistance cleanly.
The broader trend is still constructive, but the market is not in a free breakout yet. Price is trading near 4,400, and this level is acting like the line between continuation and another short-term rejection.
Key point: gold is bullish above demand, but buyers need to break 4,405 - 4,416 to confirm the next upside move.
Technical Structure
Gold is trading around 4,395 after recovering from the 4,312 - 4,322 buy zone. Buyers reacted well from that area, but price is now approaching the Seller Pressure Chamber around 4,370 - 4,385 and the key 4,400 level.
The nearest resistance is 4,405 - 4,416. If buyers break this range with strength, gold can continue toward the Liquidity Sniper Zone around 4,420 - 4,435.
However, if price fails below 4,400 and rejects from 4,405 - 4,416, sellers may try to push gold back toward 4,370 - 4,385 first.
The deeper support remains 4,312 - 4,322. This is the important buy zone buyers must protect if the market pulls back again. Below that, 4,225 - 4,240 is the Smart Money Recovery Base and becomes the deeper demand area for the week.
Key Levels
Current Price: 4,395
Key Decision Level: 4,400
Near Resistance: 4,405 - 4,416
Liquidity Sniper Zone: 4,420 - 4,435
Seller Pressure Chamber: 4,370 - 4,385
Important Buy Zone: 4,312 - 4,322
Smart Money Recovery Base: 4,225 - 4,240
Bullish Continuation: Above 4,416
Bearish Pullback Risk: Below 4,370
Trading Plan
Buy Breakout
Entry: Above 4,416 after breakout + retest
SL: Below 4,385
TP: 4,420 / 4,435 / 4,450
Condition: Price must break above 4,405 - 4,416 with strength, retest successfully, and hold above 4,400. This confirms buyers are taking control of the weekly opening structure.
Buy Pullback
Entry: 4,370 - 4,385 after bullish confirmation
SL: Below 4,350
TP: 4,400 / 4,416 / 4,435
Condition: Price pulls back into the Seller Pressure Chamber and holds as support. Buyers need to show a clean reaction before any long setup becomes valid.
Deep Buy Re-entry
Entry: 4,312 - 4,322
SL: Below 4,280
TP: 4,370 / 4,400 / 4,416
Condition: Price corrects deeper into the important buy zone and shows strong bullish rejection. This is the cleaner re-entry area if gold needs one more reset before continuation.
Sell Reaction
Entry: 4,405 - 4,416 after bearish rejection
SL: Above 4,435
TP: 4,385 / 4,370 / 4,322
Condition: Price fails to break above resistance and rejects from the 4,405 - 4,416 zone. This is only a short-term reaction sell, not the main bias unless gold later breaks below 4,370.
Breakdown Sell
Entry: Below 4,370 after breakdown + retest
SL: Above 4,400
TP: 4,322 / 4,312 / 4,240
Condition: Price loses the Seller Pressure Chamber, retest fails, and bearish momentum increases. This would suggest buyers are losing short-term control.
Overall Bias
Gold remains positive while price holds above 4,312 - 4,322. The daily structure still supports the bullish recovery, and RSI has room before reaching overbought territory.
For the new week, the main level is 4,416.
Above 4,416, gold can extend toward 4,420 - 4,435 and possibly 4,450.
Below 4,370, the market may need a deeper pullback toward 4,312 - 4,322 before buyers try again.
Best approach: do not chase in the middle. Wait for either a confirmed breakout above 4,416 or a clean pullback into support.
Will buyers break 4,416 and continue the weekly rally, or will sellers defend 4,400 again? Short 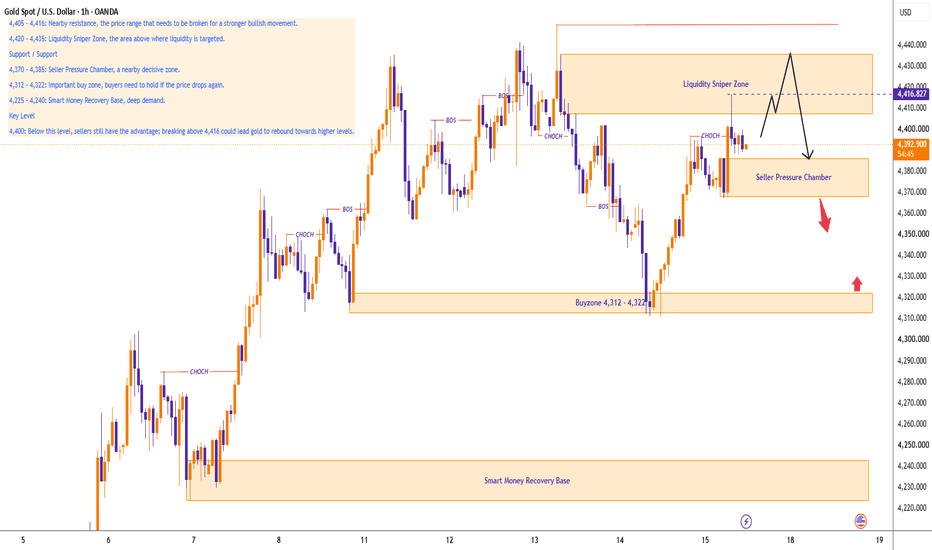
H2 Bullish Retest Before Liquidity Expansion
XAUUSD is trading around 4,405 after recovering from the latest CHoCH and confirming another bullish MSS/BOS sequence. The broader H2 structure remains constructive, but price is now approaching a key resistance and liquidity area.
Gold continues to find support from a softer U.S. dollar and reduced expectations of another near-term Fed hike following weaker U.S. economic data. Renewed safe-haven demand amid rising U.S.–Iran tensions is also supporting the metal. However, higher oil prices and Treasury yields remain near-term risks. Markets are now looking towards the July FOMC minutes on August 19 for the next policy signal.
Technical View
Gold continues to hold above the rising H2 support structure. The latest recovery has pushed price back into the 4,385–4,425 resistance/liquidity zone, making a fresh entry at current levels less attractive.
The 4,345–4,370 area remains the preferred buy/retest zone. This region aligns with previous market structure and could provide the next higher-low formation if buyers step back in.
If the correction deepens, the 4,295–4,320 area becomes the key demand zone. A strong reaction from this region would keep the broader H2 bullish structure intact.
On the upside, sustained acceptance above 4,425 would open the path towards the measured range objective at 4,451.836, followed by the premium liquidity target around 4,490–4,520.
Key Zones
Current Price: 4,405.160
Buy Priority: 4,345–4,370
Demand / Strong Support: 4,295–4,320
Resistance / Liquidity: 4,385–4,425
Range Objective: 4,451.836
Premium Liquidity Target: 4,490–4,520
Bullish Invalidation: Below 4,290
Trading Plan
Buy Priority: 4,345–4,370
Condition: Wait for an H2 pullback followed by bullish rejection, a liquidity-sweep reclaim, or a confirmed higher-low formation.
SL: Below 4,290
TP1: 4,405–4,425
TP2: 4,451.836
TP3: 4,490–4,520
Important Note
Price is already trading within a resistance zone, so chasing the current move offers weaker risk-to-reward.
The cleaner approach is to wait for a controlled pullback into the 4,345–4,370 retest zone.
A deeper sweep into 4,295–4,320 would still be compatible with the bullish outlook, provided buyers reclaim the demand area and confirm a higher low.
Sustained H2 acceptance below 4,290 would invalidate the immediate bullish continuation setup.
Final View
The H2 structure remains bullish, but price is currently at a decision point near resistance. The preferred setup is a controlled retest of 4,345–4,370, followed by bullish confirmation before targeting 4,425, 4,451, and ultimately the premium liquidity zone above 4,490.
Will gold complete the retest before the next expansion towards 4,500? Long 
Gold M30 Bearish Rejection — Flush to 4,311 Next?
Market Overview
• Macro Driver: As the market kicks off the new week digesting last week's cooling CPI/PPI prints, the US Dollar Index (DXY) stabilizes tightly around 99.70. Institutional participants are positioning defensively ahead of the upcoming FOMC Meeting Minutes and the late-August Jackson Hole Symposium.
• Smart Money Flow: Following an aggressive liquidity grab into the Premium Supply Retest Array (4,408 - 4,418), institutional order flow executed an immediate intraday rejection, initiating a markdown expansion phase to liquidate late longs.
Technical Context
• Structure: Bearish Shift on M30. Price failed to sustain above the recent BOS highs and printed an impulsive displacement down, establishing clear bearish order flow.
• Imbalance & Liquidity: The sharp sell-off has tapped the interim FVG area (4,354 - 4,364). The algorithmic pathway anticipates a shallow relief retest of internal supply before resuming the downward flush to sweep Sell-Side Liquidity resting below the Strong Swing Low floor (4,311.79).
Key Zones
• Weak High (Buy-Side Liquidity Pool): 4,449.91
• Premium Supply Retest Array: 4,408.00 - 4,418.00
• Intraday Mitigation FVG: 4,354.00 - 4,364.00
• Immediate Support Pool: 4,318.00 - 4,324.00
• Macro Floor (Strong Swing Low): 4,311.79
Trading Plan (IF–THEN)
• IF price delivers a corrective pullback into the internal FVG/Supply zone (4,375 - 4,390) AND validates lower-timeframe (M3/M5) bearish displacement -> THEN look to execute Short positions targeting 4,354.000, expanding down to sweep the Strong Swing Low at 4,311.796 and mitigate the Immediate Support Pool (4,318 - 4,324).
• IF price invalidates the setup with an M30 candle close firmly above 4,420.000 -> THEN the immediate bearish expansion narrative is postponed, resetting the market into broader consolidation.
. MMFLOW View
• Bias: Bearish Continuation. Do not buy into falling knives. Our mathematical edge favors riding the institutional expansion from premium rejection down into discount liquidity pools. Practice strict risk management.
How are you navigating Gold this Monday? Shorting the pullback or waiting for the demand floor? Short 
Long 
 Long
Long
Long 
SILVERMIC: Volatility Compression at Major ResistanceCategory: Technical Analysis
Bias: Long
Timeframe: 1D (Daily)
The Macro Sentiment & Setup
Silver is currently sitting at a fascinating crossroads. Driven by shifting global macroeconomic winds and its dual identity as both a precious safe-haven and a critical industrial metal, market sentiment is pivoting from bearish exhaustion to quiet accumulation.
Looking at the SILVERMIC1! daily chart, we are witnessing a textbook volatility squeeze. Following a steep corrective leg, price action has been boxed into a tight, defined base (highlighted by the red zone). This isn't just sideways chop; it's a structural battleground.
Advanced Technical Breakdown
Volatility Compression (The ATR Squeeze): As price tightly compresses within this rectangular base, the Average True Range (ATR) naturally contracts. In market dynamics, prolonged periods of extreme volatility compression act like a coiled spring, serving as the precursor to explosive directional expansion.
The Institutional Footprint: Notice the price action at the bottom of the box. The failure to break lower despite repeated tests suggests strong, passive demand stepping in. This base-building phase is a classic signature of smart money absorbing retail supply and establishing a foundation for the next leg up.
Momentum Shift: The price is now aggressively riding the upper boundary. The sellers are being repeatedly tested, and their liquidity pool at this resistance ceiling is draining.
The Trade Plan: Execution & Risk
The Trigger (240,100): This is the line in the sand. We are looking for a definitive daily candle close above 240,100. This validates the breakout, confirming that sellers have capitulated and a new trending phase is initiating. Do not front-run the breakout.
Invalidation: If we see a fake-out (a brief poke above resistance followed by a harsh rejection back into the middle of the accumulation zone), the bullish thesis is dead. Stop losses should be placed strategically below the breakout level or near the box's midpoint to protect capital.
Targets: A sustained breakout should trigger short-covering and momentum-based FOMO, pushing price discovery rapidly toward the previous structural swing highs.
Trade Smart, Manage Risk.  Long
Long
Short 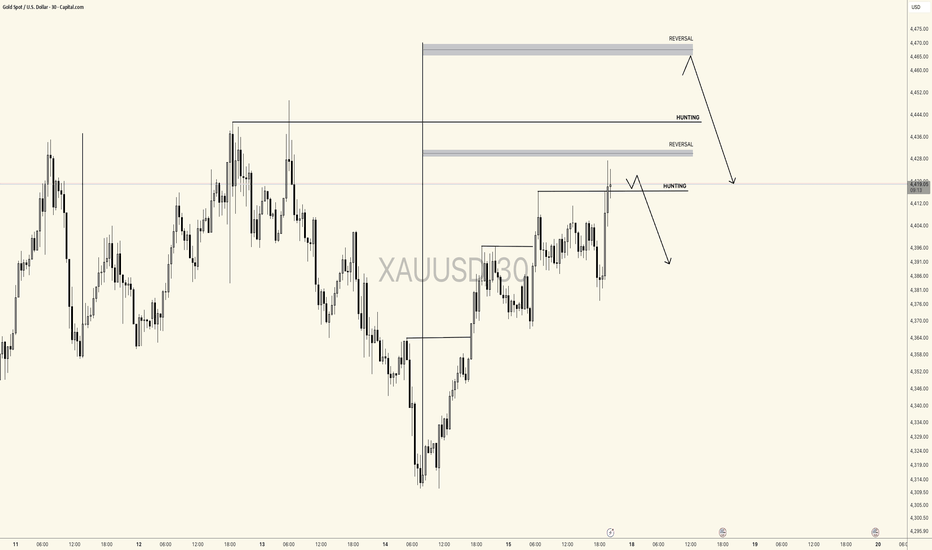
Gold Is Recovering, But Sellers Are WaitingGold is trying to rebuild bullish momentum after reacting from the lower trendline area.
Price has recovered from the 4,320 zone and is now trading around 4,370 - 4,380.
The bounce is clear.
But the chart is not giving a free buy signal yet.
Why?
Because gold is now moving between a support base and two important resistance zones above.
The simple read
The first important support is 4,353.
This is the Buy Zone / React Fibo area.
If gold holds above 4,353, buyers may try to push price back toward 4,395.
But 4,395 is the first OB Sell Zone.
That means the market may react there before choosing the next direction.
If buyers break and hold above 4,395, the next resistance becomes 4,424.
This is the stronger OB Sell / resistance zone.
Below 4,353, the next key area is 4,320.
This zone is important because it connects with the trendline retest and OB Buy structure.
If 4,320 fails, gold may move deeper toward 4,293 or 4,260.
Key price zones
Current price area: 4,370 - 4,380
First support: 4,353
Trendline retest zone: 4,320
Deeper buy zone: 4,293
Liquidity buy zone: 4,260
First resistance / OB Sell: 4,395
Strong resistance / OB Sell: 4,424
Trading plan
Recovery continuation
If gold holds above 4,353:
The short-term recovery remains valid.
Price may try to reach 4,395.
A clean break above 4,395 may open the way toward 4,424.
Resistance reaction
If gold reaches 4,395 and rejects:
Sellers may try to push price back toward 4,353.
If 4,353 breaks, 4,320 becomes the next support to watch.
Deeper pullback
If gold loses 4,320:
The recovery becomes weaker.
The next reaction zones are 4,293 and 4,260.
I will not treat these levels as automatic buy zones.
I want confirmation first. Short 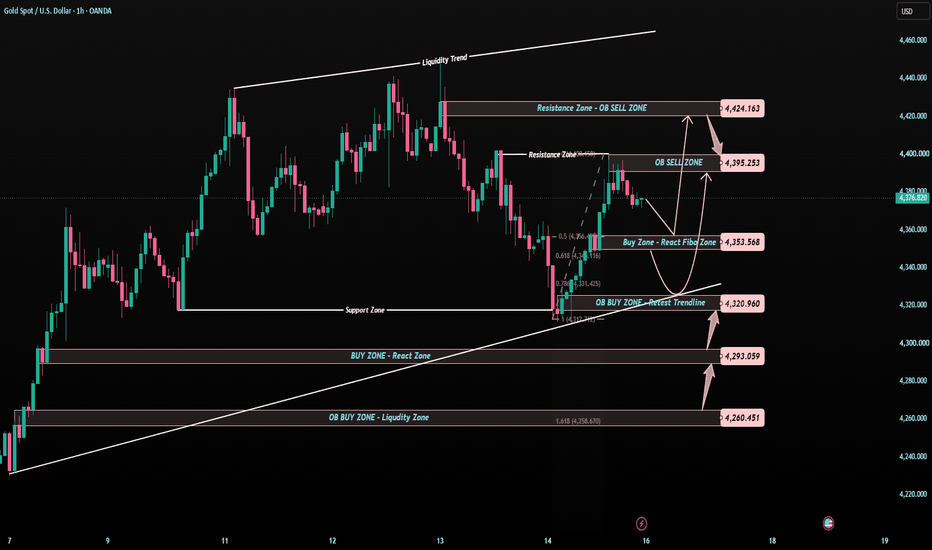
XAUUSD: Pullback Structure, 4.500 TargetXAUUSD is currently trading around $4,394. Spot Gold is up approximately 0.4% today, supported by a weakening US dollar and a decline in market-implied odds of a September Fed rate hike—now around 30%—following a series of softer US economic data releases.
On the H4 chart, the bullish structure remains intact following the trendline breakout earlier this month. The two most recent pullbacks saw renewed buying interest, with the price holding above the EMA34 and EMA89.
The $4,270–$4,330 zone remains a key support area. Should XAUUSD experience another pullback but hold this level, I favor a scenario where buyers step back in, pushing the price toward the $4,480–$4,500 range.
Macro factors currently align with the technical setup; however, as the market turns its attention to the July FOMC minutes, volatility may pick up again in the coming sessions. Long 
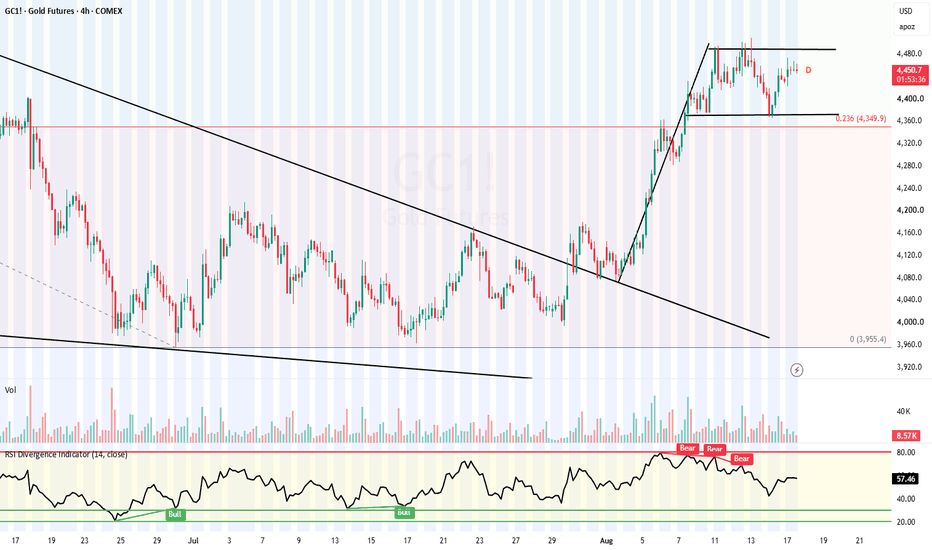
GOLD COMEX: Bullish Flag Pattern | Breakout Above $4490GOLD COMEX TECHNICAL ANALYSIS: BULLISH FLAG PATTERN | $4,370 SUPPORT & $4,490 BREAKOUT
GOLD COMEX — SHORT-TERM TECHNICAL VIEW
After the breakout from the Falling Wedge Pattern , Gold COMEX Futures witnessed a strong upward rally.
As discussed in our previous analysis, the 0.236 Fibonacci retracement level around $4,350 acted as an important support zone.
Previous Analysis:
CURRENT SETUP — 17 AUGUST 2026
On the 4-Hour Chart , Gold COMEX has formed a Bullish Flag Pattern following the sharp rally after the Falling Wedge breakout.
The current consolidation range is:
Flag Support: $4,370
Flag Resistance: $4,490
Any sustained 1-Hour candle close above $4,490 could confirm a bullish breakout and potentially trigger the next upward move.
TWO TRADING STRATEGIES
1. SWING TRADING STRATEGY
Look for buying opportunities around the $4,370 support zone .
Stop Loss: Below $4,340
2. BREAKOUT TRADING STRATEGY
Buy only after a confirmed breakout above $4,490 .
Stop Loss: $4,465
For breakout trades, traders should preferably confirm the breakout candle on both the 15-Minute and 1-Hour Charts before entering the trade.
KEY LEVELS TO WATCH
$4,370 — Flag Support
$4,490 — Breakout Resistance
$4,340 — Swing Trade Stop Loss
$4,465 — Breakout Trade Stop Loss
SHORT-TERM VIEW:
The overall short-term structure remains BULLISH as long as Gold holds the key support zone.
Trade with proper risk management and wait for confirmation before entering breakout trades.
#Gold #GoldCOMEX #GoldFutures #GoldTrading #GoldTechnicalAnalysis #GoldAnalysis #GoldPrice #TechnicalAnalysis #BullishFlag #BreakoutTrading #CommodityTrading
Long