Bitcoin chart analysis JUNE 18Hello
It's a Bitcoin Guide.
My analysis is optimized for TradingView.
If you press the Replay button, you can check real-time movements.
This is the Bitcoin 30-minute chart.
Since the current position is consolidating in a zone with many variables,
you need to stay focused.
I have created a strategy that is as simple as possible.
* Long position switching strategy before and after touching Zone 1 (purple finger) at the top
1. After confirming the touch of $64,497.1 (purple finger Zone 1) (optional short)
Switch to a long position at $63,502.3 (red finger) at the bottom
/ Stop loss if broken below the green support line
- Since there is a low probability that it could ignore Zone 1 and rise strongly,check if it breaks through the pink resistance line -
2. $65,442 long position 1st target -> Top 2nd target
- Although the movement within the purple parallel lines is consolidating, you must prepare for further declines because a MACD dead cross is in progress on the 12-hour chart. -
3. If the price drops immediately without touching Zone 1
,
the final long position waiting zone is Zone 2 at $62,914.6 at the bottom.
(This is where the 6+12 pattern is restored, and it must be touched before 9 PM to prevent it from breaking the Bollinger Band 12-hour centerline.)
From the point where the green support line is broken, the bottom
-> is open up to a maximum of $62, so please be careful.
I have summarized all possible movements for today at once, but
since we do not know what kind of movements will occur on the Nasdaq,
you must exercise absolute caution.
Please use my analysis post merely as a reference and for practical application,
and I hope you operate safely by adhering to trading principles and using stop-loss orders as a necessity.
Thank you.  Long
Long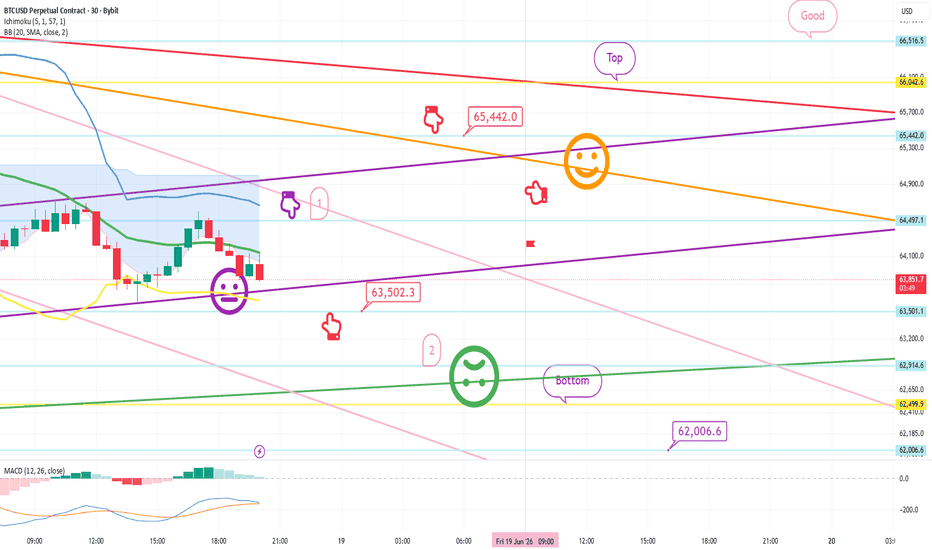
Short 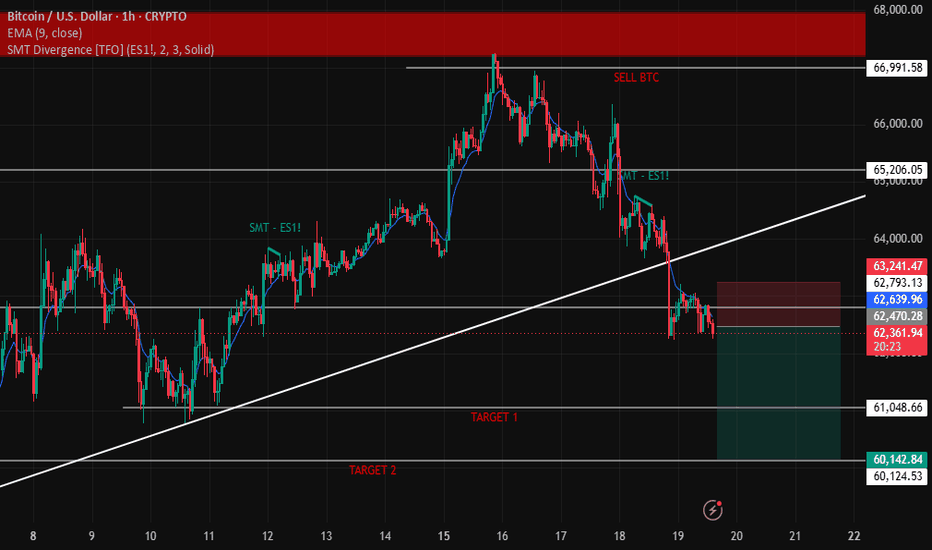
BICOIN making Bearish FLAG patternBITCOIN (BTCUSD) – BEARISH FLAG BREAKDOWN SETUP 📉
Timeframe: 15 Minutes (M15)
Bias: Bearish
Market Structure Analysis
Bitcoin experienced a strong impulsive sell-off, creating a sharp bearish move from the 64,400 area toward the 62,300 support zone. After this aggressive decline, price entered a consolidation phase and started moving sideways in a tight range.
This consolidation forms a Bearish Flag Pattern, which is typically a continuation pattern indicating that sellers are taking a temporary pause before potentially continuing the downtrend.
Pattern Formation
1️⃣ Flagpole Formation
The initial sharp drop represents the flagpole.
✅ Strong bearish momentum
✅ Large bearish candles
✅ Aggressive seller dominance
✅ Breakdown of previous support levels
This move established the bearish trend.
2️⃣ Flag Consolidation
After the sell-off, price began consolidating between:
Resistance: 62,311 – 62,325
Support: Around 62,225
During this phase:
Volatility decreased
Momentum slowed
Buyers failed to create higher highs
Price remained trapped inside a narrow range
This indicates accumulation of sell orders rather than genuine bullish strength.
Trade Setup
Entry Trigger
Sell below 62,225 support
A clean candle close below support would confirm the bearish flag breakdown.
Stop Loss
Above 62,325 resistance
If price breaks and closes above the flag resistance, the bearish setup becomes invalid.
Target Zones
🎯 Target 1: 61,900
🎯 Target 2: 61,500
🎯 Target 3: 61,000
The projected move is based on measuring the height of the flagpole and extending it from the breakdown point.
Why This Setup Is Bearish
🔴 Lower High Formation
Each recovery attempt is weaker than the previous one, showing buyers lack strength.
🔴 Weak Consolidation
Price is not rallying aggressively after the sell-off, indicating bearish control remains intact.
🔴 Resistance Holding
The 62,311–62,325 zone continues acting as a supply area.
🔴 Trend Continuation Probability
Bearish flags statistically have a high probability of continuing the prevailing downtrend after confirmation.
Trading Psychology
Many traders interpret the sideways movement as a reversal. However, experienced traders recognize that:
✔ Strong sell-off + weak consolidation = continuation setup
✔ Buyers are unable to reclaim key levels
✔ Sellers are absorbing buying pressure
Once support breaks, trapped buyers often accelerate the next bearish move. Short 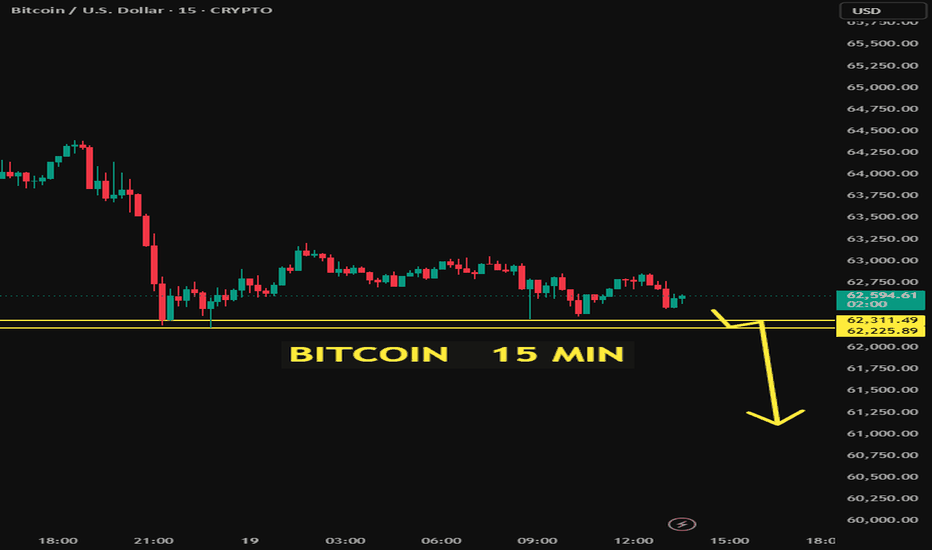
GOLD/XAUUSD swing trade Target Achieved today 1:5 R-REWARDXAUUSD / GOLD – TARGET ACHIEVED (1:5 RISK-REWARD) 📉✅
trade given on 17/06/2026
Discipline + Patience + Risk Management = Consistent Results
Date: 19 June 2026
Timeframe: 30 Minutes (M30)
Bias: Bearish
Market Structure Analysis
Gold was trading inside a range and repeatedly faced rejection from the 4,309 resistance zone. Buyers failed to create a sustained breakout above resistance, indicating weakness in bullish momentum.
Key Observations:
✅ Multiple rejections from resistance zone
✅ Lower highs started forming near resistance
✅ Sellers defended the 4,309 area aggressively
✅ Breakdown below key intraday support confirmed bearish control
Trade Setup
Sell Entry Zone
4,309.495 – 4,301.306
After price rejected the resistance area, a bearish confirmation candle formed and sellers entered the market.
Stop Loss
Above 4,309.495
The stop loss was placed above the resistance zone because a breakout above this level would invalidate the bearish setup.
Target Zone
4,173.017 – 4,168.658
This target area was selected based on:
Previous support zone
Liquidity area below market structure
Strong probability demand zone
Trade Execution
Price reached the resistance zone.
Buyers failed to break higher.
Bearish rejection confirmed seller dominance.
Support breakdown triggered strong downside momentum.
Price continued creating lower highs and lower lows.
Selling pressure accelerated throughout the session.
Target zone was hit perfectly.
Why This Trade Worked
1. Resistance Rejection
Price respected the major resistance zone around 4,309, showing that sellers were defending the area.
2. Break of Structure (BOS)
The breakdown below support confirmed a bearish market structure shift.
3. Momentum Confirmation
Large bearish candles indicated institutional selling pressure.
4. Trend Continuation
After the breakdown, every pullback was sold, leading to continuous downside movement.
Result
🏆 Target Achieved Successfully
🎯 Target: 4,173.017 – 4,168.658
📉 Move Captured: Approximately 130+ points
⚡ Risk-Reward: 1:5
✅ Perfect resistance rejection
✅ Clean breakdown setup
✅ Strong bearish continuation
✅ Target hit with disciplined execution
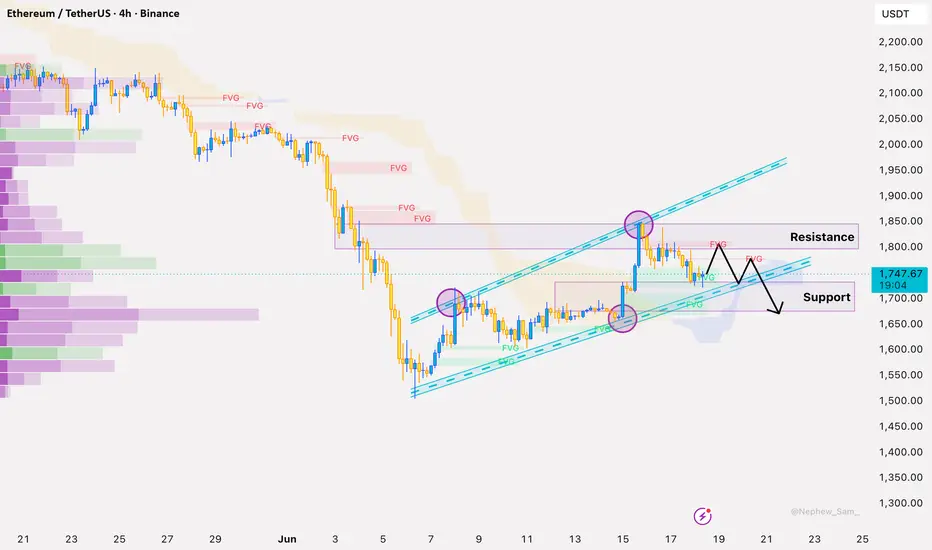
ETHUSDT Rally Slows Near $1,760 ResistanceEthereum has bounced well from the $1,550 area, but the recovery is now losing strength near $1,740–1,760. Buyers have reacted, but they still have not shown enough momentum to confirm a stronger bullish reversal.
For traders, this looks more like a sell-on-rejection setup unless ETH breaks above $1,760 with strength.
Trade Setup:
Sell Zone: $1,740 – $1,760
Stop Loss: $1,790
Take Profit 1: $1,680
Take Profit 2: $1,620  Short
Short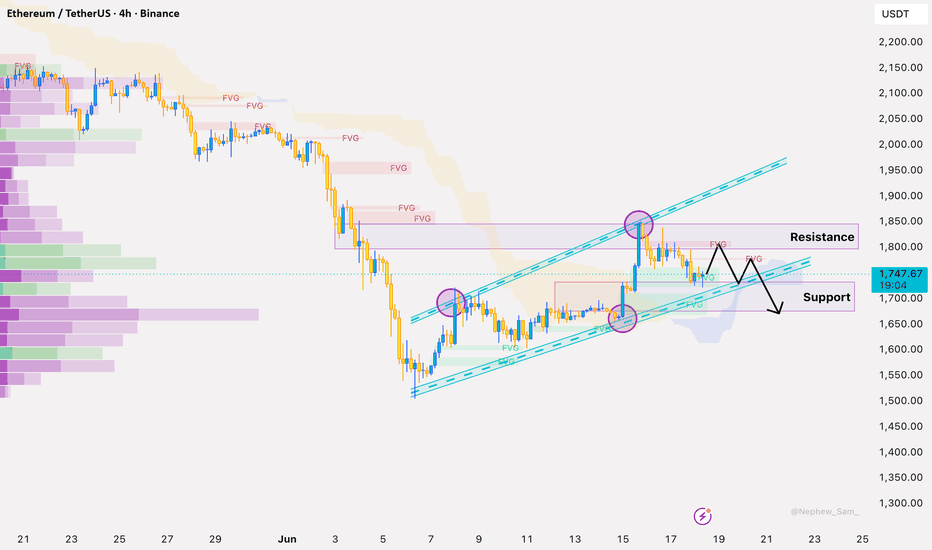
 Long
Long
 Long
Long
Short 
 Short
Short
ASML 4H Bearish Move ConfirmationPrice has successfully swept buy-side liquidity above previous highs and is currently trading within a major resistance region. The recent expansion created an imbalance (Fair Value Gap) below current price, leaving a notable inefficiency around the $1,780-$1,820 area. Markets frequently revisit these zones as liquidity is rebalanced.
If sellers begin defending current highs, the first objective would be a retracement into this imbalance region.
Key Levels
Resistance: $1,940 - $1,950 (Current Buy-Side Liquidity)
First Target: $1,700 - $1,730
Second Target: $1,550 - $1,580
But overall, the long-term ASML thesis remains intact.
The company continues to operate as one of the most strategically important businesses in the global semiconductor ecosystem, benefiting directly from AI, cloud infrastructure, and advanced chip manufacturing demand.
However, markets rarely move in straight lines.
With buy-side liquidity already swept, a hawkish Federal Reserve introducing valuation pressure, and management highlighting supply-side limitations, the risk-reward profile currently favors a retracement into lower inefficiencies before the next major expansion phase.
As long as price remains beneath current highs, a move toward the highlighted Fair Value Gap and lower liquidity zones remains a scenario worth monitoring.  Short
Short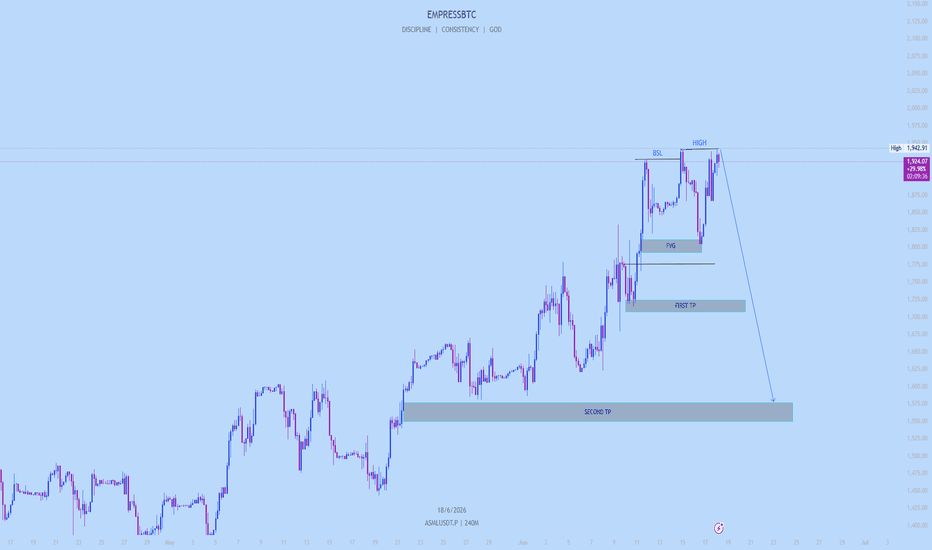
Long 
Long 
 Short
Short
Long 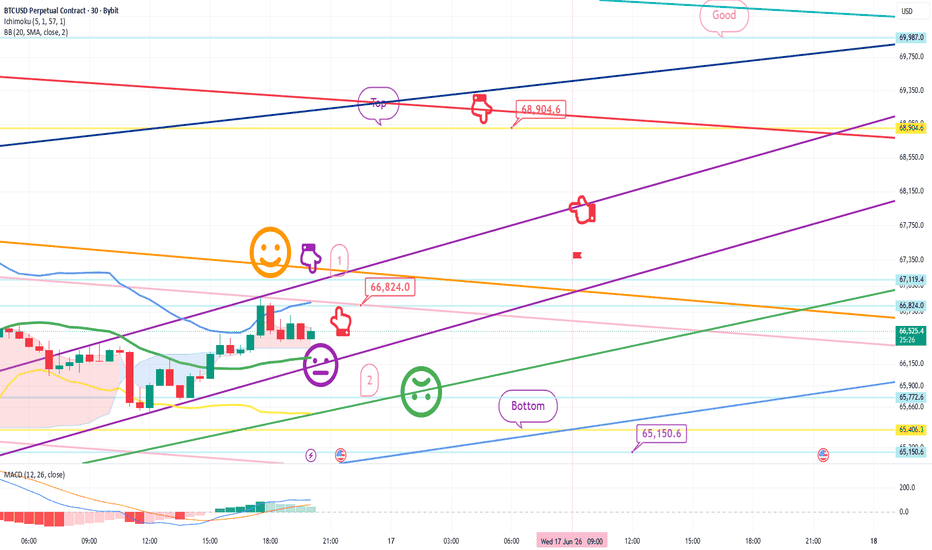
 Short
Short
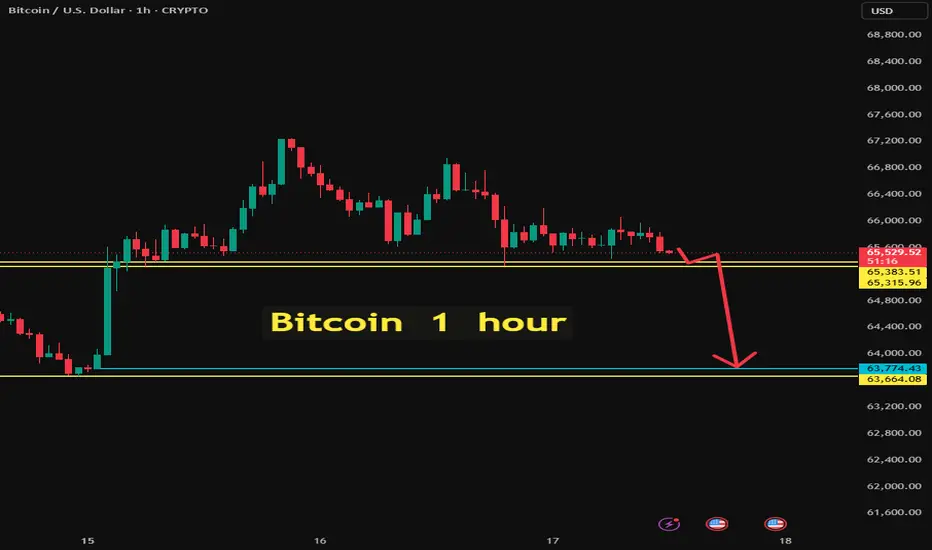
Bitcoin MAKING HEAD & SHOULDERS PATTERN FORMING LOWER LOWS 📉 BITCOIN 1H ANALYSIS
Bitcoin is currently holding above the key support zone at 65,383 - 65,315. As long as this level remains intact, a short-term bounce towards 66,800 is possible.
However, a breakdown below support could trigger a stronger bearish move towards the major demand zone around 63,774 - 63,664.
🎯 Key Resistance: 66,800
🛡️ Key Support: 65,383 - 65,315
📌 Major Support: 63,774 - 63,664
Trade with proper risk management and wait for confirmation before entering any position.
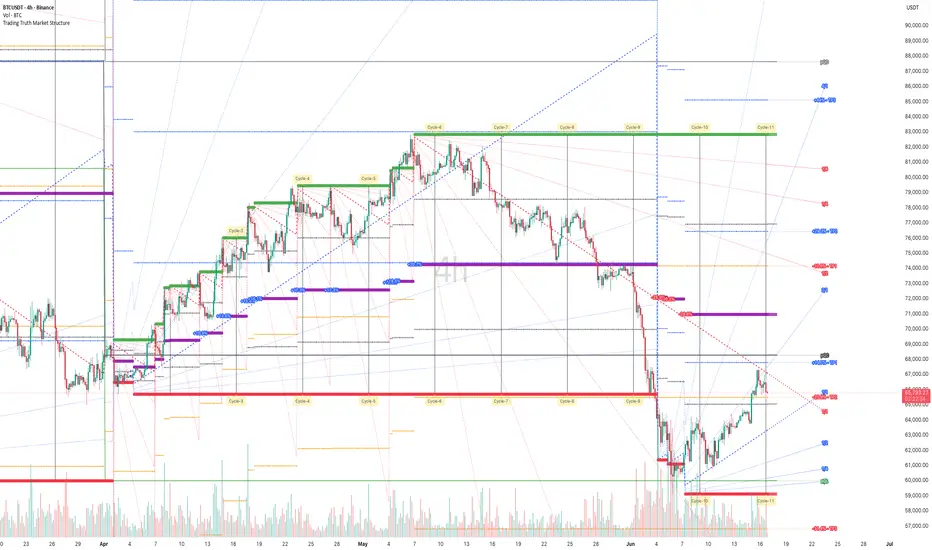
⚠️ This analysis is for educational purposes only and not financial advice. Bitcoin Analysis on 4h using Leading Indicator📊 BTCUSDT (4H Timeframe)
🔍 Analysis:
• Strong recovery from the Cycle-10 low after a capitulation selloff ✅
• Price is respecting the ascending 1x1 geometric angle support ✅
• Higher lows continue to form, showing improving market structure ✅
• BTC is currently testing a key confluence zone near the descending 1x1 resistance ⚠️
• Break above the descending geometric angle could trigger the next expansion leg 🚀
• HTF midpoint around 65,000 remains the critical battleground level 📐
• Time-cycle projection suggests increased volatility approaching the next cycle node ⏳
🎯 Bullish Targets:
✅ TP1: 68,500
✅ TP2: 71,000
✅ TP3: 73,500
✅ TP4: 78,000
📌 Support Zone:
64,000 – 65,000
🛑 Stop Loss:
Below 62,500
🚀 Trade Idea:
BUY on pullbacks into the 64,000–65,000 support region or on a confirmed breakout above the descending geometric resistance.
📈 Outlook:
As long as BTC remains above the 1x1 ascending angle and the 64,000 support zone, buyers maintain control. A breakout through the current geometric resistance could open the path toward 68,500 first, followed by 71,000 and potentially 73,500–78,000 as the next cycle expansion unfolds. Long 
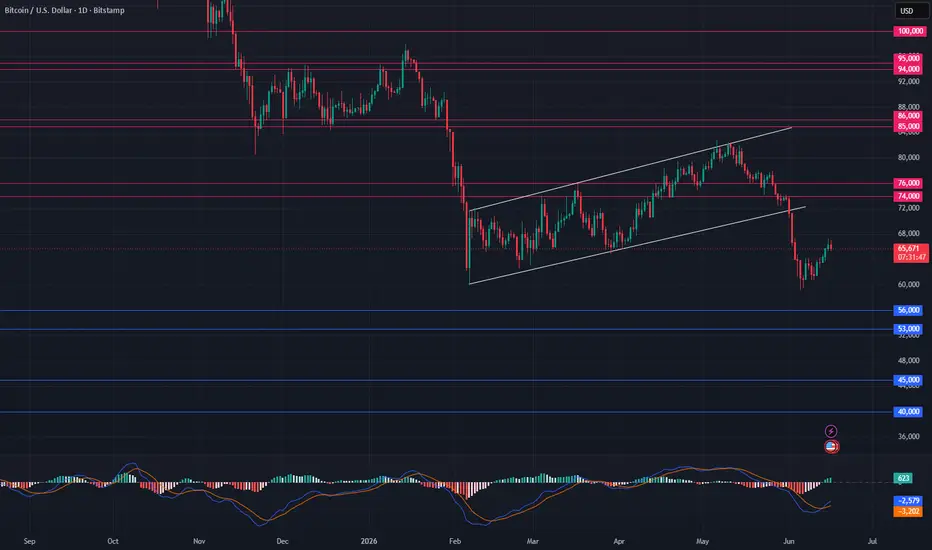
Bitcoin Breakdown: Bear Market Structure Remains IntactBitcoin continues to trade with a weak technical structure, and there is not much improvement to report in the crypto space this week.
The trend remains clearly bearish as BTC continues to print lower highs and lower lows. More importantly, Bitcoin has now taken out the March low, which adds further pressure to the current setup.
The recent breakdown from the ascending price channel is also a major warning sign. This type of breakdown often acts as a continuation pattern, and in this case, the continuation still points lower.
Another concern is that Bitcoin has mostly been consolidating its recent losses instead of showing a strong recovery. That keeps the risk of further downside open.
For the bearish setup to weaken, BTC would need to reclaim the $74,000–$76,000 zone. Until that happens, the broader structure remains vulnerable.
Trading Levels:
• Bearish below: $74,000–$76,000
• Key resistance: $74,000–$76,000
• First support zone: $53,000–$56,000
• Downside target: $40,000–$45,000
• Trend structure: Bearish while lower highs and lower lows continue
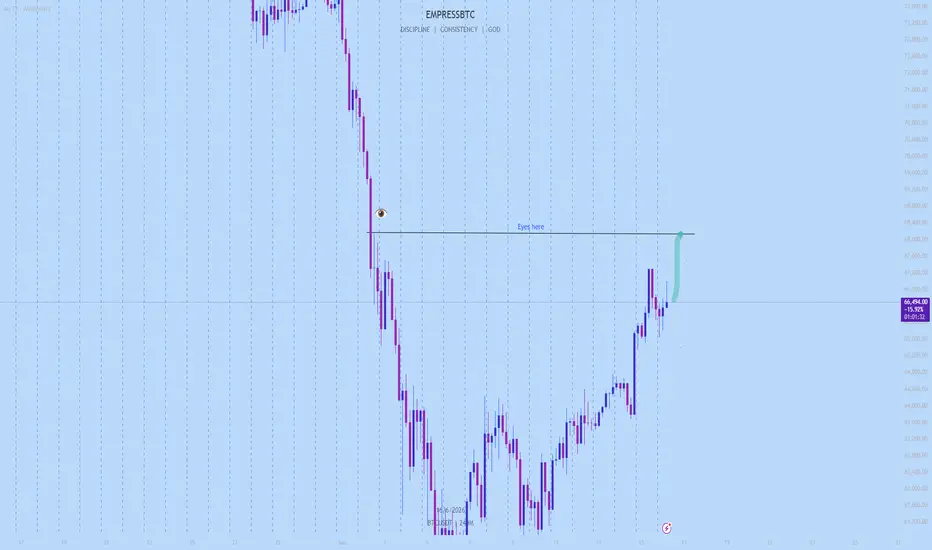
Overall, Bitcoin remains under pressure, and unless buyers can reclaim the $74,000–$76,000 area, the path of least resistance still appears to be lower. BTC 4K Technical Outlook-Eyes on $68K as Risk Sentiment ImprovesBitcoin has staged an impressive recovery following the recent de-escalation in geopolitical tensions and improving global risk sentiment. The peace agreement has reduced uncertainty across financial markets, encouraging capital rotation back into risk assets, with BTC leading the move higher and the Institutional Demand Remains Strong
Spot Bitcoin ETF inflows continue to provide structural demand.
Institutional participation remains one of the strongest bullish catalysts for BTC's medium-term outlook.
Technical Analysis
Market Structure
Following the aggressive selloff from the $73K region, Bitcoin established a significant bottom near the $60K-$61K demand zone before initiating a strong bullish recovery.
The current price action shows:
Higher highs and higher lows forming on the lower timeframe.
Strong bullish displacement from the recent swing low.
Buyers successfully defending pullbacks and maintaining upward momentum
Bullish Scenario
As long as BTC holds above the recent breakout structure around $65,000-$65,500, the path of least resistance remains higher.
Primary Target: $68,000
A successful break and close above $68K could open the door toward:
$70,000
$71,500
Retest of the $73,000 highs
Invalidation
Failure to hold above the current bullish structure could trigger a retracement toward:
$64,000
$63,000
$61,500 demand zone
However, current momentum continues to favor buyers. Long 
Bitcoin chart analysis JUNE 12Hello
It's a Bitcoin Guide.
My analysis is optimized for TradingView.
If you press the Replay button, you can check real-time movements.
This is the Bitcoin 30-minute chart.
In the bottom left, marked by the purple finger, I have connected the strategy exactly as it was at the entry point of the long position I entered yesterday, $62,625.3.
*When following the movement path of the light blue finger, it is a two-way neutral strategy involving switching from Short to Long to Short.
1) Switch to a short position at $64,475.8 / Stop loss if the orange resistance line is broken.
2) Switch to a long position at $63,379.8 / Stop loss if the green support line is broken.
3) Switch to a short position at the Top zone of $67,215.6 / 65.6K Long -> 68.7K Final Target Price.
I suggest you utilize the prices I have indicated over the weekend.
If the price falls immediately from the current position without touching the light blue finger mark of 64.4K at the top, I will wait for a final long position in Zone 1 at the bottom, and set a stop-loss price if the green support line is broken. I will operate all positions in the same manner.
Please be careful, as starting from a break below the green support line, the Bottom section (up to Zone 2) is open.
Please use my analysis post merely as a reference and for practical application. I hope you operate safely by strictly adhering to trading principles and stop-loss prices.
Thank you for your hard work this week.
Thank you.