Long
Long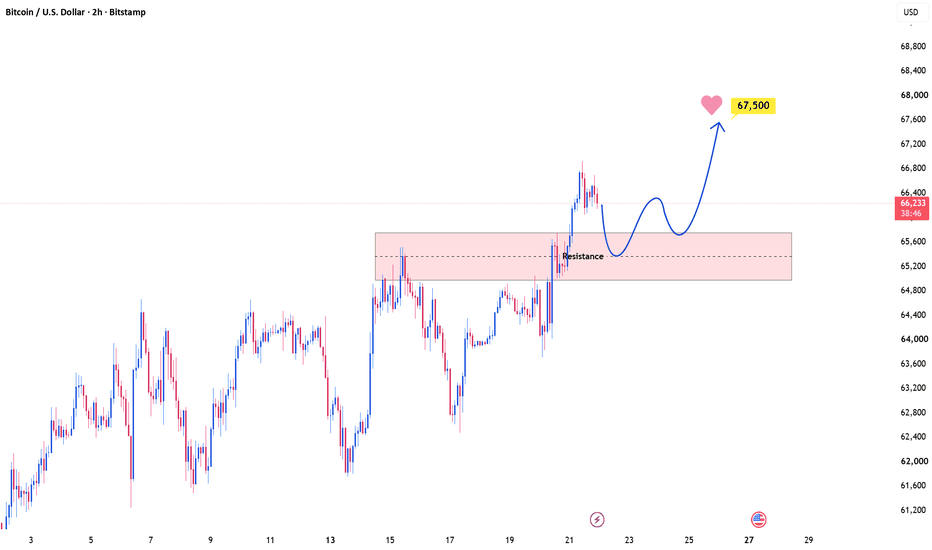
Short 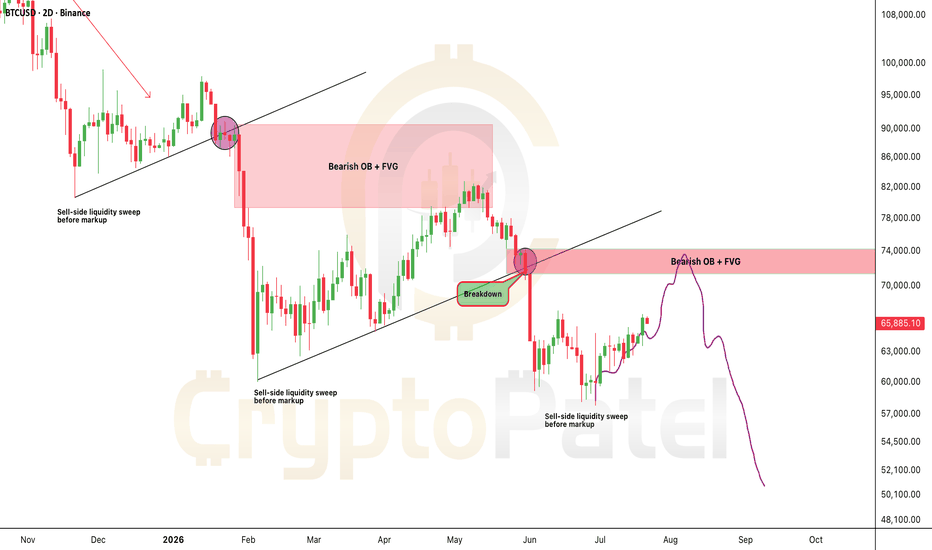
 Long
Long
 Long
Long

Ethereum $10K Or $1K? This Zone Will Decide Everything.Ethereum $10K Or $1K? This Zone Will Decide Everything.
My technical outlook on CRYPTOCAP:ETH :
Ethereum is likely to extend its recovery toward the $2,160–$2,400 region. This is a major HTF Bearish Order Block + Fair Value Gap (FVG), making it the most important resistance zone on the chart.
Bullish scenario:
A confirmed HTF close above $2,400 would invalidate the current bearish structure and shift the HTF trend bullish, opening the door toward $7K–$10K.
Bearish scenario:
If ETH gets rejected from the $2,150–$2,400 zone, the probability of revisiting the $1,500–$1,000 range increases significantly. That would be a high-conviction long-term accumulation opportunity.
This is the decision zone. Don't predict the outcome, wait for confirmation and react accordingly. Always DYOR.  Long
Long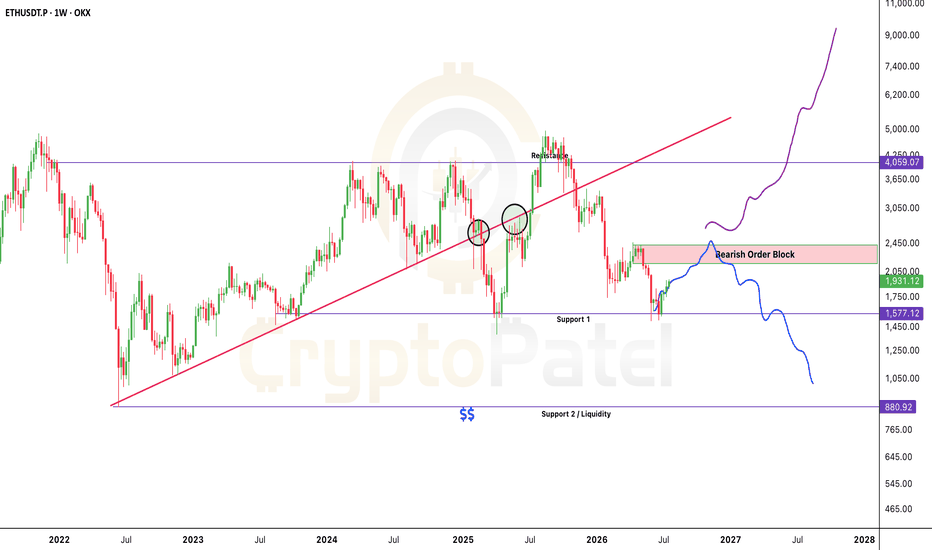
Long 
Long 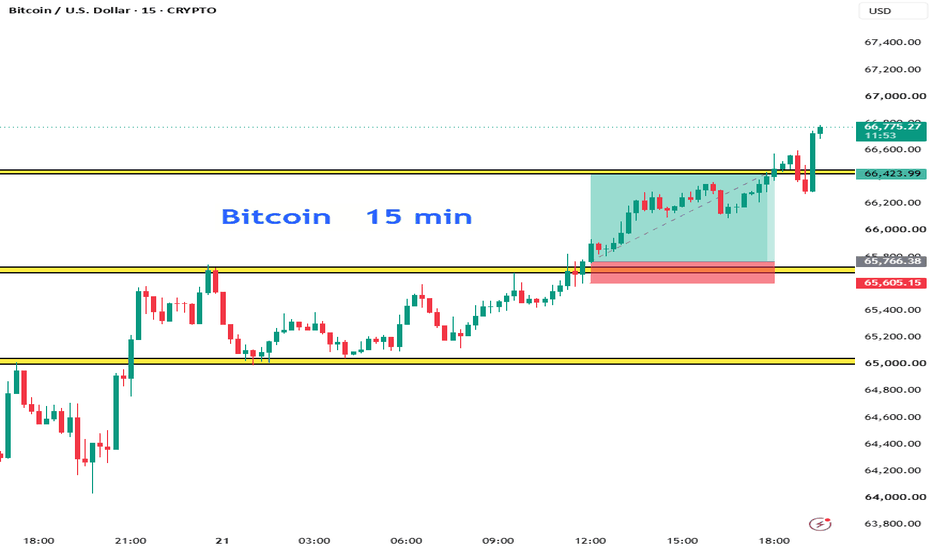
BTCUSDT Bullish Breakout ContinuesBTCUSDT has confirmed a strong Break of Structure (BOS) by pushing above the previous swing high, signaling continued bullish momentum. Price remains above the Ichimoku Cloud, keeping the overall market structure positive.
After the breakout, a short-term pullback into the 64,720–64,340 Fibonacci retracement zone is possible. This area aligns with the Ichimoku Cloud and could act as a strong demand zone for buyers. Holding this support would increase the probability of another bullish leg toward 66,800 and potentially 67,500.
A breakdown below 64,340 would weaken the bullish outlook and expose price to a deeper retracement toward 63,050. Until then, the trend remains in favor of buyers, with pullbacks likely offering continuation opportunities.  Long
Long
Short 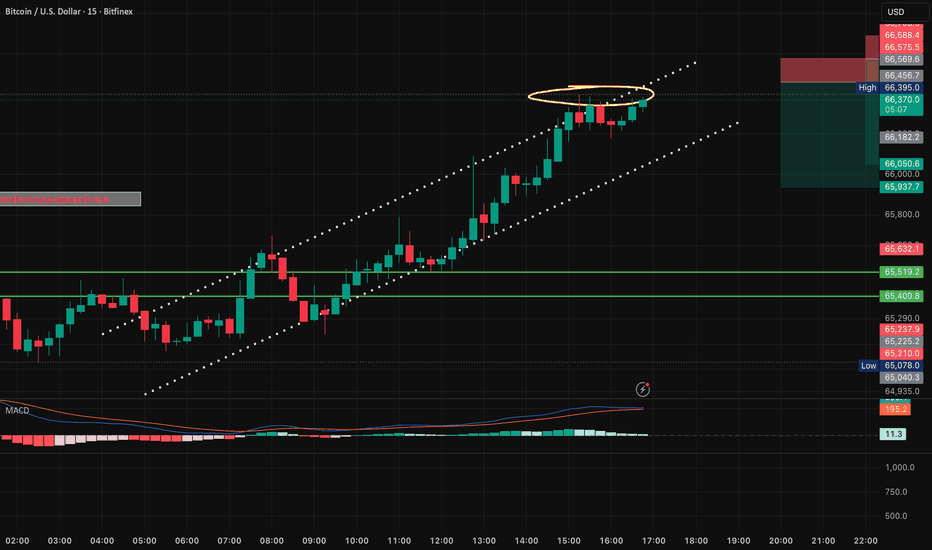
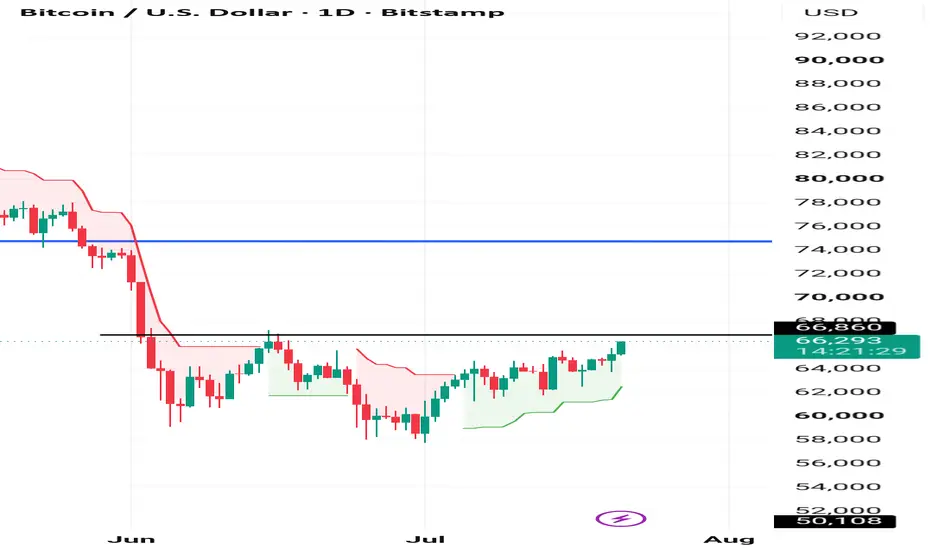
Bitcoin Trend change #bullish #reversal #long viewBitcoin (BTCUSD) – Daily Chart Analysis
📈 Current Price: 66,283
📊 Trend
Short-term trend is bullish.
Price is trading above the Supertrend, indicating buyers are in control.
BTC is making Higher Highs and Higher Lows, which is a positive sign.
🔑 Key Levels
🟢 Support
64,000–65,000 – Immediate support
61,000–62,000 – Strong support
50,100 – Major long-term support
🔴 Resistance
66,860 – Immediate resistance (currently testing)
74,000 – Major breakout level
107,631 – Long-term resistance
📈 Bullish Scenario
A daily close above 66,860 could push BTC toward 70,000–74,000.
A breakout above 74,000 may start the next major bullish leg.
📉 Bearish Scenario
If BTC fails to hold above 64,000, it could decline toward 61,000–62,000.
A break below that zone may increase selling pressure.
🎯 Trading View
Buy Zone: 64,000–65,000 (after bullish confirmation)
Breakout Buy: Above 66,860 with strong volume
Stop Loss: Below 64,000 (for short-term trades)
Overall View:
Bitcoin is approaching a key resistance at 66,860. A confirmed breakout above this level could strengthen bullish momentum, while rejection may lead to a short-term pullback before the next move. Long 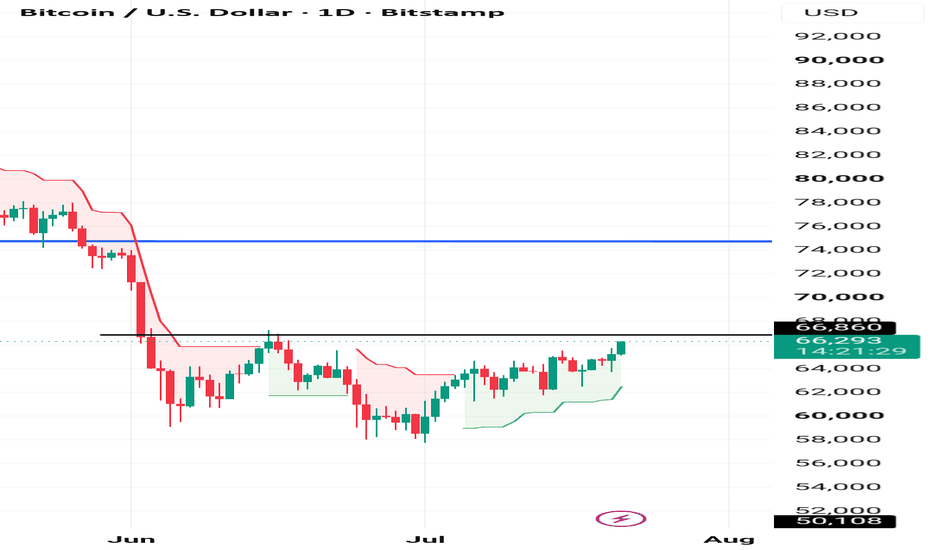
Short 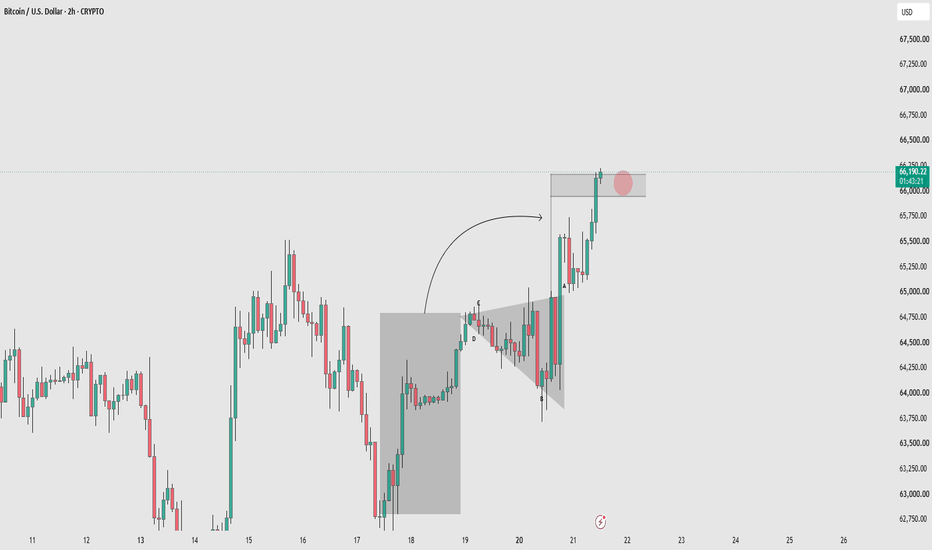
BTCUSD back at resistance: Watching for another rejectionHey everyone, I just wanted to share what I’m seeing on the BTCUSD chart.
BTCUSD has climbed back into the key resistance zone around 66,000–67,000, an area where sellers stepped in before and pushed price lower. Now that price is testing the same zone again, I’m watching the reaction closely.
I’m not looking to short it blindly. I want to see clear bearish confirmation first. If resistance holds and sellers begin to reject price, I’ll be looking for a pullback toward 63,800.
But if BTCUSD breaks through this zone cleanly and holds above it, I’ll step back and reassess, because that would suggest buyers are still in control.
💡 Patience is key. I’ll wait for price to confirm the idea before reacting. This is only my market view, not financial advice. Short 
Trading Decoded | #1: The Butterfly Effect What if your biggest trading loss didn't begin with a bad setup—but with one tiny decision you barely noticed?
The **Butterfly Effect**, a concept from chaos theory, explains how a small event can eventually create a much larger outcome. While it's often used to describe complex systems like weather, the same principle applies surprisingly well to trading.
A single impulsive trade, a slightly larger position size, moving a stop-loss "just this once," or chasing a missed opportunity may seem insignificant in the moment. But these small actions can trigger a chain reaction—affecting your confidence, decision-making, discipline, and ultimately your long-term performance.
Successful traders rarely succeed because they make one extraordinary decision. They succeed because they consistently make hundreds of small, disciplined decisions that compound over time. Likewise, many trading accounts aren't destroyed by one catastrophic mistake—they gradually drift off course because of repeated "small exceptions" to the trading plan.
In this first edition of **Trading Decoded**, we'll explore how tiny choices influence your trading journey, why consistency matters more than perfection, and how understanding the Butterfly Effect can help you build stronger habits and avoid costly psychological traps.
Sometimes, the smallest decision you make today becomes the reason for your biggest success—or your biggest regret—months from now. Education 
Short 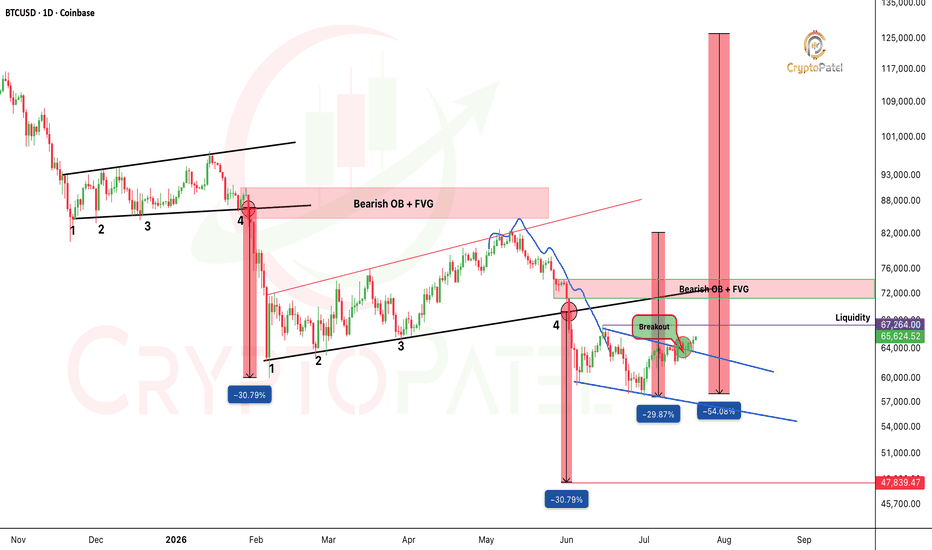
Short 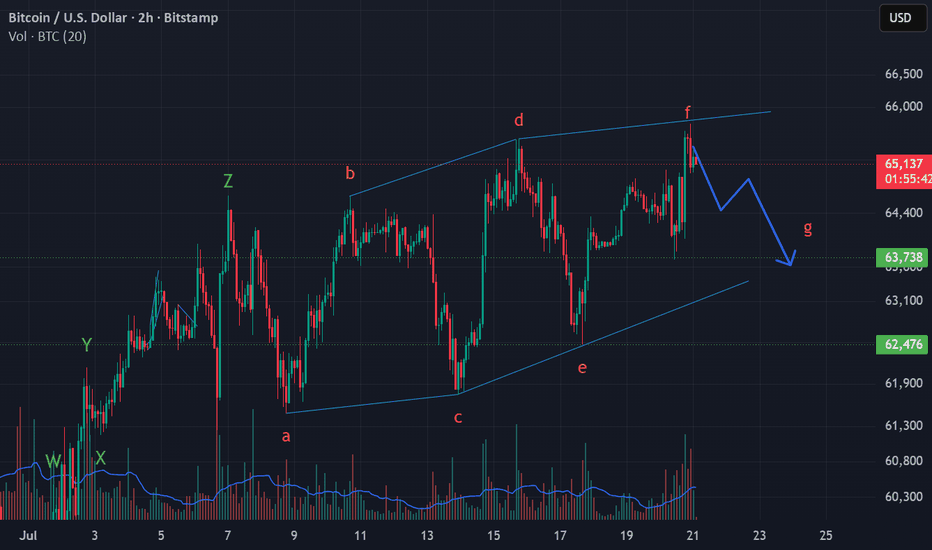
Long 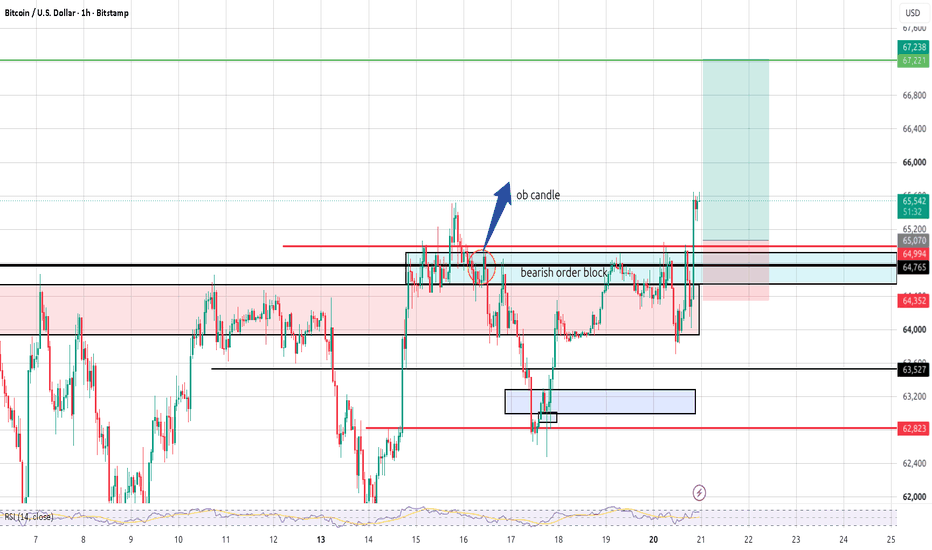
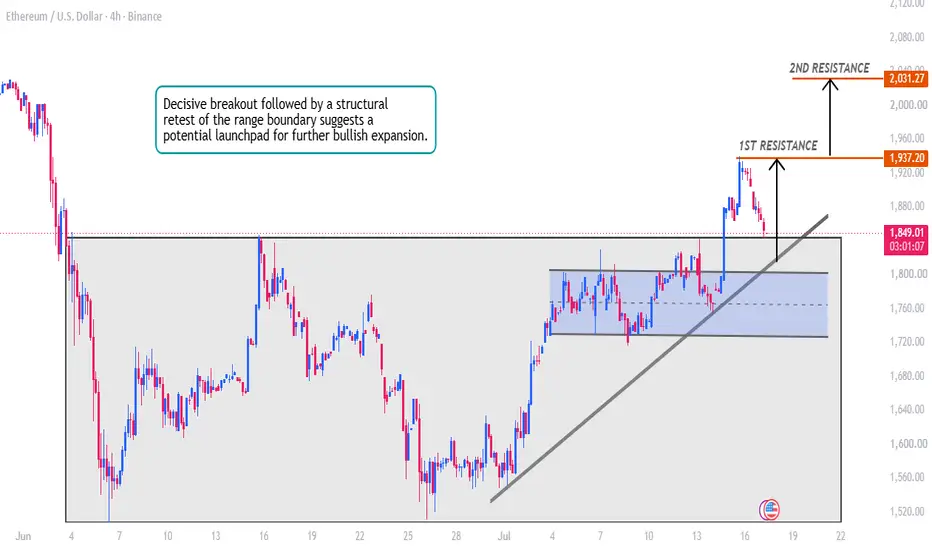
ETHUSD: Bullish Breakout & Structural Retest FormationETHUSD: Bullish Breakout & Structural Retest Formation 🚀
Description:
Ethereum (ETHUSD) has demonstrated a significant bullish breakout on the 4h timeframe, successfully clearing the upper boundary of its prolonged consolidation range. This impulsive move signals a clear shift in market sentiment from indecision to institutional accumulation. Price is currently establishing a technical retest of the broken range resistance, which is now acting as a new dynamic floor. We are monitoring this zone for bullish structural confirmation, anticipating that buyers will look to defend this level to push toward the identified overhead liquidity objectives.
Key Structural Levels:
🔴 Major Support / Invalidation Zone: 1,760 – 1,790 (Invalidation if price re-enters the consolidation range)
📈 Current Reaction Level: 1,849
🔵 1st Bullish Objective: 1,937 (1ST RESISTANCE)
🔵 2nd Bullish Objective: 2,031 (2ND RESISTANCE)
Trading Perspective:
We are looking for bullish order flow resumption on lower timeframes within this retest zone. Traders should watch for a clean bounce off the trendline support to confirm the trend's continuation. A breakdown back into the consolidation range would force us to re-evaluate the bullish bias, as it would indicate a potential fake-out.
This analysis is based on technical structure and market behavior, not financial advice. Long 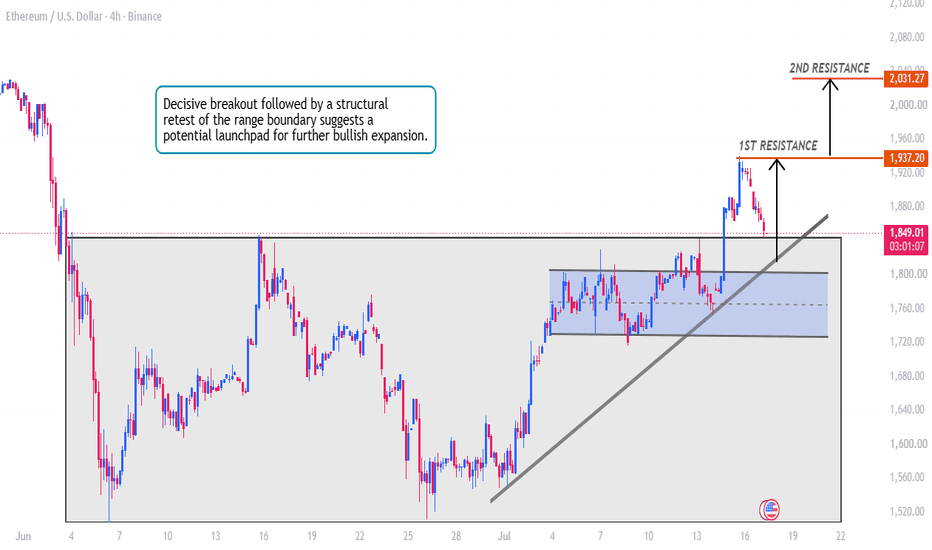
 Long
Long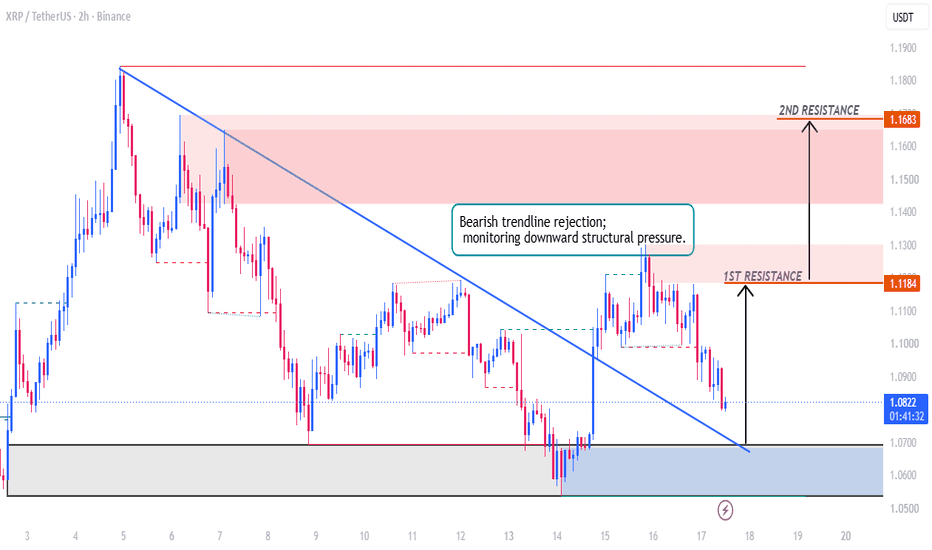
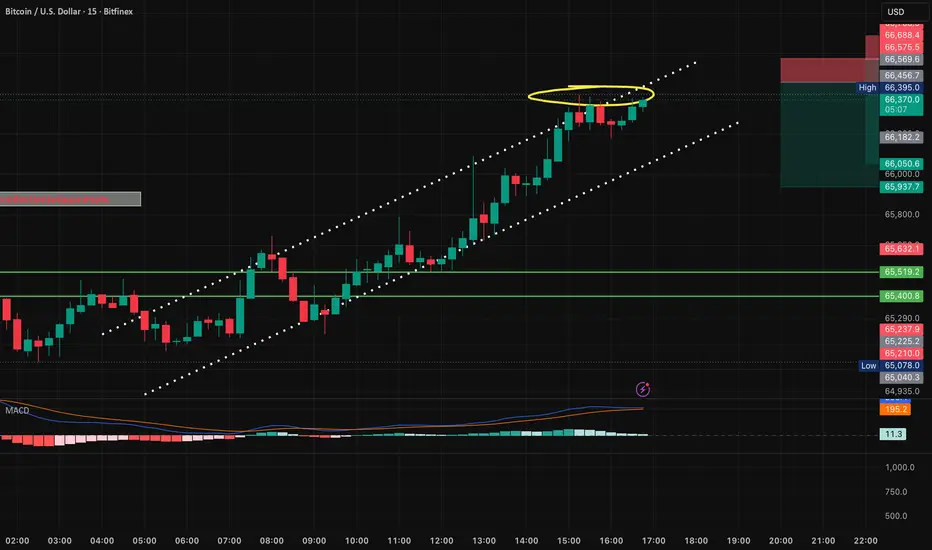
BTCUSD Rejection at Major Resistance? Short Setup Around 65000BTCUSD Analysis: Watching the 65,000–65,100 Resistance Zone
BTCUSD is approaching a key resistance area between 65,000 and 65,100, where sellers could step in and trigger a bearish rejection.
Trade Idea
Entry Zone: 65,000 – 65,100
Bias: Bearish
Stop Loss: 65,710
Target 1: 64,000
Target 2: Below 64,000 (depending on momentum)
Why this setup?
Price is testing a significant resistance zone.
A rejection here could attract fresh selling pressure.
Risk-to-reward becomes attractive if the resistance holds.
Trade Management
Wait for bearish confirmation (such as a rejection candle, bearish engulfing pattern, or lower-timeframe market structure break) before entering. If BTC closes decisively above 65,710, the bearish setup becomes invalid.
Disclaimer: This is a technical analysis idea based on price action and key resistance levels. Always manage your risk and wait for confirmation before entering any trade.
Do you expect BTC to reject this resistance or break through it? Share your view below.
📌 Disclaimer:
This analysis is for educational purposes only and is not financial advice. Always manage risk and follow your trading plan.
Your feedback drives our content and keeps everyone trading smarter. Let’s make those pips together! 🚀
Happy Trading,
– The InvestPro Team Short 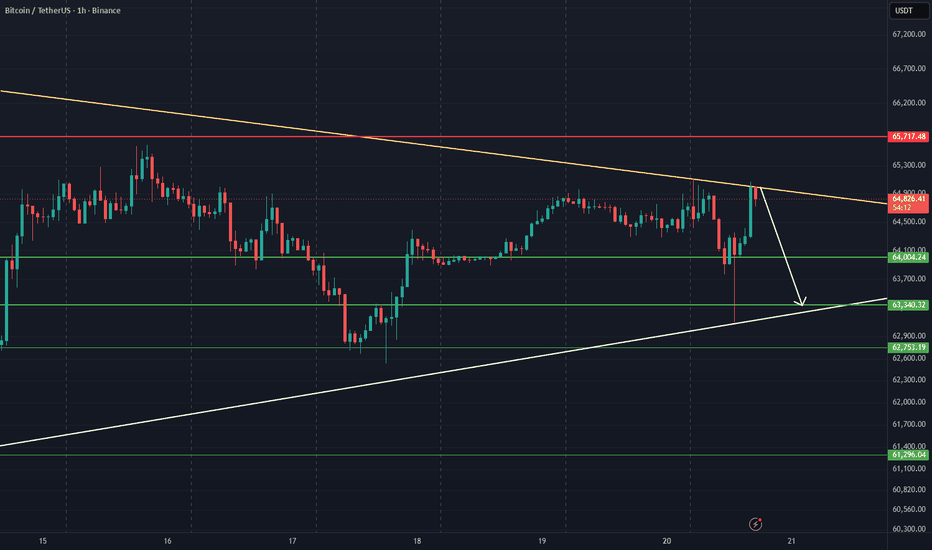
The 30-Second RuleImagine you've found what looks like the perfect setup. The trend is clear, the candles look strong, and your finger is already hovering over the buy or sell button.
Now pause.
Not for five minutes. Not for an hour.
Just **30 seconds**.
Those 30 seconds won't change the market, but they might completely change your decision. In trading, the biggest mistakes are often made in moments of urgency. A short pause creates space between emotion and execution, giving logic one final chance to speak.
1. Stop Reacting, Start Deciding
The market moves fast, but your decisions don't have to. Many losing trades begin with an emotional reaction rather than a planned decision.
A brief pause helps you shift from "I need to enter now" to "Does this trade actually deserve my capital?"
2. Ask One Simple Question
During those 30 seconds, ask yourself: "Would I still take this trade if there were no fear of missing out?"
Your first answer is often emotional. The honest answer usually arrives a few seconds later.
3. Check the Trade, Not the Excitement
Strong candles and sudden momentum can create excitement, but excitement isn't confirmation.
Use those few seconds to review your setup instead of your emotions. Is your reason for entering based on your strategy, or on the speed of the market?
4. Respect Your Risk Before Your Reward
Before thinking about how much you could make, think about what you're willing to lose.
Confirm your stop-loss, position size, and risk-to-reward ratio. If any of them feel uncertain, that's already valuable information.
5. Silence Outside Opinions
Right before entering a trade, don't look for one more tweet, one more indicator, or one more person's opinion.
Your trading plan should make the decision—not the internet.
6. Accept That Missing a Trade Is Okay
Sometimes those 30 seconds will cause you to miss a move. That's perfectly fine.
Missing one opportunity is far less damaging than entering a trade you never truly believed in.
7. Build a Habit, Not a Rule
The goal isn't to literally count to thirty before every trade. The goal is to create a consistent pause between seeing a setup and risking your money.
That small habit can become one of the simplest ways to reduce impulsive decisions.
Conclusion:
Successful trading isn't always about finding better setups. Sometimes it's about creating better habits before acting on them.
The market will still be there after 30 seconds. The real question is whether your decision will be better because you waited.
Remember: A rushed trade can cost you money. A thoughtful pause costs you nothing. Education 
Long