Bitcoin chart analysis May 27Hello
It's a Bitcoin Guide.
My analysis is optimized for TradingView.
If you press the Replay button, you can check real-time movements.
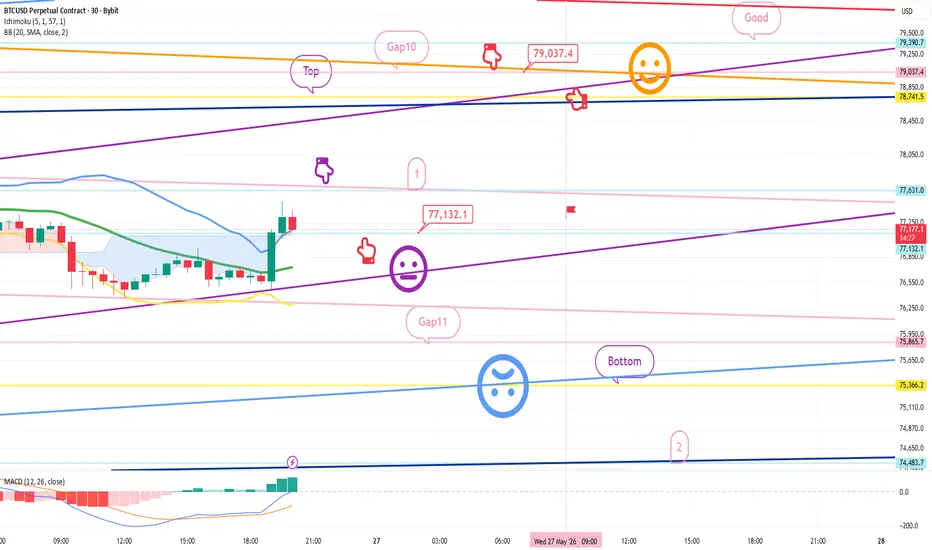
This is the Bitcoin 30-minute chart.
On the left, indicated by the purple finger, I have connected the strategy exactly to the entry point of the long position I entered yesterday, 75.8K (Gap 11).
Currently, a MACD Dead Cross is in progress on the 12-hour chart.
*The red finger long position strategy before and after the touch of the blue finger at the top:
1) After confirming the touch of the blue finger's 1 zone,
the red finger's long position entry point at $75,672.9 at the bottom / Stop loss if the green support line is broken.
2) $76,801.6 long position 1st target -> Top zone 2nd target price.
Although unlikely, please note that if the price rises to 76.8K in one go from the current position,
it may not come back down to the long position entry point.
3) If the price drops immediately without touching Zone 1 at the top:
Zone 2 at the bottom (75.3K) is the entry point for a long position / Stop loss if the green support line is broken.
For those maintaining a long position at 75.8K (indicated by the purple finger),
I suggest you try operating with the same stop loss setting.
From the point where the green support line is broken, the price is open up to the Bottom -> Zone 3 at the bottom, so please exercise caution.
Please use my analysis post merely as a reference and for practical application.
I hope you operate safely by strictly adhering to trading principles and using stop loss settings as a necessity.
Thank you.  Long
Long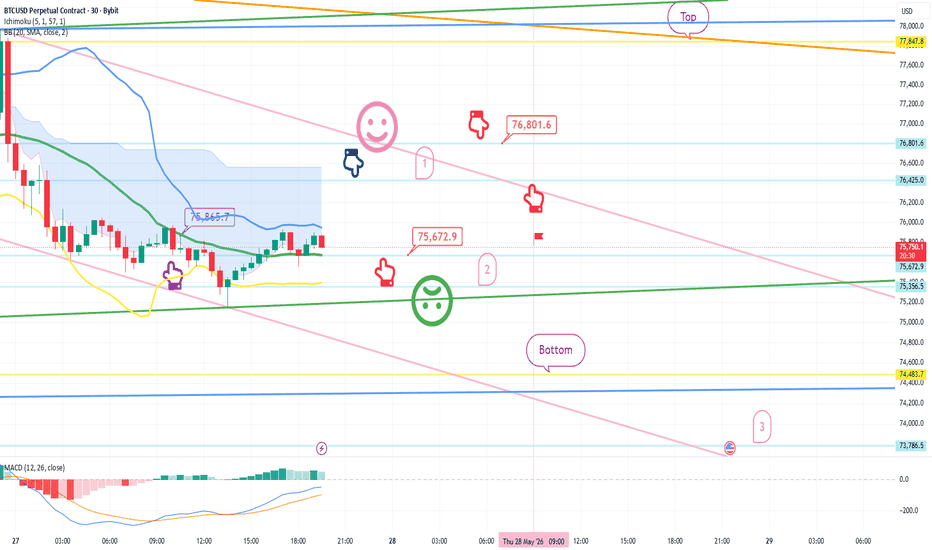
 Long
Long
Short 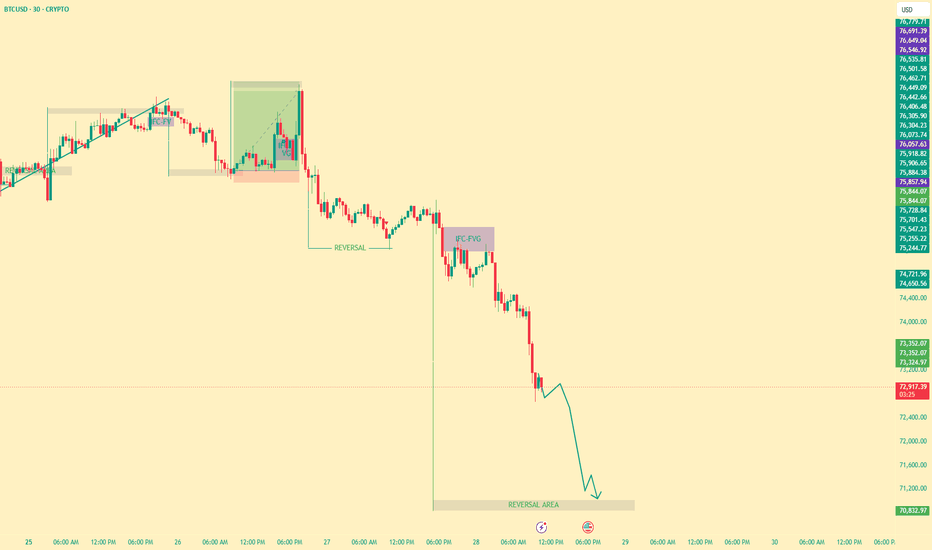
BTCUSDT: Systematic Waves & Momentum DivergenceThis analysis demonstrates a technical case study on the BTCUSDT 1-hour chart near the $78,080 liquidity zone. This layout highlights a structural transition from retail buying exhaustion to downward institutional distribution.
Core Filters
Geometry: Utilizes swing points (HH, LH, HL, LL) to map clean market boundaries.
Elliott Reversal: Tracks the relationship between a Wave (5) completion and a Wave (1) reset failure.
Momentum: Integrates an RSI divergence model to catch slowing buying volume at structural peaks.
15-Bar Window: Uses a mandatory 15-bar verification window to ensure structural candles close fully.
Timing: Optimized for volume expansion during the high-liquidity London and New York Kill Zones.
Multi-Market: Functions universally across Crypto, Forex, Stocks, and Nifty (5-Minute chart).
Analysis
The Peak: During New York hours, Bitcoin established an exact structural high of $78,080
(HH (1) peak).
The Divergence: The RSI registered a clear Lower High. This divergence provided confirmation at the $77,000 level immediately after the trapping candle closed, exactly as per the New York Kill Zone. This framework works systematically during both London and New York Kill Zones across all assets.
The Lock-in: The 15-bar validation window completed its cycle, confirming that sellers defended the resistance zone.
The Move: Following this alignment, the market reacted downward from the peak to the current level of $74,904.
Risk Management (SL & TP)
Dynamic Stop Loss: Calculates volatility over a 14-period window. It projects an invalidation line exactly 2.5 × ATR above the trapping candle high to protect against normal retail noise.
Dynamic Take Profit: Targets a fixed distribution zone projected at 7.5 × ATR below the entry candle close.
1:3 Risk-to-Reward: Because the target (7.5\times{ATR}\)) is exactly triple the risk (2.5\times\{ATR}), the framework enforces a mathematically locked 1:3 Risk-to-Reward Ratio to match active market volatility.
Parameters
Validation Level (Post-Trap): $77,000
Current Price: $74,904
Invalidation Level (2.5× ATR SL): $78,100
Target Zone (7.5× ATR TP): $74,000
Disclaimer
This post is shared strictly for educational and informational purposes to demonstrate market geometry. It does not constitute financial, investment, or trading advice. Trading digital assets involves high risk. Always manage your risk strictly. Short 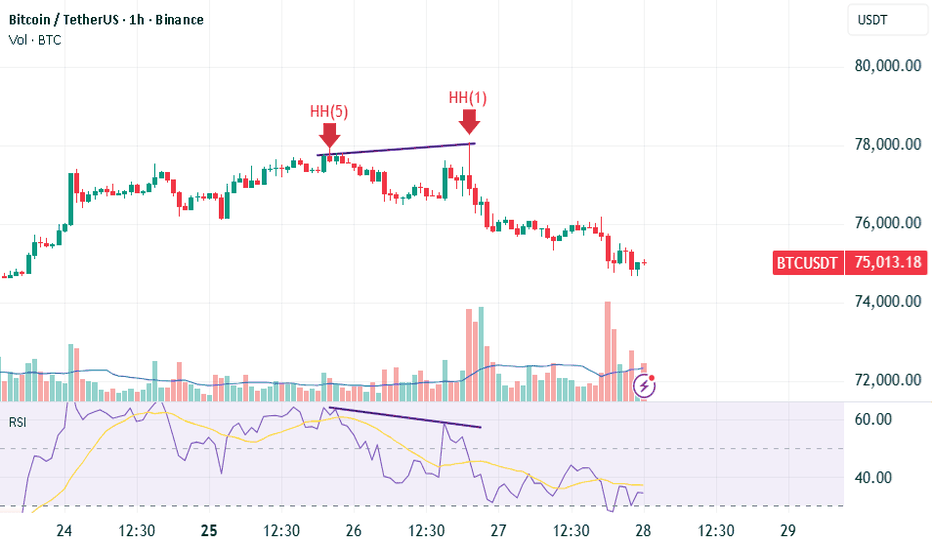
Long 
Trading Nifty AnalysisWhere is Nifty right now?
Nifty closed at 23,689 on Thursday May 14. After a brutal fall earlier this week (it touched ~23,300), it bounced back for 2 days in a row. So right now it's in a recovery mood — but it hasn't really "fixed" itself yet. Think of it like someone who had a fever, now feeling slightly better, but not fully healthy.
2 What's the wall above? (Resistance)
If Nifty tries to go up next week, it will hit a wall around 23,500–23,600 first. That's the first test. If it somehow crosses that, the BIGGER wall is at 23,900–24,000 — where all the major moving averages (50-day & 200-day) are sitting. Lots of sellers will be waiting there to book profits. So going above 24,000 next week? Unlikely unless something very positive happens.
3 What's the floor below? (Support)
If Nifty starts falling, the first safety net is around 23,300–23,150. This zone has held multiple times recently. If it breaks this level decisively (and stays below it), then the next stop could be 23,000 or even 22,900. That's the danger zone — but that's not the most likely scenario for next week.

Long 
 Short
Short
Long 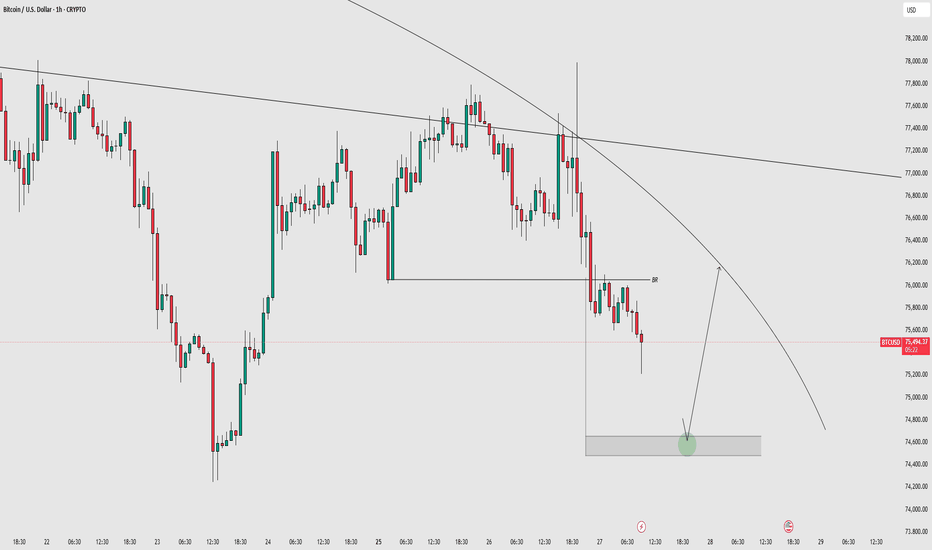
Short 
X Ended the InfoFi Era. $KAITO Lost 64% and Still Im BearishX Ended the InfoFi Era. CRYPTOCAP:KAITO Lost 64% and Still Has No Reason to Be Bullish
#Kaito has been bleeding inside a falling channel since its listing top of $2.90 back in March 2025. The structure is clean and the bias is clear.
Here Is What Played Out:
Price lost the $0.70 support in November 2025. Came back for retest in January 2026 and got rejected hard. What followed was a brutal 64% dump in just 12 days, dragging price all the way down to $0.27.
But The Real Story is Not Just Technical:
In January 2026, X dropped a bomb on the InfoFi sector. They announced a ban on apps that reward users for posting, called out the AI spam problem, and revoked API access for affected platforms. Kaito's Yaps reward system was the biggest casualty and was forced to shut down.
Nikita Bier, X Product Head, made it official:
"We will no longer allow apps that reward users for posting on X."
That one statement killed the entire InfoFi narrative.
Now price is sitting at $0.5144, trying to recover inside a contracting wedge. The bounce looks decent on the surface but volume is weak and there is no real sign of smart money stepping in yet.
Levels I am watching:
Resistance: $0.70 (needs a high timeframe close above this with volume to shift bias)
Support: $0.45 then $0.27
Danger zone: Below $0.20
Honestly, this bounce feels corrective to me, not a real reversal. Until KAITO/USDT reclaims $0.70 with proper volume, I am not buying the recovery story. And if $0.45 gives up, do not be surprised if we see a flush below $0.20.
The narrative is broken. The chart is bearish. Patience over FOMO here.
TA Only. Not Financial Advice. ALWAYS DYOR.  Short
Short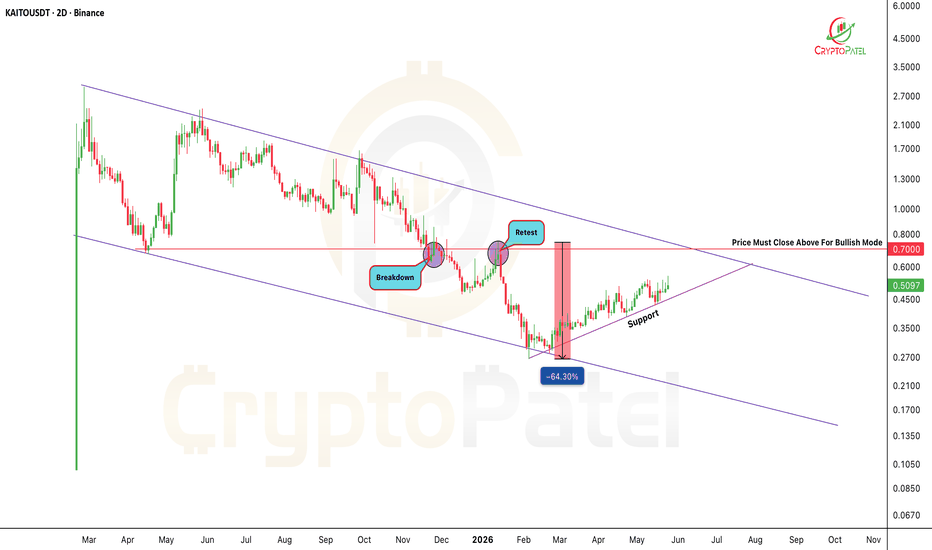
BTC chart is showing a possible bullish market structurea possible bullish market structure recovery after a strong correction. Your chart looks like an Elliott-style impulsive move forming from the recent low.
BTC already made a major correction from ATH zone,Strong reaction from the high liquidity zone near 50k,Weekly candles now showing recovery strength, Price is trying to reclaim trend momentum above EMA.
Support Zones
75k – 76k
Current support
Weekly holding zone
If BTC stays above this, bulls remain active,68k – 70k Wave (1) region Strong short-term demand.49.5kMajor high liquidity zone Long-term support Smart money accumulation area,,,
Resistance Zones
90k – 93k UN-MEG supply zone First major obstacle Profit-taking area likely,108k – 114kHigher supply zone ,Heavy institutional selling area possible,
That projection becomes valid if:
BTC holds above 70k
Volume increases during breakout
Weekly closes reclaim 80k–82k strongly,,,,
Smart money defending Bitcoin above 75k? Massive move loading.
if BTC loses:
75k weekly support
Then:
70k becomes likely
Below 70k may reopen 60k–50k liquidity sweep..
TradeWithDisciple is focused on real trading education, market psychology, and live analysis.
No paid promotions. No referral links. No fake promises.
This channel is built only with subscriber support and community trust. Long 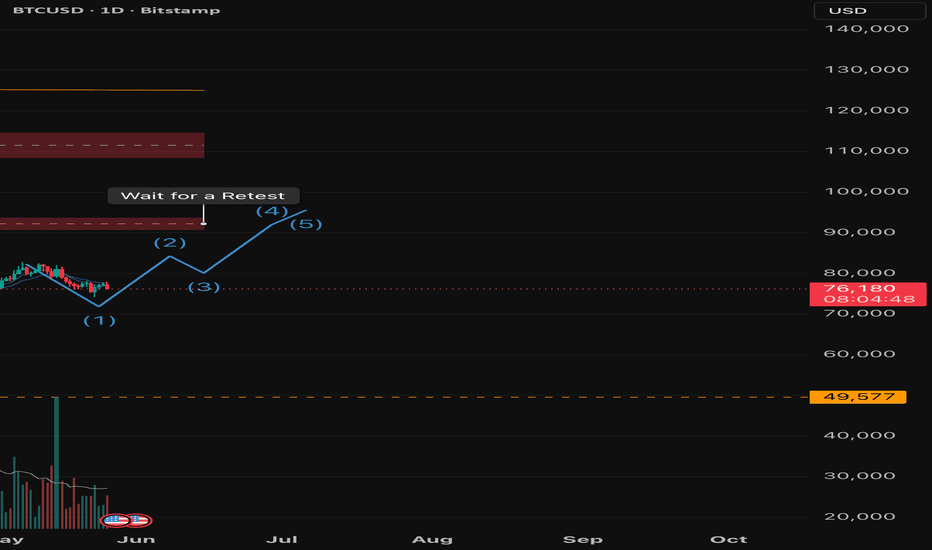
Trading Psychology: Every Market Emotion
Trading is not only a battle against the market. It is also a battle against emotions. Every trader experiences emotional highs and lows while navigating market movements. From optimism during rising prices to panic during crashes, emotions directly influence trading decisions.
Most losses happen not because traders lack knowledge, but because they fail to control emotional reactions. Understanding each emotional phase helps traders remain disciplined, avoid impulsive decisions, and develop long-term consistency.
The trading cycle repeats itself in every market, including stocks, forex, crypto, and commodities. Recognizing where you are emotionally can often be more valuable than predicting where the market will go next.
🟢 Bull Market Phase:
A bull market is where confidence and positive emotions dominate. Prices rise steadily, traders feel rewarded, and market participation increases rapidly.
However, this phase also creates emotional traps that can eventually lead to poor decisions.
Optimism:
Optimism is usually the starting point of a market move. Traders begin seeing opportunities and believe the market may continue higher.
At this stage, decisions are mostly logical and controlled.
⚡ “This market looks strong.”
⚡ “A good opportunity is forming.”
⚡ “Maybe this is the start of a big trend.”
Optimism is healthy because it encourages participation. But emotional attachment starts growing from here.
Impatience:
As prices continue rising, traders become impatient for faster results. Instead of waiting for quality setups, they begin forcing trades.
The fear of missing out starts influencing decisions.
⚡ Entering trades too early
⚡ Ignoring confirmation signals
⚡ Taking unnecessary risks
Impatience often causes traders to abandon discipline in search of quick profits.
Excitement:
Excitement grows when trades move into profit. Confidence increases quickly, and traders start imagining larger gains.
This phase feels rewarding because the market appears easy.
⚡ “Everything I buy is working.”
⚡ “I finally understand the market.”
⚡ “This trend looks unstoppable.”
Unfortunately, excitement can reduce caution and increase emotional dependency on profits.
Overconfidence:
Overconfidence is one of the most dangerous emotional stages in trading.
After repeated wins, traders start believing they cannot fail. Risk management becomes weaker, and emotional decisions replace strategic thinking.
⚡ Increasing position sizes aggressively
⚡ Ignoring stop losses
⚡ Taking trades without analysis
⚡ Believing the market will always recover
Professional traders often recognize this stage as the point of maximum risk.
The market usually punishes overconfidence when traders least expect it.
🔴 Bear Market Phase:
A bear market begins when momentum weakens, and prices start falling. Confidence slowly disappears, and negative emotions take control.
This is where emotional discipline becomes extremely important.
Denial:
When the market first turns against traders, many refuse to accept reality.
Instead of exiting losing positions, they convince themselves that the decline is temporary.
⚡ “It’s only a small pullback.”
⚡ “The market will bounce back soon.”
⚡ “I should hold a little longer.”
Denial prevents traders from accepting manageable losses early.
Regret:
As losses increase, regret starts replacing confidence.
Traders think about mistakes they made, profits they failed to book, or warnings they ignored.
⚡ Regretting late exits
⚡ Regretting oversized positions
⚡ Regretting emotional decisions
Regret creates mental stress and weakens future decision-making.
Fear:
Fear appears when losses become emotionally uncomfortable.
At this stage, traders stop thinking clearly and focus only on avoiding more pain.
⚡ Fear of losing more money
⚡ Fear of being wrong
⚡ Fear of holding positions overnight
Fear often causes traders to exit trades emotionally rather than strategically.
Panic:
Panic is the emotional breaking point.
Traders suddenly close positions, abandon plans, and react emotionally to market volatility. Decisions become impulsive and irrational.
⚡ Selling at the worst possible moment
⚡ Revenge trading
⚡ Emotional overtrading
⚡ Complete loss of discipline
This phase destroys many trading accounts because decisions are driven entirely by emotion.
Despair:
Despair happens after major losses or repeated failures.
Confidence disappears completely, and traders begin doubting themselves.
⚡ “Maybe trading is not for me.”
⚡ “I lost everything I built.”
⚡ “I don’t know what to do anymore.”
This stage feels emotionally draining because losses affect both finances and self-belief.
Yet many successful traders grow the most during this phase because pain forces self-reflection.
Hope:
After the emotional collapse, hope slowly returns.
Traders begin learning from mistakes and searching for better discipline.
Instead of chasing profits emotionally, they start respecting process and risk management.
⚡ Studying mistakes carefully
⚡ Reducing emotional trading
⚡ Building patience
⚡ Focusing on consistency
Hope becomes powerful when combined with experience and discipline.
Relief:
Relief comes when traders recover emotionally or financially after difficult periods.
This phase brings emotional stability and maturity.
Instead of seeking excitement, experienced traders focus on protecting capital and maintaining consistency.
⚡ Respecting risk management
⚡ Accepting losses calmly
⚡ Following trading plans strictly
⚡ Thinking long term instead of emotionally
Relief represents growth because traders finally understand that survival matters more than short-term wins.
📌 The Biggest Lesson in Trading:
The emotional cycle never truly disappears. Even experienced traders feel fear, greed, hope, and regret. The difference is that successful traders learn how to manage these emotions instead of reacting to them.
Strong trading psychology is built through:
⚡ Discipline
⚡ Patience
⚡ Risk management
⚡ Emotional awareness
⚡ Consistency
Markets will always move unpredictably. But emotional control allows traders to survive long enough to succeed.
💎 My Conclusion:
Every trader moves through emotional cycles repeatedly. Some get trapped by emotions, while others learn from them.
⚡ Optimism creates opportunity
⚡ Overconfidence creates danger
⚡ Fear creates hesitation
⚡ Despair creates reflection
⚡ Relief creates wisdom
In the end, trading success is not about controlling the market. It is about controlling yourself.
By @BrightRally_Research Education 
BTCUSD Retesting Zone & W Structure Analysis
The market structure is currently moving in an overall bullish trend, so I am following the “Trend Is Your Friend” concept while analyzing this setup.
First, the market successfully broke the previous high and then delivered a very strong bullish impulse move. However, in my view, the move looked slightly aggressive and potentially fake because the price pushed upward with a single strong candle.
After that move, the market created a clean W-Type Structure around the reversal area, which clearly shows buying pressure building inside the market. Because of this, I marked a small retesting zone where I am expecting the next important reaction.
What I’m Watching Now 👀
If the market comes back into the marked retesting zone and forms any bullish confirmation candle such as:
* Bullish Engulfing
* Strong Rejection Candle
* Any Positive Confirmation Pattern
then the market could continue moving toward the upside. 📈
At the same time, I have also marked a Crav Line, which can act as a rejection area. Because of that, there is still a possibility of a short pullback before the real continuation move begins.
Current Market View 🔥
As long as the reversal zone holds, the structure remains bullish for me. The reaction inside this zone will decide whether the market continues the trend or gives another fake move first.
Now the main thing is to watch how price reacts around the retesting zone. If buyers step in with proper confirmation, then BTC could continue pushing higher from this area.
---
Concepts Used :
✅ High Breakout
✅ W-Type Structure
✅ Retesting Zone
✅ Crav Line Rejection
✅ Trend Is Your Friend
✅ MMC Concept
This analysis is based on the MMC concepts designed by Candle King . A huge amount of credit goes to him because his concepts have helped me understand market structure and reversal zones in a much clearer way.
Long 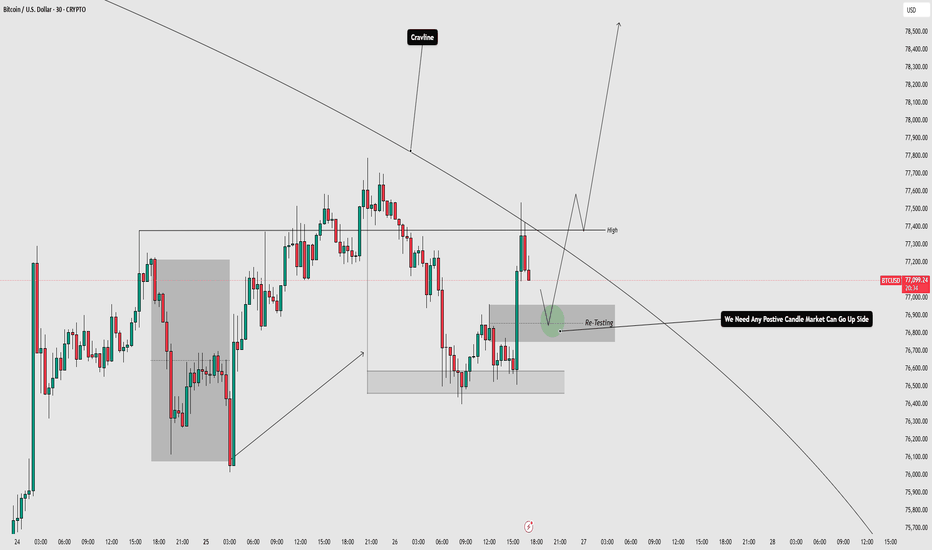
Support & ResistanceThe Mistake 90% of Traders Make
Support and Resistance are among the first things every trader learns.
Almost every strategy in trading uses them.
But here’s the problem:
Most traders draw Support & Resistance the wrong way.
That’s why many beginners experience:
* fake breakouts,
* stop loss hits,
* bad entries,
* and confusion on charts.
The truth is, Support & Resistance is not about drawing perfect lines.
It’s about understanding where buyers and sellers are active.
In this article, we’ll learn the correct way to draw Support & Resistance in simple and practical language.
1. Support & Resistance Are Zones, Not Lines
This is the biggest mistake beginners make.
Most traders draw one exact line and expect price to reverse perfectly from that point.
But markets do not work with perfect precision.
Instead of lines, think of Support & Resistance as areas or zones where price reacts.
Sometimes price:
* moves slightly above resistance,
* or below support,
before reversing again.
That is completely normal.
Professional traders focus on reaction areas, not exact prices.
2. Don’t Draw Too Many Levels
Another common mistake is filling the chart with dozens of lines.
When every small move becomes support or resistance, the chart becomes confusing and useless.
Good traders keep charts clean.
Focus only on important levels where:
* price reacted strongly,
* volume increased,
* or major reversals happened.
Simple charts help traders make better decisions.
3. Higher Timeframes Give Stronger Levels
Many beginners only use 5-minute or 15-minute charts.
But stronger Support & Resistance levels usually come from:
* 1-hour,
* 4-hour,
* daily,
* or weekly charts.
Why?
Because large institutions and smart money traders mostly focus on higher timeframes.
A support level on the daily chart is usually much stronger than one on the 5-minute chart.
Always start from higher timeframes before moving lower.
4. Wait for Confirmation — Don’t Trade Blindly
Just because price reaches support or resistance does not mean you should instantly enter a trade.
Many traders lose money because they enter too early.
Instead, wait for confirmation like:
* strong rejection candles,
* breakout failures,
* volume increase,
* or market structure shifts.
Confirmation helps avoid fake breakouts and emotional trades.
Patience is more important than speed in trading.
5. Support Becomes Resistance — And Resistance Becomes Support
This is one of the most powerful concepts in trading.
When price breaks a resistance level strongly, that same level often becomes new support.
Similarly:
* broken support can become resistance.
This is called a role reversal.
Understanding this concept helps traders find:
* better entries,
* stronger trends,
* and cleaner setups.
Professional traders use this idea regularly.
6. Psychology Plays a Big Role
Support & Resistance work because traders react emotionally around important levels.
At support:
* buyers become confident.
At resistance:
* sellers become active.
The market moves based on fear, greed, and trader behavior.
That’s why these levels repeat again and again in every market:
* stocks,
* forex,
* crypto,
* and commodities.
Charts change, but human psychology stays the same.
7. Final Thoughts
Support & Resistance look simple, but most traders use them incorrectly.
The goal is not to draw perfect lines.
The goal is to understand how price reacts around important areas.
Remember:
* treat levels as zones,
* keep charts clean,
* use higher timeframes,
* and wait for confirmation.
Sometimes one well-drawn Support or Resistance level is more powerful than ten indicators.
In trading, clarity always beats complexity.
Education 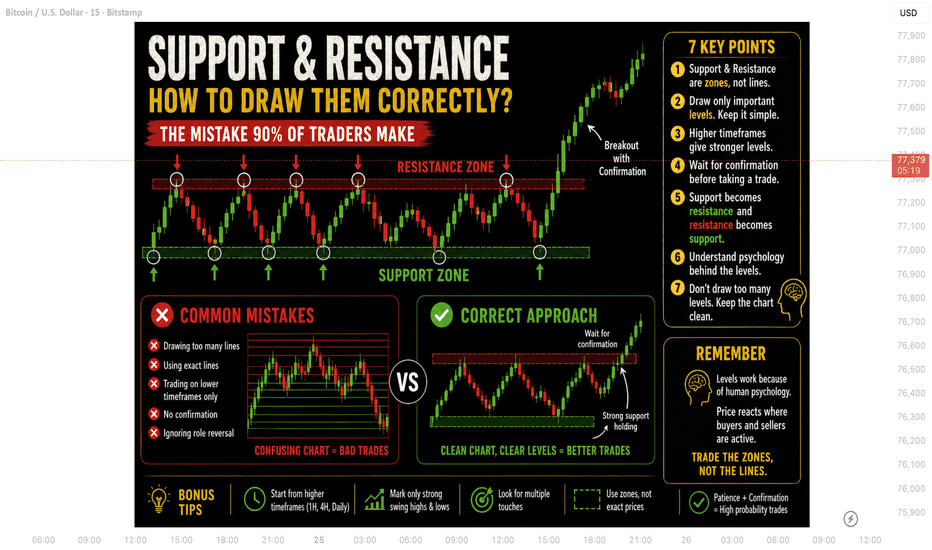
Bitcoin chart analysis May 22Hello
It's a Bitcoin Guide.
My analysis is optimized for TradingView.
If you press the Replay button, you can check real-time movements.
This is the Bitcoin 30-minute chart.
On the left, I have maintained the strategy exactly as it was at the entry point of the long position entered on May 21st (marked by the purple finger) at $76,990.5.
*This is a two-way neutral strategy before and after touching the first zone marked by the light blue finger at the top.
1) After confirming the touch of the light blue finger at zone 1, the entry point for the long position is at $76,784.8 at the bottom / Stop loss price if the light blue support line is broken.
2) 1st target for the long position at $78,340.3 -> Target prices over the weekend in the order of Top, Gap 10, and Good.
Please be cautious, as an uptrend could immediately follow the touch of zone 1 at the top.
If the price drops immediately without touching Zone 1:
Wait for a long position at Zone 2 at the bottom / Stop loss if the light blue support line is broken.
- If the price breaks the light blue support line,
I think it would be good to set the stop loss at 76.9K, the same entry point as the long position entered yesterday.
Since the price is open to the Bottom from the breakout of Zone 2,
those currently holding long positions need to be careful.
Also, next Monday, the 25th, is a public holiday.
I will see you on Tuesday, the 26th.
Please use my analysis post merely as a reference and for practical application.
I hope you operate safely by strictly adhering to trading principles and using stop loss measures.
Thank you for your hard work this week.
Thank you. Long 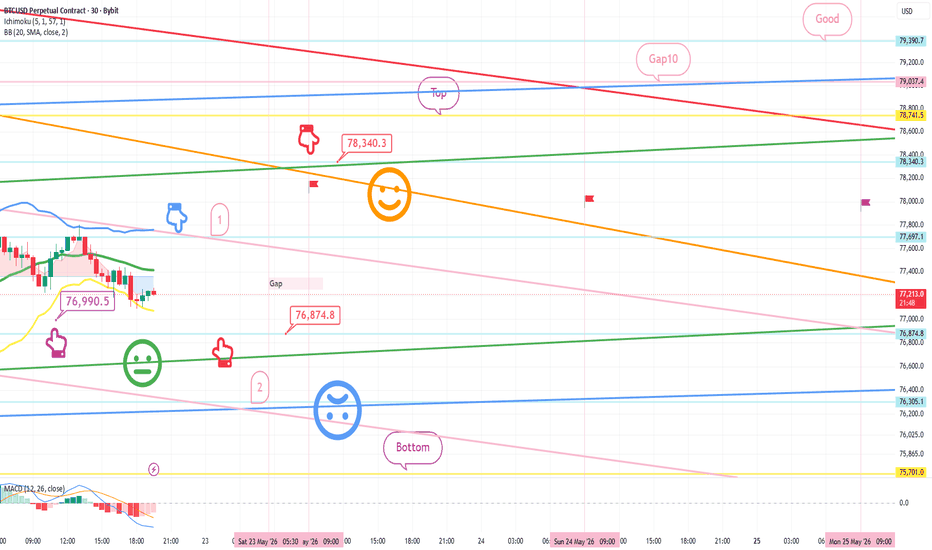
Technical AnalysisCore of Technical Analysis
Technical Analysis is the study of past price movements, volume, and market trends to predict future price direction.
3 Main Principles:
Market Discounts Everything
All news, emotions, and fundamentals are already reflected in price.
Prices Move in Trends
Markets usually move in uptrend, downtrend, or sideways trends.
History Repeats Itself
Human psychology creates repeating chart patterns.
Key Tools:
Charts (Candlestick, Line, Bar)
Support & Resistance
Trendlines
Indicators (RSI, MACD, Moving Averages)
Volume Analysis
Patterns (Head & Shoulders, Double Top, Triangle)
Goal:
Find good entry, exit, and risk management points for trading. Education

Long 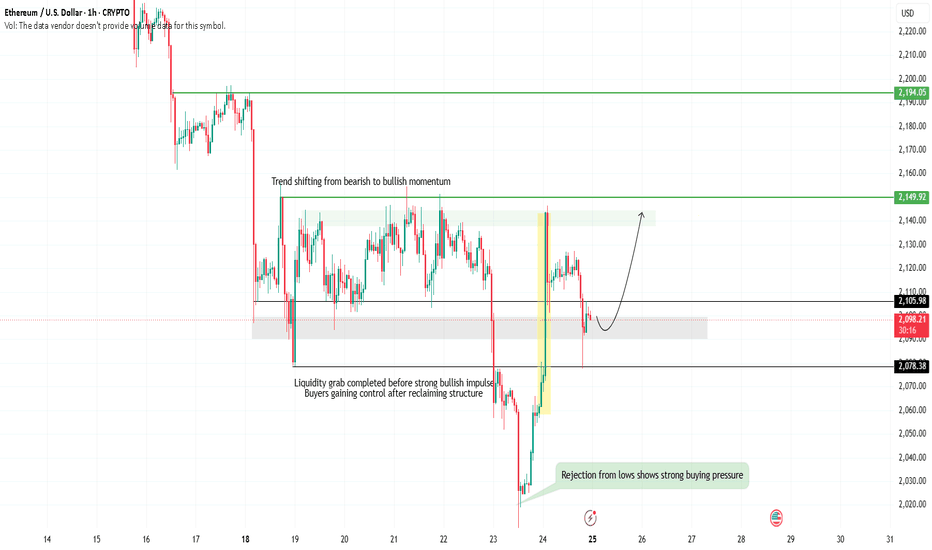
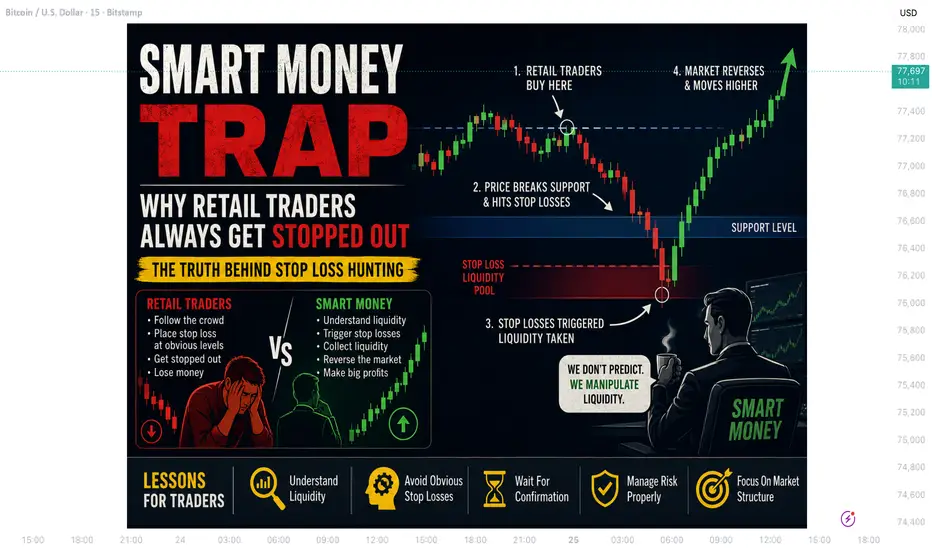
Smart Money Trap: Why Retail Traders Always Get Stopped OutMost beginner traders think the market is moving randomly.
But after spending enough time in the charts, many traders notice one painful pattern:
“Price hits my stop loss… and then moves exactly in my direction.”
If this keeps happening to you, you are not alone.
This is one of the biggest reasons why retail traders lose confidence. The truth is, markets are heavily driven by liquidity, emotions, and smart money behavior — not just indicators.
In this article, we’ll understand why stop losses get hunted and how smarter traders avoid this common trap.
1. Smart Money Knows Where Retail Traders Place Stop Losses
Most retail traders learn the same concepts:
* Put stop loss below support
* Put stop loss above resistance
* Use equal highs and equal lows
* Follow common candlestick patterns
The problem?
Millions of traders place their stop losses in the exact same areas.
Large institutions and smart money players know this very well. These zones become liquidity pools where big players can collect orders before making the real move.
That’s why price often:
* breaks support slightly,
* hits stop losses,
* and then reverses strongly.
This is called a liquidity grab or stop hunt.
2. The Market Moves Toward Liquidity
The market needs liquidity to move.
Big traders cannot enter huge positions instantly because they need enough buyers and sellers on the other side. Retail stop losses provide that liquidity.
For example:
* Traders buy near support
* Their stop losses sit below support
* Smart money pushes price slightly lower
* Stop losses trigger
* Liquidity enters the market
* Big players buy at better prices
After that, the market suddenly moves upward.
To retail traders, it feels manipulated.
In reality, it’s how markets naturally operate.
3. Tight Stop Losses Are a Big Mistake
Many traders use very small stop losses because they want:
* bigger risk-reward,
* quick profits,
* or higher lot sizes.
But markets do not move in perfectly straight lines.
Price constantly creates:
* small fake breakouts,
* volatility spikes,
* and liquidity sweeps.
If your stop loss is too tight, normal market movement can remove you from the trade before the real move begins.
Good traders understand that:
“A stop loss should be placed where the trade idea becomes invalid — not where emotions feel comfortable.”
4. Retail Traders Trade Emotionally
Smart money uses psychology against retail traders.
Most traders:
* panic during small pullbacks,
* chase breakout candles,
* enter late,
* and move stop losses emotionally.
This creates predictable behavior.
When everyone sees the same breakout, retail traders rush into trades together. Smart money often uses this emotional buying or selling pressure to trap traders before reversing the market.
Patience is one of the biggest advantages in trading.
5. How Professional Traders Avoid Stop Hunts
Professional traders focus more on structure and liquidity than indicators.
Some common habits of experienced traders:
* Avoid placing stop loss exactly at obvious levels
* Wait for confirmation after liquidity sweeps
* Trade with proper risk management
* Focus on market structure instead of emotions
* Understand where retail traders are trapped
Instead of chasing price, they wait for the market to reveal its true intention.
That small mindset shift changes everything.
6. Stop Loss Is Still Important
After reading this article, some traders may think:
“I should stop using stop loss.”
That is completely wrong.
Stop loss is essential in trading.
The goal is not to avoid stop losses completely. Even professional traders take losses regularly.
The real goal is:
* using smarter stop placement,
* managing risk properly,
* and understanding market behavior.
A controlled loss is always better than one emotional trade destroying your account.
7. Final Thoughts
The market is designed to test emotions.
Most retail traders lose because they follow the crowd, place obvious stop losses, and react emotionally to short-term movement.
Smart money understands liquidity, patience, and psychology.
The moment you stop trading emotionally and start understanding how liquidity works, your entire perspective on the market changes.
Remember:
The market does not move against you personally.
It simply moves where liquidity exists.
And most of the time… retail stop losses are the liquidity Education 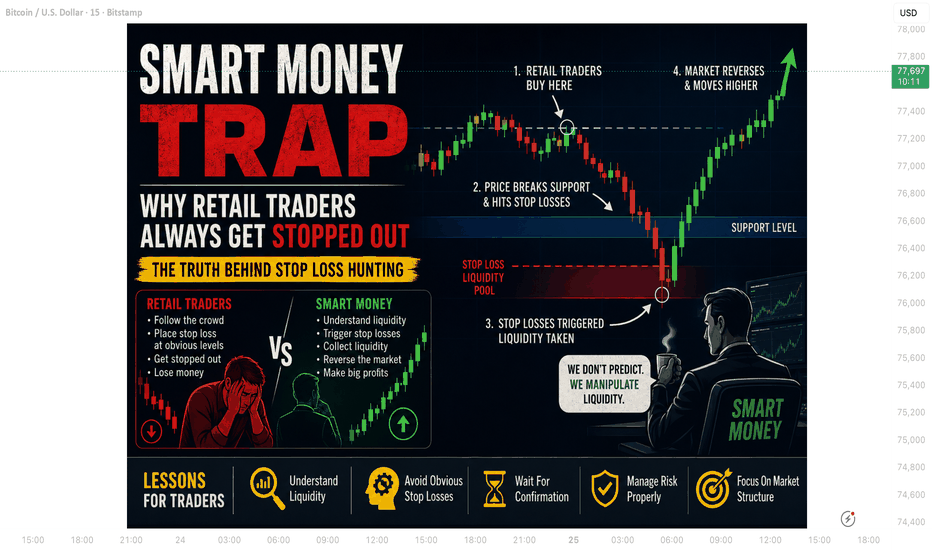
 Long
Long