MARAL — Dynamic Risk MapperMARAL — Dynamic Risk Mapper- New script
From static trade levels to live execution intelligence
Most trade-management tools stop at drawing a few levels.
They show an entry, a stop, a target, and leave the trader alone once price starts moving.
But in live markets, that is exactly where the real problem begins.
A trader does not struggle only with where to enter.
A trader struggles with what happens after the trade is mapped:
Is price still respecting the entry zone?
Is invalidation pressure increasing?
Is TP1 close enough to require management?
Is the trade still healthy, or is momentum fading?
If price moved toward SL and came back, is that a real recovery or just noise?
Should the trader hold, protect, reduce, or exit?
That is the purpose of MARAL — Dynamic Risk Mapper Pro.
This script is built as a discretionary trade-mapping and management-support framework designed to help traders read the evolving condition of a mapped trade in a more structured and practical way.
It is not an automated system.
It does not place orders.
It does not guarantee outcomes.
It is a workflow tool built to improve clarity, execution discipline, and live management awareness.
Why this tool was built
Most traders already have enough chart tools.
What they often do not have is a system that can help them read the relationship between:
entry
invalidation
managed stop
target structure
pressure
recovery behavior
action response
in one live framework.
The goal of MARAL — Dynamic Risk Mapper Pro is to convert a manually planned trade into a living management map.
The trader provides only two core inputs:
Trade Side
Manual Entry Price
From there, the script organizes the trade into a dynamic map that continuously evaluates how price is behaving relative to that trade.
This makes the chart less about static lines and more about execution interpretation.
What the script does
Once a trade is defined, the script can map:
Base SL
Managed SL
TP1 / TP2 / TP3
invalidiation zone
momentum condition
confidence context
recovery behavior
live management posture
Instead of only asking, “Where is my stop?”, the script helps the trader ask:
What is this trade doing right now?
That shift matters.
Because a trade is not only a price level.
It is a condition that changes over time.
The example chart
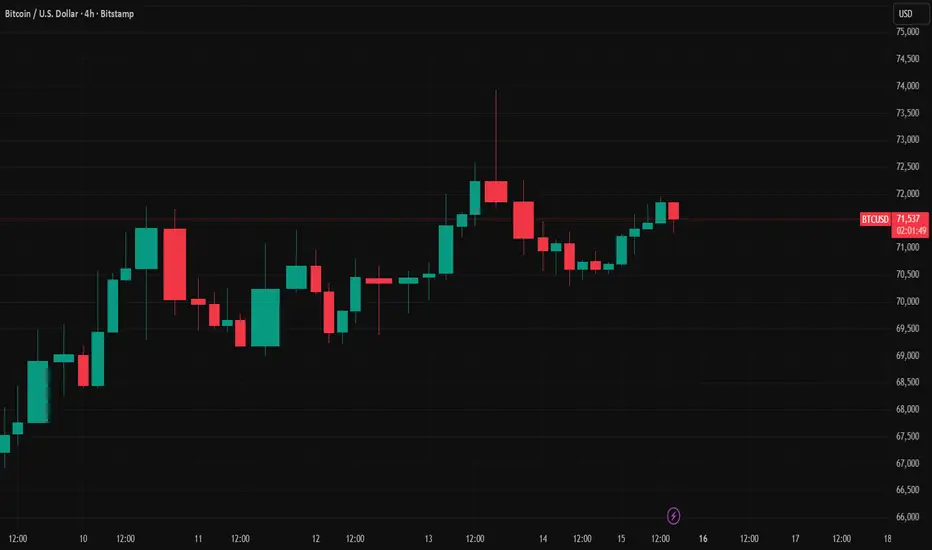
This example uses BTCUSD on the 4-hour chart with a manually defined Long entry at 71,200.00.
The script has mapped:
Entry at 71,200.00
Managed SL below the trade
higher target structure above price
live panel output on the right side of the chart
What makes this example useful is that it is not showing a fully expanded winner.
It is showing a more realistic live situation:
price is still around the entry area,
momentum is not yet cleanly expanding,
the trade remains valid,
but stronger acceptance is still needed.
That is exactly the kind of situation where traders usually become emotional or impatient.
This is where the script adds value.
Panel 1 — Dynamic Risk Mapper
The first panel is the live location panel.
It explains where price is relative to the mapped trade.
In this example it shows:
Side = Long
Entry State = Near Entry
Candle Bias = Bear
Zone = Entry Zone
SL State = Safe
TP1 State = TP1 Far
Event = Trail Update
Confidence = 6.3 / 10 | Moderate
What this means
The trade is mapped for a long-side idea, but price is still working around the entry region.
The chart is not showing a clean breakout away from entry yet.
That is why the script classifies the trade as Near Entry and Entry Zone rather than “cleared” or “expanding”.
The Candle Bias = Bear reading is important.
It means the immediate candle behavior is not fully aligned with the long-side trade.
That does not automatically invalidate the map, but it does reduce short-term conviction.
At the same time, SL State = Safe tells the trader that price is not yet under immediate stop-pressure conditions.
So this is not a panic state.
It is a patience state.
TP1 State = TP1 Far also matters.
It means the trade has not reached the stage where active target-management should dominate the trader’s decision.
And the Confidence = Moderate reading communicates the exact balance of the situation:
the map is active,
the trade is still usable,
but the environment is not yet strong enough to justify aggressive confidence.
This is one of the main advantages of the tool:
it gives the trader a structured way to recognize the difference between valid and fully favored.
Those are not the same thing.
Panel 2 — Management Response Desk
The second panel is the behavior panel.
It does not focus on where price is.
It focuses on how the mapped trade is behaving.
In the example it shows:
Trade Status = Valid
Momentum = Weakening
Pressure = Low
TP1 Response = Wait
Action = Hold
What this means
The trade has not failed.
The structure is still valid.
But price is not yet delivering the kind of strong follow-through that would justify more aggressive trade confidence.
That is why Momentum = Weakening is an important reading here.
The script is not saying the trade is broken.
It is saying the trader should not confuse a valid map with a strong expansion.
This is a critical distinction in real trade management.
The Pressure = Low output is also important.
It tells the trader that while momentum is softer, the trade is not yet under high invalidation stress.
The script therefore avoids overreacting.
Then the panel shows:
TP1 Response = Wait
Action = Hold
This is another major design advantage of the tool.
Instead of forcing premature management decisions, the script recognizes that TP1 is not yet the dominant problem in this chart state.
So it does not push unnecessary partial exits or over-management.
The posture remains calm:
the map is valid,
pressure is controlled,
but stronger confirmation is still needed.
Panel 3 — Trader Guidance Panel
This is where the script becomes especially practical.
The third panel translates the live state into clear sentence-style guidance.
In the example it says:
Comment: Price is testing the entry zone.
Risk Note: The entry is active only if the zone is respected.
Next Step: Wait for acceptance before holding with confidence.
This is one of the strongest practical advantages of the script.
Most tools give technical status.
Very few tools convert that status into a readable live instruction.
This panel is designed to reduce confusion and emotional overreaction by turning technical conditions into operator guidance.
Not signals.
Not promises.
Not predictions.
Guidance.
That is a very important difference.
What this example really teaches
This example is not a chart where everything is already perfect.
That is why it is a good example.
It shows a mapped long trade that is:
still structurally valid
not under immediate stop pressure
not close enough to TP1 for target-driven management
but still lacking clean expansion away from entry
That is a realistic condition many traders face.
Without a structured map, this is exactly where traders start making mistakes:
entering too aggressively
doubting too early
tightening too soon
taking profit too early
holding with false confidence
confusing survival with strength
The script helps separate these conditions.
It helps the trader understand that:
a trade can still be valid without yet being strong.
That single distinction can improve trade-management discipline significantly.
Advantages for traders
1) Better live trade awareness
The script helps traders understand where price is relative to entry, SL, and TP structure without relying only on visual estimation.
2) More disciplined invalidation reading
Instead of reacting emotionally when price moves toward risk, traders get structured context around:
stop pressure
risk zone behavior
recovery watch
recovery confirmation
3) Clearer target-management timing
The script does not treat all target conditions the same.
It helps traders distinguish between:
TP still far
TP approaching
TP reached
target response required
4) Stronger post-entry clarity
Many tools are strongest before entry and weakest after entry.
This script is designed to stay useful after the map is active.
5) Plain-language guidance
The commentary panel reduces mental noise by converting market condition into direct trade-management language.
6) Engineering-style workflow
The structure is designed to feel more like a management console than a simple indicator stack.
That helps traders work with process, not impulse.
What this tool is not
This script is not:
a broker-connected system
an automated execution engine
a guaranteed target model
a buy/sell recommendation service
a replacement for personal judgment
It is a trade-mapping and management-support framework built to help traders operate with more structure.
Final note
Markets do not become easier because a few lines are drawn on the chart.
They become more manageable when the trader can understand:
where the trade is
what condition it is in
what pressure is changing
what response is appropriate now
That is the purpose of MARAL — Dynamic Risk Mapper
It is built to help traders move from static trade marking
to live execution intelligence.
Note : Education purpose only
 Education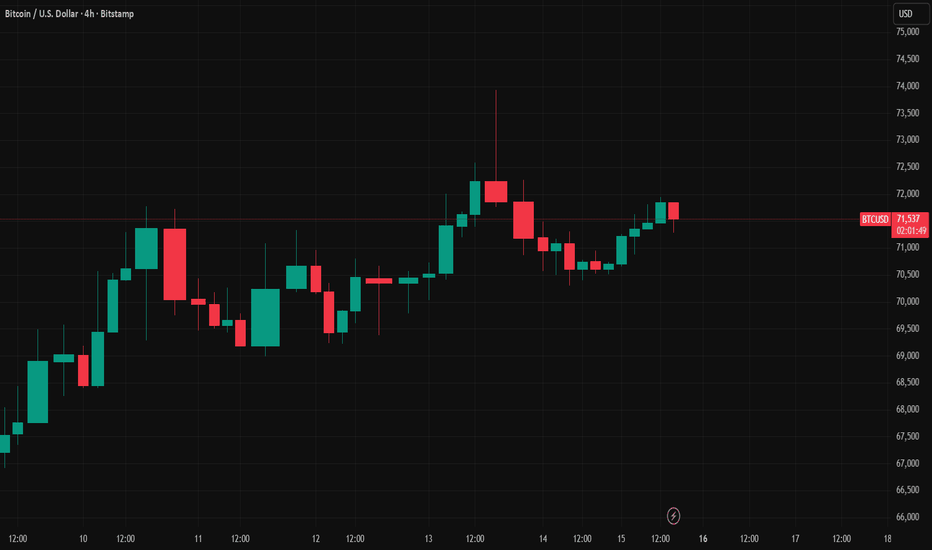
$ETH short-term weakness after failing to hold the intraday highCRYPTOCAP:ETH just slipped from $2,122 to around $2,094, showing short-term weakness after failing to hold the intraday highs.
On the lower timeframe, the structure is currently forming lower highs, which suggests sellers are controlling the short-term momentum. The rejection near $2,120–$2,130 confirms that this zone is acting as immediate resistance.
Key levels
• Resistance: $2,120 – $2,130 (recent session high)
• Minor resistance: $2,100 psychological level
• Support: $2,060
• Stronger support: $2,040
Right now the market is trading below the $2,100 area after the quick drop. If price attempts a bounce, the $2,100–$2,120 region will likely act as the first supply zone where sellers may step in again.
Order book structure also supports this view. There is thicker ask liquidity between $2,120 and $2,150, meaning a cluster of sell orders waiting above. On the downside, bids are relatively thin until $2,050, with stronger liquidity sitting closer to $2,000. This imbalance creates a short-term resistance bias, where upward moves may struggle unless strong buying pressure clears those offers.
From a higher timeframe perspective, #Ethereum still sits in a broader bullish secular trend, but the daily structure is currently corrective after the recent highs. Price action looks more like distribution and consolidation rather than a fresh impulse move.
So the short-term view is simple:
• Rallies into $2,100–$2,120 may face selling pressure.
• If $2,060 breaks, the next reaction zone is around $2,040.
• A reclaim above $2,130 would shift momentum back to bullish intraday.  Short
Short
BTC/USDT (Bitcoin) – 45-Minute ChartMarket Structure Overview
On the 45-minute timeframe, BTC/USDT is currently trading within a well-defined horizontal range following a strong bullish impulse that pushed price into a key resistance zone. The chart shows a clear distribution structure near the upper boundary, suggesting that bullish momentum is weakening after the recent spike toward the 73,000 region.
Price recently retested the highlighted resistance zone around 71,600 – 72,000, which has previously acted as a supply area. This region triggered a strong rejection, visible through multiple bearish candles and a sharp pullback from the local high.
Resistance Zone Reaction
The marked resistance zone represents a significant liquidity and supply area where sellers previously entered the market. After briefly breaking above the range high, Bitcoin failed to sustain higher prices and quickly rotated back below the resistance.
This behavior suggests a possible bull trap or liquidity sweep, where price moved above previous highs to trigger buy-side liquidity before reversing downward.
Short-Term Bearish Scenario
If price continues to remain below the 71,800 resistance region, the market may enter a corrective bearish rotation. The chart projection indicates a potential move toward the lower boundary of the range.
The primary downside target sits near the support zone around 68,500 – 69,000, which has historically acted as a demand area where buyers previously stepped in.
Key Levels to Watch
Resistance: 71,600 – 72,000
Intermediate Support: 70,200 – 70,500
Major Support / Target: 68,500 – 69,000
Technical Outlook
As long as price remains below the resistance zone, the short-term bias favors a pullback toward lower support levels. However, if Bitcoin manages to reclaim and hold above 72,000 with strong momentum, the bearish scenario would weaken and the market could attempt another move toward 73,000 – 74,000.
✔ Bias: Short-term bearish correction
✔ Structure: Range with resistance rejection
✔ Focus: Watch for continuation toward range support Short 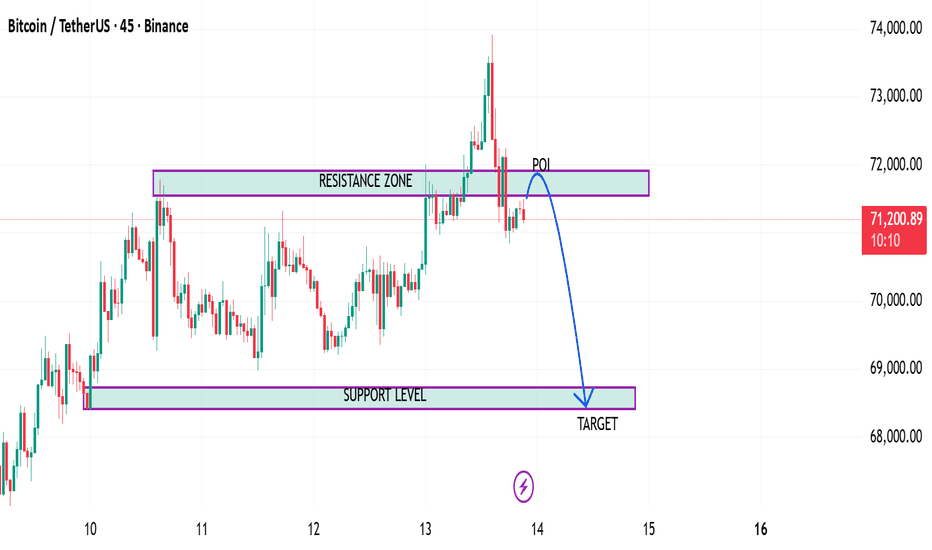
Long 
BTCUSD Potential Bullish Reversal from Key Support
Bitcoin is currently trading around the **70,600** level after completing a sharp correction from the recent local high. The price structure on the 15-minute chart shows a clear **ABC corrective pattern**, where the market formed a lower low and then started building a potential base near the **70,500 support zone**.
The recent price action suggests that sellers are losing momentum as Bitcoin forms a **higher low after the correction**, indicating a possible shift toward bullish momentum. The marked support area has already reacted once, which strengthens the probability of a short-term rebound.
If price holds above the **70,500 support**, a long opportunity may emerge around the **70,600 entry zone**, targeting the **73,180 resistance area**. This level aligns with the previous structural resistance where sellers previously entered the market.
**Trade Setup**
* **Entry:** 70,600
* **Stop Loss:** 69,980 (below support to protect against a breakdown)
* **Target:** 73,180 Long 
MARAL Execution Workflow — Turning Chart States into Live AlertsThe attached BTCUSD chart is a simple but powerful example of why modern execution tools should never stop at visual markers alone.
A marker on a chart is useful only if the trader is watching the screen at the exact moment it prints. But a serious execution framework is not built for passive viewing. It is built for state detection, permission control, and timed communication. That is exactly where the MARAL alert architecture changes the role of an indicator on TradingView.
This chart is not just showing candles. It is showing a workflow. It is showing how market structure, trap logic, execution permission, and trade-health monitoring can be converted into a live alert system that speaks to the trader at the moment the condition becomes actionable.
Why this feature matters
Most indicators stop at one of two levels:
They either draw signals after the fact, or they generate generic alerts with poor context.
That is not enough for serious traders.
A professional alert system must answer six questions immediately:
What happened?
In which direction?
On which timeframe?
What is the quality of the condition?
What is the operational meaning of the event?
What should the trader do next?
MARAL answers all six inside the alert message itself.
So instead of receiving a weak notification like “buy signal” or “sell signal,” the trader receives a structured execution-grade event such as:
MARAL | TRAP EXPANSION LONG PERMISSION | DIR: LONG | TF: 1 | QUALITY: STRONG | NOTE: TL marker triggered | PX: 70123.45
That is not cosmetic improvement. That is decision compression.
It reduces interpretation time, cuts confusion, and transforms alerting from noise into operational intelligence.
The core architecture behind the alert engine
The strength of this system is not that it sends alerts. The strength is that it sends state-aware alerts.
In MARAL, alerts are separated into layers:
1. Trap alerts
These identify the early emergence of a trap-side condition before the trader assumes that the market has already committed to trend continuation.
2. Execution alerts
These do not simply say direction. They confirm when execution permission becomes active based on the system’s internal gating logic.
3. Trap Expansion alerts — TL / TS
This is one of the most important additions.
When the chart prints a TL or TS marker, the trader should not have to discover it later. The system now pushes that event immediately through the realtime alert engine.
4. Trade-monitor alerts
The system continues to work after entry.
It can escalate warnings for weakening trade health, deteriorating momentum, TP1 interaction, BE exit, SL event, and final closure.
This means MARAL is not acting like a signal lamp.
It is acting like an execution console.
Why TL and TS alerts are important
This is the difference between visual logic and executable logic.
A TL or TS marker on the chart is valuable, but only if it reaches the trader in time. If the marker exists and the trader sees it ten minutes later, then the marker has become historical information, not live execution information.
By wiring TL and TS into the realtime engine, MARAL closes that gap.
Now the marker is no longer only a plotted symbol.
It becomes an event.
That matters because trap-expansion moments are often the transition points where the market moves from hesitation into directional expression. Missing that transition can mean worse entry quality, wider stop placement, or no valid trade at all.
So the alert is not merely telling the trader that a symbol appeared.
It is telling the trader that a structural state has changed.
Functional alerts vs realtime alerts
This distinction is extremely important.
Functional alerts are the named alert conditions that appear inside the TradingView alert menu set any time frame as per the trading style . These are useful when a trader wants to selectively monitor a specific class of events such as:
MARAL QUICK LONG ENTRY PERMISSION
MARAL QUICK SHORT ENTRY PERMISSION
MARAL TRAP TO EXPANSION LONG PERMISSION
MARAL TRAP TO EXPANSION SHORT PERMISSION
MARAL LONG PERMISSION
MARAL SHORT PERMISSION
Realtime alert-engine alerts are different.
These are pushed through Any alert() function call and are driven by the script’s event logic in real time. TradingView notes that for alert()-based alerts, the script controls the message and firing behavior, not the alert dialog itself.
That makes them ideal for MARAL’s execution-layer communication because the message can include:
event name
direction
timeframe
quality grade
note
live price
This is what makes the system suitable for fast execution environments.
Technical benefit to traders
The practical value to traders is significant.
First, it reduces screen dependency.
A trader no longer needs to stare at every candle waiting for state transitions.
Second, it reduces interpretation load.
The message itself tells the trader what changed.
Third, it improves response timing.
Instead of discovering a marker after the move, the trader receives the event when the logic becomes active.
Fourth, it supports disciplined trading.
Because the system can communicate both permission and deterioration, it helps traders avoid the classic mistake of focusing only on entry while ignoring trade quality after entry.
Fifth, it improves process consistency.
A trader using structured alerts is far less likely to trade based on emotion, impulse, or delayed recognition.
This is especially for traders operating in fast intraday conditions, multi-chart environments, or funded-account contexts where hesitation and overreaction both carry real cost.
Ordinary indicators tell traders what the chart looks like.
A serious workflow tells traders what the market is allowing.
That is the difference.
MARAL is not designed around excitement.
It is designed around permission.
Not every bullish candle deserves a long.
Not every bearish move deserves a short.
Not every trap deserves execution.
Not every setup deserves continuation.
The alert engine exists to communicate those distinctions with precision.
That is why this architecture is far more aligned with professional execution than with retail-style signal chasing.
TradingView implementation value
From a TradingView workflow perspective, this feature is powerful because it converts Pine logic into an event-driven operating system for the trader.
TradingView’s documentation confirms that users create script alerts by selecting the script in the Condition field and then choosing “Any alert() function call.” It also notes that if a script alert fires more than 15 times within three minutes, the alert will stop automatically, which is an important engineering consideration for any serious realtime system.
That means a properly designed alert engine must be selective, stable, and intentional.
MARAL is built with that philosophy.
It does not treat alerts as decoration.
It treats alerts as controlled transmissions.
Final thought
The future of execution tools is not more colors, more arrows, or more noise.
The future is controlled state communication.
The attached chart is a visual snapshot.
But the real innovation is what the trader does not need to watch continuously anymore.
When trap logic becomes actionable, MARAL can speak.
When execution permission opens, MARAL can speak.
When TL or TS prints, MARAL can speak.
When trade health weakens, MARAL can speak.
When risk escalates, MARAL can speak.
That is the difference between a chart tool and an execution system.
MARAL is not built to show the market.
It is built to tell the trader when the market changes state.
Note : This article presents the logic and operational value of MARAL’s alert architecture as an execution-support framework. It is designed to improve timing awareness, reduce missed structural transitions, and support systematic trade management through functional and realtime alerts. It should be understood as a workflow and chart-interpretation tool, not as a promise of outcome or a substitute for independent risk control. Education 
BITCOIN Range Rejection SHORT TRADE OPPORTUNITYBITCOIN Range Rejection SHORT TRADE OPPORTUNITY 🔻
CRYPTOCAP:BTC hits the upper edge of its month-long range again, sellers waiting at the door. The 73k–74k zone has acted as supply multiple times, and structure continues to show rejection whenever price approaches this area.
Market’s stuck between 74k-62k. Now, Strategy is short at the top, target mid & bottom.
Trade Plan
🔽 Short
✳️ Entry Zone: 73k – 74.1k (can start at CMP and scale using DCA)
🛑 Stop Loss: 74.8k
🎯 Targets: 72k, 70.8k, 69.5k, 68k, 66k, 64k, 60k
Reasons for #Bitcoin Shorting:
🔻 Price approaching range resistance
🔻 Previous rejections near 74k region
🔻 Liquidity resting inside the 65k–63k demand block
If the range holds, BTC can rotate back toward the mid-range and demand zone again.
⚠️ Important: If price breaks and holds above 74.8k, the range invalidates and BTC could accelerate toward 76k–79k quickly. Short near range highs, respect the stop if breakout occurs. Short 
Bitcoin Breakout and Retest done — Now Flip Zone Holding!Hello Everyone, let's analyse Bitcoin of this 15-minute chart, Bitcoin is showing a classic price action behaviour that traders often look for: resistance → breakout → retest → continuation.
Earlier, this level acted as a strong resistance where price was rejected multiple times. Once buyers finally pushed price above it, the structure shifted.
Now the interesting part is happening.
Instead of breaking back below the level, Bitcoin is reacting right at the same zone, suggesting that the previous resistance is now acting as support (flip zone).
Breakout above resistance showed strong buying pressure.
Price pulled back into the flip zone instead of continuing straight up.
Support is currently holding , which often indicates buyers defending the structure.
If the level continues to hold , price may attempt another move toward the nearby targets.
Right now the focus is simple: how price behaves around the flip zone.
If support holds, continuation toward 70,100 → 70,500 → 70,900 becomes possible.
If the level breaks cleanly, the setup becomes invalid.
Because in trading, the breakout is easy, holding the retest is what confirms the move.
Disclaimer:
This analysis is for educational purposes only. Always manage your risk and follow your own trading plan. Long 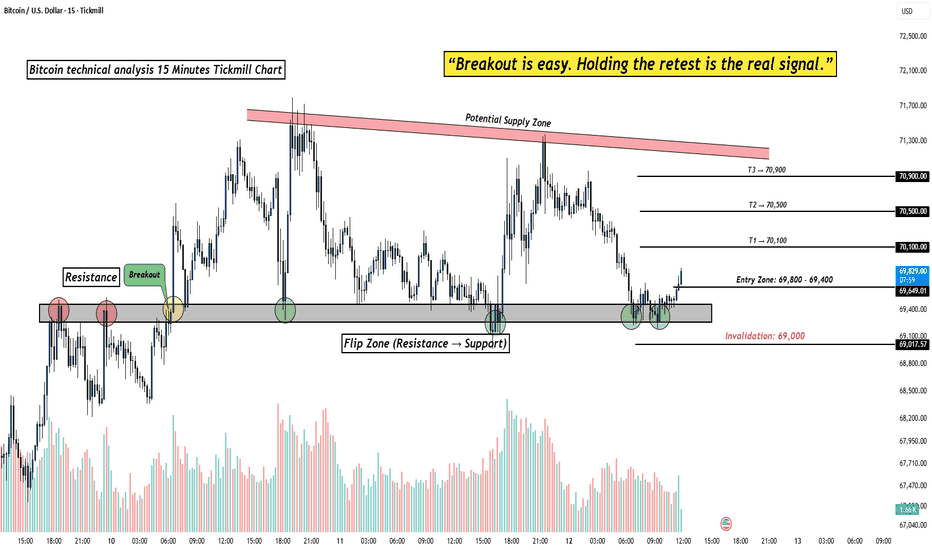
Long 
Short 
Bitcoin Bybit chart analysis MARCH 12Hello
It's a Bitcoin Guide.
If you "follow"
You can receive real-time movement paths and comment notifications on major sections.
If my analysis was helpful,
Please click the booster button at the bottom.
This is a Bitcoin 30-minute chart.
Among the Nasdaq, gold, and Bitcoin, Bitcoin has the fastest turnover.
It's time for a trend to emerge,
but it's moving very frustratingly.
I'll follow the trend trading strategy.
We have a stop-loss level.
*When the red finger moves,
Long position strategy:
Before and after touching the first section of the purple finger at the top
1. After confirming the touch of the first section of the purple finger at the top,
Long position entry point at $70,384.1 at the bottom / Stop-loss level when the purple support line is broken
2. Long position first target at the top section: $72,577 -> Good. Second target price.
A true rebound occurs when the good section is reached.
If the purple finger fails to touch the first section,
the final long position strategy is to wait at the second section at the bottom
and the stop-loss level is set when the green support line is broken. (Sideways)
Below that, Bottom -> Please note that up to three positions are open.
Please note that my analysis is for reference only.
Please use it sparingly, and I hope you operate safely, following the rules and following stop-loss orders.
Thank you. Long 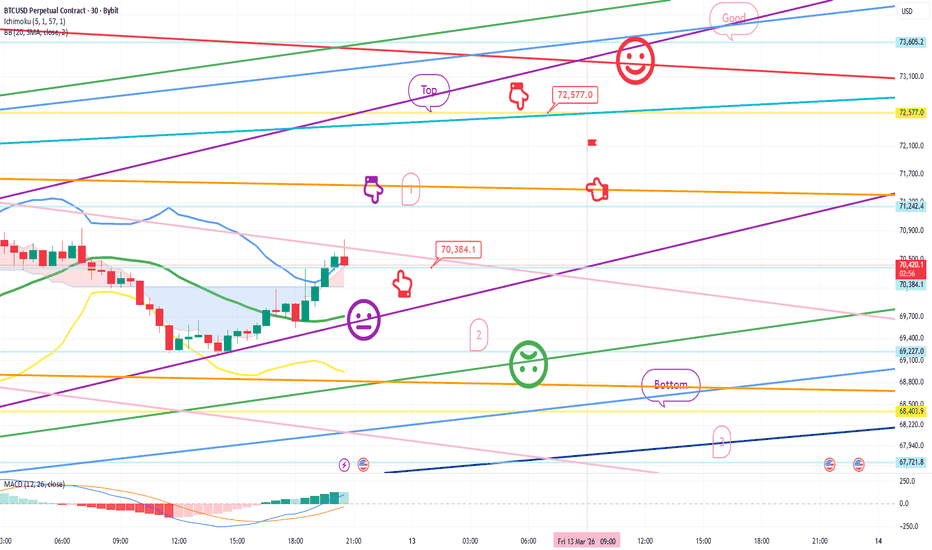
Long 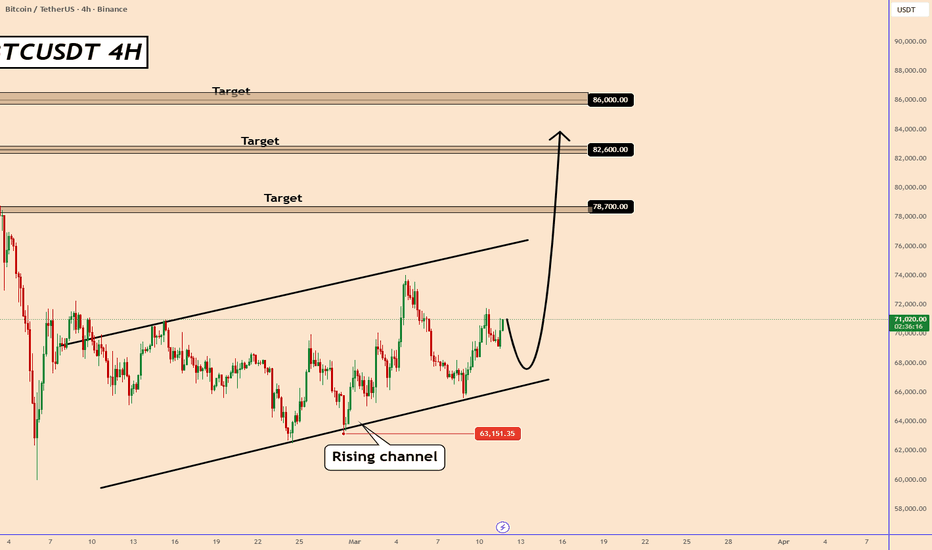
Education

$TRX is currently trading inside a rising wedge on the 12H chartAMEX:TRX is currently trading inside a rising wedge on the 12H timeframe, with price sitting around 0.289–0.290 after another rejection near the upper wedge resistance around 0.291–0.292.
Price attempted to break the upper wedge, but the breakout failed and sellers immediately pushed it back inside the structure. This type of rejection often leads to a rotation toward the lower boundary of the wedge.
Right now, momentum is slightly weakening after the rejection, which increases the probability of a move toward the lower wedge support around 0.282–0.284.
If price continues drifting lower, the wedge support becomes the next reaction zone, where buyers previously stepped in multiple times.
However, if TRX manages to reclaim 0.292 with strong candles, the rejection becomes a fake move and the market could expand toward 0.298–0.302.
Trade Plan:
With the rejection from the upper wedge, traders may look for a short-term move toward the lower wedge support.
Stop Loss: 0.2920
Resistance: 0.292
Support zone: 0.282–0.284
For now, price is rotating inside the wedge, and the next move will likely test one of the structure boundaries.
➖➖➖➖➖
Follow Crypto Sat 🟨  Short
Short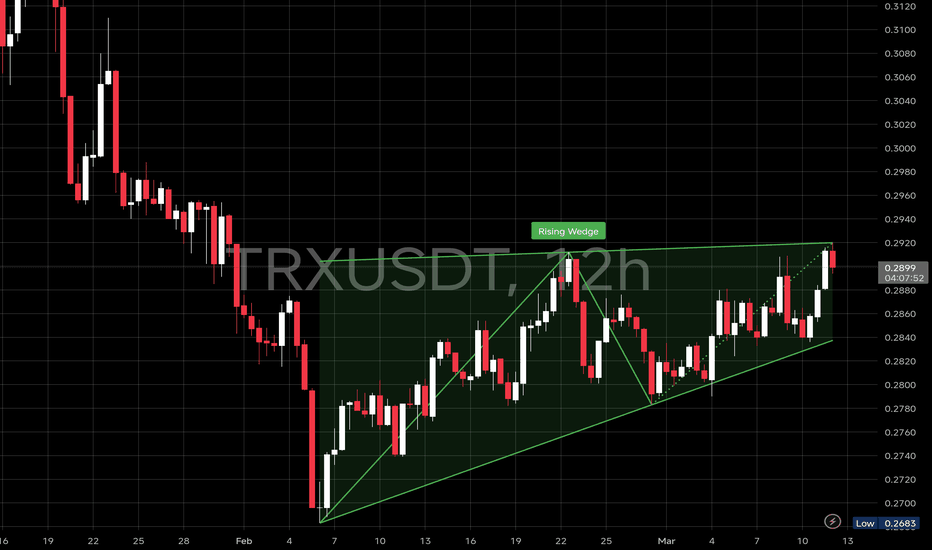
Bitcoin Bybit chart analysis MARCH 11
Hello
It's a Bitcoin Guide.
If you "follow"
You can receive real-time movement paths and comment notifications on major sections.
If my analysis was helpful,
Please click the booster button at the bottom.
This is Bitcoin's 30-minute chart.
The Nasdaq CPI indicator will be released shortly at 9:30 AM.
*When the light blue finger moves,
Short->Long switching.
This is a two-way neutral strategy.
Starting with long position 1 (purple finger),
1. $69,930 short position entry point / Stop loss price upon breaking the pink resistance line
2. $68,403.9 long position switch point / Stop loss price upon breaking the green support line
3. $71,250.1 long position first target -> Top second target price
If the price falls immediately without touching the short position entry point at the top,
then the final long position wait strategy is at the bottom, level 2.
(Downward-sloping sideways market)
Below that, the strategy is open from the bottom to up to level 3.
Up to this point, I ask that you use my analysis for reference only.
I hope you operate safely, with a focus on principled trading and stop-loss orders.
Thank you. Speculative Path-1 for Bitcoin for 2026Bitcoin ( BITSTAMP:BTCUSD ) price action has been showing a lot of weakness lately, even though equities and metals are in bullish zones. That's the nature of the cycle of this asset class that we have to deal with.
In Q1, we may see Bitcoin drift to $74,000 levels, where it will make a local bottom. This scenario will be accompanied by a correction in equity and commodity markets due to the looming fear of recession.
With the possible change of helm at the Federal Reserve and the likelihood of interest rate cuts, we may observe a countertrend rally towards $87,000. And that will become an inflection point for two possible scenarios. Today, we are discussing the Part-1 scenarios that has higher possibility.
At $87,000, we may face resistance at the price levels and the 20WSMA/21WEMA, which can trigger a downward slide towards $68,000 in Q2. With a possible formation of a bearish head and shoulders pattern, with $74,000 as the neckline being breached, new short sellers will enter the market. But it's noteworthy to mention that the $65,000-$69,000 levels were the top of the 2021 bull market, which will act as a strong support going forward.
Again, a snappy countertrend rally can take the prices to $80,000 levels in Q3. The final bottom may happen in Q4 at around $65,000-$69,000 levels, where the prices will meet the 200WSMA. This moving average has been the single most important factor when it comes to searching for Bitcoin market bottoms.
Even on the BTC Power Law chart, we will then enter the ultimate bullish zone for buying. At the lowest gray band, between $66,000-$74,000 levels, long-term investors will step in.
With an unconvincing/incomplete bearish H&S pattern and a lot of shorts in the system, that's when the new bull market will start.
I will present the Part-2 scenario in a different post. Short 
Solana was moving inside a rising wedge on the 4H chartCRYPTOCAP:SOL Update — Target 1 Completed 🎯
As discussed earlier, #Solana was moving inside a rising wedge on the 4H chart, with price approaching the $80–$81 lower wedge support. That zone acted as a strong reaction level multiple times in the past.
When price tested that support again, buyers stepped in exactly as expected.
From the support area around $82–$83, the market bounced strongly and hit $88.80, completing Target 1 perfectly. This confirms that the wedge structure is still being respected and traders are reacting to the key technical levels.
However, after touching $88–$90 mid-range resistance, the market is now showing signs of a short-term cooldown. This is normal because price often rotates inside wedge structures before the next move develops.
Current plan:
• TP1 achieved at $88+
• Expect minor pullback or consolidation from this region
• Maintain Stop-Loss at entry or near the $81 support zone to protect profits
Next levels to watch:
• Immediate support: $84–$83
• Strong wedge support: $80–$81
• If momentum returns, next upside levels remain $90 → $92
As long as price holds the wedge structure, the market can continue rotating between the lower and upper boundaries before a larger breakout eventually occurs.
For now, profit secured + risk managed is the smartest approach🚀  Long
Long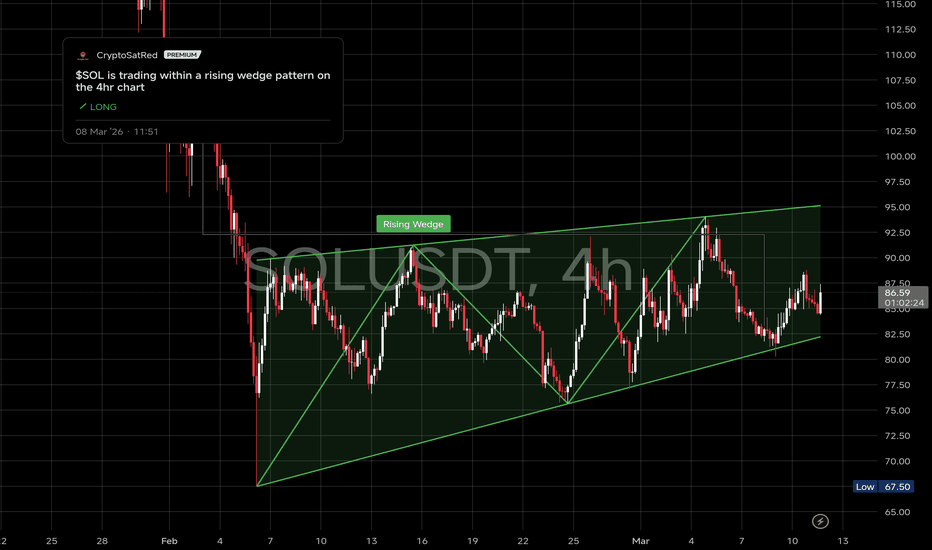
Education

Long 
When a Long Trap Appears — But MARAL Still Says No Trade
Reading the Trap Panel beyond emotion, beyond candles, beyond guesswork
Most traders see one thing after a liquidity event:
a sharp reaction, a reversal candle, and the feeling that “this is the entry.”
But trap trading is not about spotting a wick.
It is about identifying whether one side of the market has actually been trapped and whether the environment is strong enough to convert that trap into a valid execution opportunity.
That is exactly where the MARAL Trap Entry / Exit Permission Panel becomes critical.
In the BTCUSD 15-minute chart shown here, the panel detected a Long Trap, but it still refused to authorize entry.
That difference is the entire point.
A trap detected is not the same as a trap approved
This is one of the biggest mistakes retail traders make.
They assume:
liquidity taken = instant reversal
trap seen = immediate entry
one strong candle = confirmation
emotion = conviction
But a professional execution framework cannot work like that.
A real trap setup must answer deeper questions:
Which side is trapped?
Is the trap strong enough?
Is participation supporting the move?
Is flow aligned or conflicting?
Is the market in release mode or churn mode?
Is failure risk acceptable?
Does the total score justify execution?
If those layers do not align, then the correct action is not prediction.
The correct action is restraint.
What the Trap Panel showed in this case
From the panel in the screenshot:
Trap Side: Long Trap
Entry Permission: Blocked
Exit Permission: No Trade
Trap Strength: Weak
Participation: Bearish
Flow Alignment: Conflict
Trap State: Comp Churn
Failure Risk: High
Trap Score: 1 / 5
This is a perfect educational example.
On the surface, a trader may think the market is creating a long-side opportunity because sell-side liquidity has been taken.
But the Trap Panel is saying something very different:
Yes, a trap condition may be forming — but the quality is not sufficient, the flow is not aligned, the environment is unstable, and execution is not permitted.
That is advanced governance.
Why the entry was blocked
1) Long Trap does not mean immediate long entry
The panel identified a Long Trap.
That means the model sees a possible trapped-side narrative developing on the bearish side of price behavior.
But MARAL does not stop there.
It still checks whether the trap is clean, supported, and executable.
This is where many traders fail.
They turn market observation into market action too early.
2) Trap Strength was weak
A weak trap is not a premium trap.
Weak trap strength often means:
insufficient displacement
soft rejection
poor follow-through
incomplete reclaim behavior
low structural authority
So even though a trap label is present, the panel is saying:
the market has not yet produced enough force to justify trust.
3) Participation remained bearish
This is a major warning.
If trap logic is leaning long, but participation is still bearish, then the engine sees that seller pressure is still active in the market.
That means the market may not be ready for true long continuation.
It may still be in a rotational or deceptive phase.
In other words:
the trap narrative is not yet winning against the actual active pressure.
4) Flow Alignment was conflict
This is one of the strongest blockers.
Even if a local trap appears, MARAL checks whether broader flow agrees with it.
If flow alignment is marked as Conflict, then the trap is not harmonized with the wider market engine.
That means:
the trap may be early
the environment may be mixed
the move may fail quickly
the setup is not synchronized across layers
In MARAL logic, conflict reduces trust.
5) Trap State was Comp Churn
This is extremely important.
Comp Churn means the market is still operating inside a compression / churn condition rather than a clean directional release.
That kind of environment is dangerous because it creates:
false starts
repeated bait on both sides
noisy entries
unstable follow-through
emotional overtrading
This is exactly where inexperienced traders get trapped by the idea of a trap.
The panel is doing the opposite.
It is protecting the trader from entering before the market has truly transitioned out of churn.
6) Failure Risk was high
Once failure risk is marked High, the system is already warning that the trap idea has a large probability of breakdown or invalidation.
A high failure-risk environment means even if price gives a temporary push, the odds of continuation are still weak.
This is where disciplined frameworks outperform intuition.
7) Trap Score was only 1/5
This is the final compression of the entire logic.
The score tells you how many required conditions have actually passed.
A reading of 1/5 means the setup is far from execution quality.
That single number kills emotional trading.
Because once the score is that low, the question is no longer
“Can price bounce?”
The real question becomes:
“Does this deserve capital?”
And here, the answer is clearly no.
What this means in practical trading
This panel was not built to excite traders.
It was built to stop bad trades.
That is why this example matters.
A less structured trader might have entered simply because:
liquidity was taken
price reacted
trap concept looked attractive
candle behavior looked tempting
But the Trap Panel kept the execution blocked because the deeper conditions were not aligned.
That is how a professional execution framework should behave.
It should not reward impatience.
It should not convert every chart movement into a trade.
It should not confuse possibility with permission.
The real function of the Trap Panel
The MARAL Trap Panel is not a reversal toy.
It is not a signal sticker.
It is not a visual decoration.
It is an execution-governance layer.
Its job is to separate:
trap appearance from trap quality
market reaction from executable structure
emotional temptation from permission-based action
That is the difference between seeing a setup and qualifying a setup.
Final takeaway
This BTCUSD example shows a powerful lesson:
A trap can be visible, but still not be tradable.
That is the value of a rules-based framework.
The panel identified the possibility.
Then it tested the quality.
Then it rejected the execution.
That is not weakness.
That is discipline engineered into the workflow.
And in real trading, that discipline is often more valuable than the entry itself.
Educational conclusion
Do not trade because a trap looks interesting.
Trade only when the trap is supported by:
confirmed side logic
sufficient trap strength
aligned participation
aligned flow
stable state
acceptable failure risk
valid score
Until then, the best trade may be no trade.
Disclaimer:
This publication is for educational and workflow demonstration purposes only. It is not financial advice, not a buy/sell recommendation, and not a profit claim. The Trap Panel is designed to support structured decision-making and execution discipline. Education 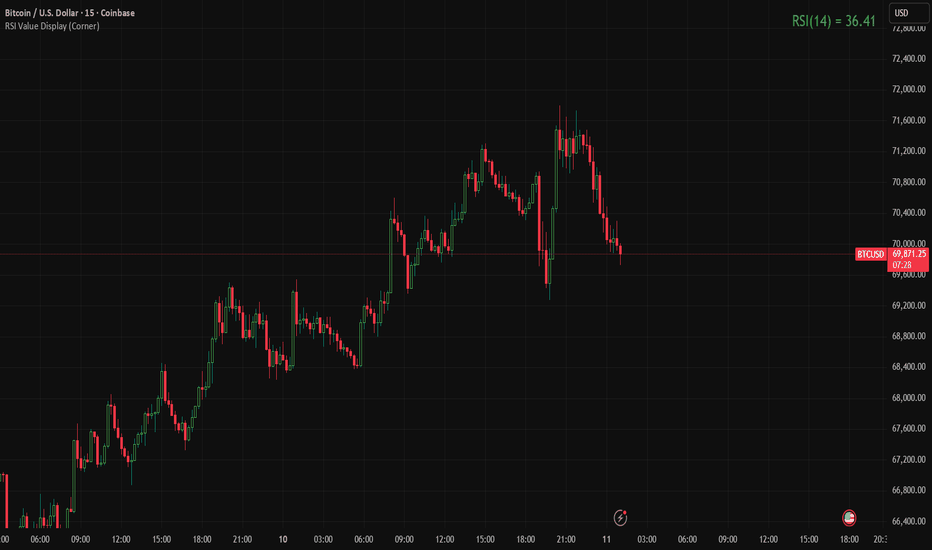

 Long
Long