Short
Short
Trading Roadmap | ClassTradical TA · Lesson 11 — Core IndicatorsLesson 11 - Core Indicators (RSI, MACD, Stochastic, Bollinger Bands)
Difficulty: Intermediate
The indicators on your chart are built from the same price data you already see. The four covered here are among the most widely followed in technical analysis — knowing how to read them can add useful context to your setups.
🔵 WHAT INDICATORS ACTUALLY DO
An indicator does not see the future — it reorganizes past price (and sometimes volume) into a different visual form. That can make certain conditions easier to spot: fading momentum, stretched moves, or quiet periods before expansion.
Two useful categories to keep in mind:
- Oscillators (RSI, Stochastic) — move between fixed bounds; often more useful in ranging markets
- Trend/momentum tools (MACD, Bollinger Bands) — follow price openly; often more useful for reading trend strength and volatility
No indicator needs to be traded on its own. Most experienced traders use them as context on top of the structure you learned in earlier lessons.
🔵 RSI — RELATIVE STRENGTH INDEX
RSI measures the speed of recent price changes on a 0–100 scale.
- Above 70 → often described as overbought (momentum stretched to the upside)
- Below 30 → often described as oversold (momentum stretched to the downside)
Important nuance: in a strong trend, RSI can stay overbought or oversold for a long time. A high reading alone is not a sell signal.
One of the more widely watched RSI signals is divergence — price makes a new high while RSI makes a lower high (or the reverse at lows). This can suggest momentum is fading, especially when confirmed by a reversal pattern from Lesson 7.
🔵 MACD — MOVING AVERAGE CONVERGENCE DIVERGENCE
MACD builds directly on the moving averages from Lesson 10. It shows the relationship between a faster and a slower average of price, plus a signal line and a histogram.
Common ways traders read it:
- MACD line crossing the signal line — can indicate a shift in short-term momentum
- Histogram shrinking — the current push may be losing strength
- MACD crossing the zero line — often read as a broader momentum shift
Because MACD is built from moving averages, it lags by design. It tends to work better for confirming momentum than for picking exact tops and bottoms.
🔵 STOCHASTIC OSCILLATOR
The Stochastic compares the latest close to the recent high–low range: readings near 100 mean price is closing near the top of its recent range, near 0 means the bottom.
- Above 80 / below 20 → commonly used overbought/oversold zones
- %K crossing %D inside those zones → a frequently watched trigger
Stochastic tends to shine in sideways markets, where price rotates between support and resistance (Lesson 3). In strong trends it can stay pinned at extremes, so many traders only take its signals in the direction of the larger trend.
🔵 BOLLINGER BANDS
Bollinger Bands wrap a moving average with an upper and lower band that expand and contract with volatility.
- Wide bands → volatile conditions
- Narrow bands (the "squeeze") → quiet conditions that often precede expansion — direction unknown until price shows its hand
- Band walk → in strong trends, price can ride along one band for extended periods; touching a band is not by itself a reversal signal
A squeeze followed by a decisive close outside the bands, supported by volume (Lesson 9), is one of the more commonly watched volatility setups.
In the chart above: notice how the bands tightened in late December while price moved sideways — quiet conditions. The expansion arrived in late January with a strong break to the downside. The squeeze suggested a bigger move may be building, but the direction only became clear once the break happened.
🔵 COMBINING THEM WITHOUT CLUTTER
More indicators does not mean more clarity. A practical approach:
- Pick at most one oscillator and one trend/volatility tool
- Let structure lead: levels, trend, and volume first — indicators as confirmation
- Avoid stacking indicators that measure the same thing (RSI + Stochastic together mostly repeat each other)
🔵 COMMON MISTAKES
- Selling just because RSI is above 70 in a strong uptrend
- Taking every MACD crossover in a ranging market, where whipsaws are frequent
- Treating a Bollinger Band touch as an automatic reversal signal
- Loading five indicators and losing sight of price itself
🐳 PRO TIPS
- Divergence signals often carry more weight on higher timeframes — a 4H or daily divergence tends to matter more than a 5-minute one.
- When an oscillator signal appears at a level you already marked (Lesson 3) inside a clear trend (Lesson 2), the context is doing most of the work — the indicator is just the trigger.
- Try removing all indicators for a week and trading structure only, then add one back. Many traders find this reveals which tool actually helps them.
- Default settings (RSI 14, MACD 12/26/9, Stochastic 14/3/3, BB 20/2) are a starting point — consistency matters more than optimization.
If this lesson helped you, drop a comment with the indicator you rely on most — and let us know which topic you want covered next. 🐳
Full Trading Roadmap | Classical TA Course
Trading Roadmap | Classical TA · Lesson 01 — Mastering the Chart
Trading Roadmap | Classical TA · Lesson 02 — Mastering Trends
Trading Roadmap | Classical TA · Lesson 03 — Support & Resistance
Trading Roadmap | Classical TA · Lesson 04 — Price Channels
Trading Roadmap | Classical TA · Lesson 05 — Single Candle Patterns
Trading Roadmap | Classical TA · Lesson 06 — Multi-Candle Patterns
Trading Roadmap | Classical TA · Lesson 07 — Reversal Chart Patterns
Trading Roadmap | Classical TA · Lesson 08 — Continuation Chart Patterns
Trading Roadmap | Classical TA · Lesson 09 — Volume Analysis
Trading Roadmap | Classical TA · Lesson 10 — Moving Averages
Best Regards, BigBeluga 🐳 Education 
The Trade You Almost TookYou saw the setup. The level made sense, the risk was clear, and your analysis pointed in one direction.
But you waited.
Maybe you wanted one more confirmation. Maybe you hesitated for a few seconds. Maybe you simply looked away at the wrong moment.
Then price moved exactly as you expected.
You never entered the trade, so technically you lost nothing. But mentally, it doesn't always feel that way. You start calculating the profit you "could have made," replaying the entry in your head, and wondering why you didn't trust yourself.
The trade is gone. Yet somehow, you're still trading it.
1. A Missed Trade Can Feel Like a Real Loss
Your account balance hasn't changed, but your mind may already be counting imaginary profit. You think about the entry you almost took and calculate how much the move would have paid.
That's where the problem begins: You start emotionally reacting to money that was never actually yours. A missed opportunity slowly starts feeling like something the market took away from you.
2. The "I Knew It" Trap
When price follows your original analysis, confidence can quickly turn into frustration. You tell yourself: "I knew this was going to happen."
But knowing a possible direction and executing a trade are two different skills. After the move becomes obvious, it's easy to forget the uncertainty you felt before it started.
3. The Next Setup Suddenly Looks Better
After missing a strong move, traders often become less selective. An average setup appears, but because you don't want to miss another trade, it feels more attractive than it normally would.
The setup hasn't improved: Your standards have simply dropped. You're no longer judging the opportunity alone. You're comparing it with the trade you just missed.
4. You Start Chasing a Trade That Is Already Over
Sometimes traders enter late into the same move, even when the original entry and risk-to-reward are gone. The thought is simple: "There must still be some movement left."
At that point, you're not following the original plan anymore. You're trying to participate in a story that has already started without you.
5. Missed Profit Is Not Lost Money
This sounds obvious, but traders often forget it in the moment. You cannot lose profit from a position you never opened.
The market didn't take anything from you. Your mind created an expected reward, mentally added it to your account, and then felt disappointed when reality didn't match that imaginary result.
6. Don't Punish the Next Trade
The next setup has nothing to do with the opportunity you missed. It doesn't deserve a bigger position, a faster entry, or lower standards just because you're frustrated.
Ask yourself: "Would I take this trade if I hadn't seen the previous move?" If the answer is no, you're probably still reacting to the missed trade.
7. Let the Trade Leave Without You
Some trades will move perfectly without your position. That's part of trading. You will miss entries, hesitate, close charts too early, and occasionally watch your exact analysis play out from the sidelines.
Review why you missed it. If you broke a rule, learn from it. If you followed your process, accept it. Then let the trade go.
Conclusion:
The trade you almost took can be more dangerous than a losing trade because the damage isn't visible on your P&L. It appears in the decisions that come after it: The rushed entry, the forced setup, the oversized position, or the trade you chase because you don't want to miss twice.
A missed trade is not a debt the market owes you.
Remember: The opportunity is over. Your next decision doesn't have to pay for it. Education 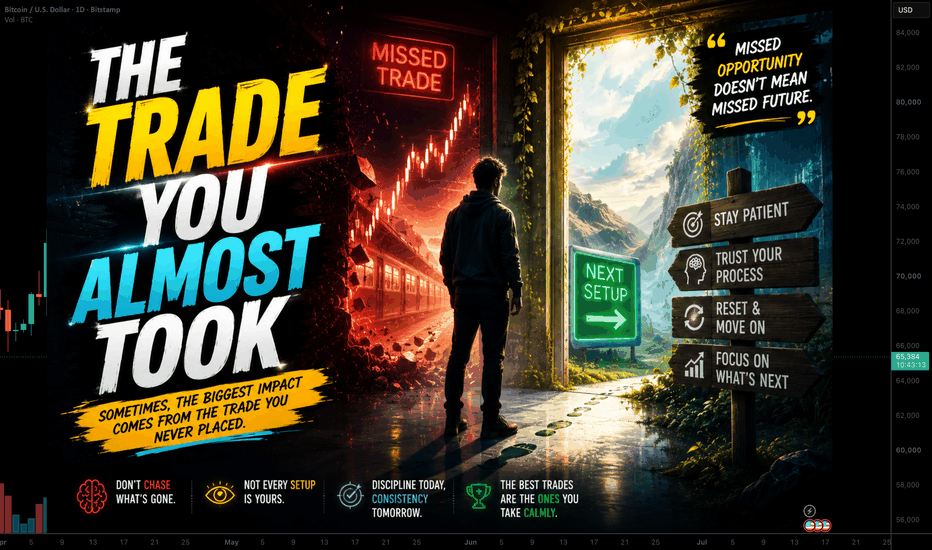
 Long
Long
 Long
Long
Short 
Education

Short 
Short 
 Long
Long
Log vs Linear: Why Your "Broken" Support Never Actually BrokeLog vs Linear: Why Your "Broken" Support Never Actually Broke
LOG vs LINEAR: THE ADVANCED BREAKDOWN
(Premium Edition - for traders who actually draw levels for a living)
Most people treat this as a cosmetic toggle. It isn't. Your scale choice silently changes your trendlines, your Fibs, your moving averages, and your backtest results. Here's the deep version. 👇
🔰 THE CORE MATH:
🔹 Linear scale: equal vertical distance = equal absolute price change (Δ$).
🔹 Log scale: equal vertical distance = equal proportional change (Δ ln P).
On a log chart, a straight line is not constant price growth, it is constant percentage growth. A rising straight line on log = compounding at a fixed rate. That single fact is why log is the natural home for any asset with exponential history.
Crypto is the most exponential asset class in existence. CRYPTOCAP:BTC has moved roughly 8 orders of magnitude. Displaying that on linear is a rendering error, not analysis.
🔰 WHERE LOG IS NON-NEGOTIABLE
✔️ HTF structure - Weekly, Monthly, and multi-cycle views
✔️ Long-term trendlines and channels (semi-log channels only)
✔️ Power law / log regression bands, rainbow models, diminishing returns curves
✔️ Cycle-to-cycle comparison: 2013 vs 2017 vs 2021 vs 2024–25 tops
✔️ Ratio charts (ETH/BTC, TOTAL2/BTC.D, alt/BTC pairs): ratios are inherently multiplicative
✔️ Any asset with 10x+ range on screen: majors, low-caps, memecoins
✔️ Comparative performance overlays between two assets with different price magnitudes
⚠️ The Trap: a multi-year trendline that reads as a clean breakdown on linear is frequently untouched on log. Every cycle, a chunk of the market capitulates into a support that never actually broke. Check the log view before you post a breakdown call.
🔰 WHERE LINEAR IS THE CORRECT TOOL
✔️ Execution timeframes: 1m through 4H
✔️ Order Blocks, FVGs, breaker blocks, liquidity pools, equal highs/lows
✔️ Precise entry, invalidation, and R:R measurement
✔️ Range-bound and compressed price action
✔️ Anything where your position sizing is denominated in absolute dollar risk
✔️ Volume profile, VWAP, market profile studies
Rationale: within a narrow range, ln(P) is approximately linear, the two scales converge and linear gives you cleaner, more auditable measurement.
🔰 THE PART ALMOST NOBODY TALKS ABOUT
1️⃣ Fibonacci levels change:
A 0.618 retracement on linear is not the same price as a 0.618 on log. Log Fibs compute the retracement in percentage space. On a 5x impulse the difference between the two can be double-digit percentages. If you swing trade off Fibs across large moves, you must decide which one is your system and never switch mid-analysis.
2️⃣ Moving averages are linear objects:
An SMA/EMA is computed on price, not on log-price. So on a log chart the MA is still a linear-space calculation being rendered in log space. It is not "wrong," but do not treat an MA slope on log as a growth-rate line the way you would a semi-log trendline.
3️⃣ Pattern geometry warps:
Wedges, triangles, and channels are geometric shapes. Change the scale, change the geometry. A "rising wedge" on linear can render as a clean parallel channel on log. Both readings cannot be right. Choose your reference frame first, then read the pattern.
4️⃣ Volatility is proportional, not absolute:
Crypto returns are far closer to log-normal than normal. Your risk model should think in percentage terms (ATR%, standard deviation of log returns), not raw dollar swings. Log charting is the visual expression of the same idea.
5️⃣ Backtests inherit the scale:
If you draw your levels on log and backtest on linear, you are testing a different strategy than the one you traded. Reproducibility dies here.
🔰 THE OPERATING FRAMEWORK
➡️ LOG for BIAS: cycle position, HTF trend, long-term structure, ratio analysis, valuation models
➡️ LINEAR for EXECUTION: LTF structure, entries, stops, targets, sizing
Zoom out in log space. Zoom in in linear space. Never let the two contaminate each other in a single thesis.
🔰 THE DISCIPLINE RULE:
A trendline drawn on log and a trendline drawn on linear are two different objects. So are the Fibs, the channels, and the patterns built on them.
Therefore:
→ Declare your scale before you draw
→ Keep it fixed across the entire analysis
→ Label the scale on every chart you publish
→ If your level only holds on one scale, that is information, say so out loud
Analysts who don't state their scale are not publishing a level. They are publishing a picture.
🔰 CryptoPatel Note: Log is the true coordinate system of an exponential asset. Linear is the coordinate system of a trade. Professionals use both and they never confuse which one they are standing in.
Save this one.  Long
Long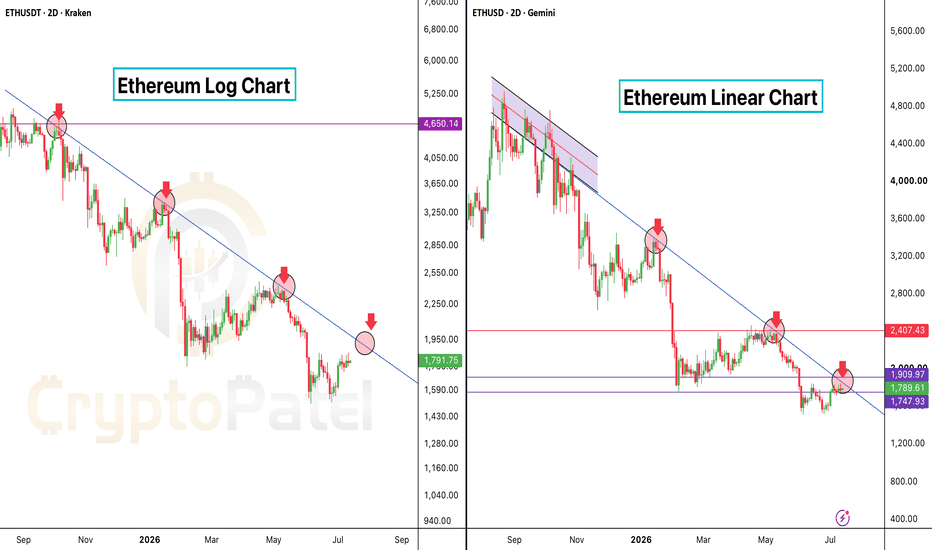
Short 
Short 
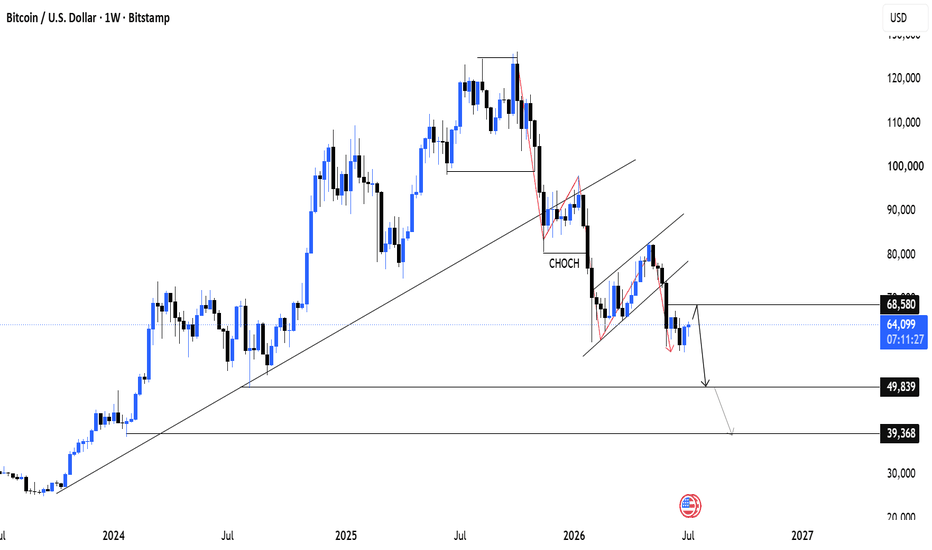
Bitcoin Remains Bearish Below $64K–$66K Despite Modest ReboundBitcoin has rebounded modestly from its July 1 low, while Ethereum has shown relative strength by avoiding a new July low.
However, Bitcoin continues to form lower highs and lower lows, keeping the broader trend bearish. The recent sideways action looks more like consolidation than a confirmed recovery.
Key Trading Levels
Resistance: $64,000–$66,000
Support: $53,000–$56,000
Downside Target: $40,000–$45,000
Outlook: Bearish to sideways
Bitcoin remains bearish unless it can reclaim and hold above $66,000. Your Trading Brain Has a Daily LimitMost traders manage their capital carefully, but almost nobody thinks about managing their mental energy. From the moment you open the charts, your brain starts making decisions: Which market should I watch? Is this a setup? Should I enter? Should I wait? Should I exit?
One decision doesn't feel exhausting. But after hours of charts, alerts, news, and constant price checking, your judgment can become less sharp. You may still feel focused, but your decisions can slowly become more impulsive. Think of it as a mental trading budget: The more carelessly you spend it, the less clarity you may have later.
1. Every Decision Has a Mental Cost
Trading involves a constant stream of small choices. Timeframes, entries, stop-losses, position sizes, targets: Your brain is continuously processing information.
The problem begins when unnecessary decisions consume your attention. Watching ten markets and twenty setups doesn't always create more opportunities. Sometimes, it simply creates more noise.
2. Your First Trade and Fifth Trade May Feel Different
At the beginning of a session, you may follow your checklist carefully. After several hours and multiple trades, skipping one rule can suddenly feel harmless.
The strategy hasn't changed: Your decision-making state has. This is why judging every trade only by the chart can be misleading. Your mental condition matters too.
3. More Screen Time Doesn't Always Mean Better Analysis
There is a point where studying the chart turns into staring at the chart. Traders often believe that if they watch long enough, another opportunity will appear.
Instead, excessive monitoring can tempt you to create setups that weren't obvious before. When you're desperate to find a trade, normal price movement starts looking like a signal.
4. Decision Fatigue Can Look Like Confidence
Poor decisions don't always feel emotional. Sometimes they sound surprisingly confident: "I know this will reverse" or "I'll enter now and manage it later."
That's what makes mental fatigue dangerous. You may stop questioning yourself at exactly the moment when you should be checking your process more carefully.
5. Protect Your Best Decision-Making Hours
Pay attention to when you trade with the most clarity. Some traders perform better early in their session, while others need time before they feel focused.
Ask yourself: "When do I usually break my rules?" If most of your impulsive trades happen after hours of screen time or several previous decisions, that pattern deserves attention.
6. Create a Daily Decision Limit
You don't need to analyze every market or take every setup. Reduce unnecessary choices: Build a watchlist, define your trading hours, and use a simple pre-trade checklist.
The goal is not to avoid thinking. The goal is to save your attention for decisions that actually involve risk.
7. Know When Your Brain Is Done Trading
Sometimes the chart is still open, but mentally, your trading session is already over. You're rereading the same levels, switching timeframes repeatedly, or searching for confirmation of what you already want to do.
Recognizing that moment is a trading skill. Closing the chart can protect your capital just as effectively as a stop-loss.
Conclusion:
Your trading account has limited capital, and your mind has limited attention. Traders usually protect the first while carelessly exhausting the second.
You don't need unlimited focus to trade well. You need to recognize when your decision quality is dropping and have the discipline to stop before mental fatigue starts making decisions for you.
Remember: Your next bad trade may not come from a bad strategy. It may simply come from a tired decision-maker. Education 
Every Trader Is a Piece in the GameIf the Market Were a Chess Game: (From my weekend thoughts)
When people think about trading, they often imagine numbers, charts, and indicators. But what if the market could be explained through a game that has existed for centuries? Chess and trading have more in common than most people realize. Neither game is won by making random moves or reacting emotionally. Success comes from patience, planning, and thinking several steps ahead. Every move has a purpose, every mistake has a consequence, and every decision changes the position of the game.
The Board:
Every chess match begins with the same board, but no two games are ever identical. Trading works in much the same way. Every trader looks at the same chart, yet everyone sees different opportunities. Support and resistance, trends, and important price levels become the squares where the battle between buyers and sellers takes place. Before a grandmaster makes a move, they study the entire board. Similarly, successful traders study the market before placing a trade instead of reacting to every candle they see.
The Pawns:
In chess, pawns are the most common pieces. Individually they are weak, but together they control space and influence the entire game. Retail traders often play a similar role in the market. Many buy after a breakout, panic during pullbacks, or place stop losses in obvious locations. On their own, these decisions may seem insignificant, but together they create the liquidity that drives the market. Without pawns, chess cannot be played. Without retail traders, financial markets would not have the same flow of orders.
The Queen:
The queen is the strongest piece on the chessboard. It can move in almost any direction and is often responsible for controlling the game. In trading, large institutions, banks, and hedge funds play a similar role. They have more capital, more information, and greater influence than individual traders. They do not enter trades based on emotions or simple indicators. Instead, they plan their moves carefully, looking for areas where enough liquidity exists to execute large orders. While retail traders often react to price, institutions are capable of creating the moves that everyone else reacts to.
Board Control:
One of the biggest mistakes beginners make in chess is focusing only on capturing pieces. Experienced players know that controlling the board is far more important than winning a single exchange. Trading follows the same principle. Many new traders spend their time trying to predict every reversal, while experienced traders focus on trading in the direction of the trend. A strong trend represents control. During an uptrend, buyers dominate the market. During a downtrend, sellers are in control. Trading against that control is often like attacking a well-defended king with only a single pawn.
Sacrifice:
Every great chess player understands that sometimes giving up a piece leads to a much greater advantage later in the game. The same idea exists in trading. Professional traders never expect to win every trade. They accept small losses because they understand that protecting their capital is more important than protecting their ego. A controlled loss is simply the cost of staying in the game. The traders who refuse to accept small losses often end up facing much larger ones.
Checkmate:
The ultimate goal in chess is not to capture every piece but to put your opponent in a position where no escape is possible. In trading, liquidity often plays a similar role. Price frequently moves toward areas where large numbers of stop losses and pending orders are placed. Many traders believe the market is hunting their stop loss, but in reality, it is searching for enough orders to fuel the next move. Once that liquidity has been collected, the market often continues in its intended direction.
What I think is...
Trading and chess share one important lesson. The winner is rarely the person who acts the fastest. It is usually the person who understands the position better than everyone else. Both reward patience over excitement, planning over guessing, and discipline over emotion. The next time you open a chart, imagine you are sitting in front of a chessboard. Instead of asking where price will go next, ask yourself one simple question.
Who controls the board right now?
That single question may change the way you look at the market forever.
By @BrightRally_Research on @TradingView
Education 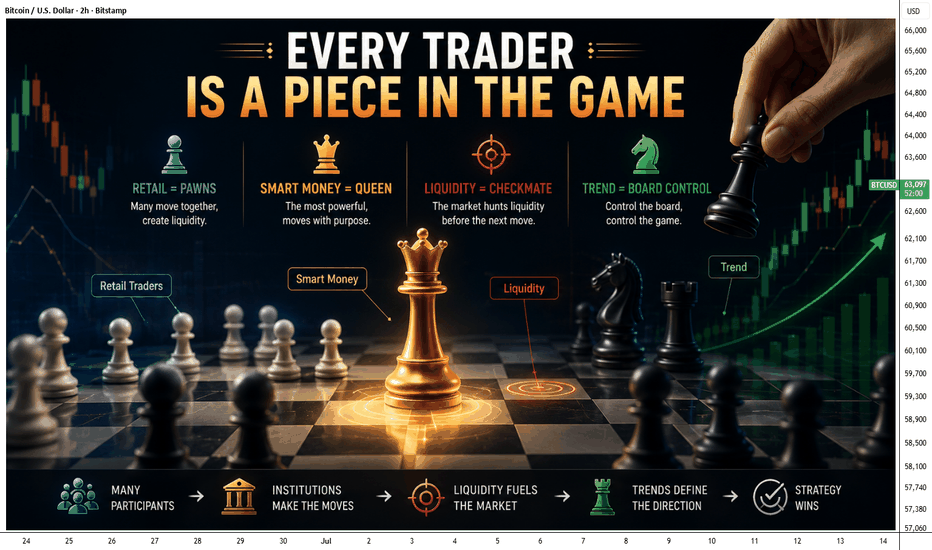
 Long
Long
Bitcoin Consolidation Phase: Mapping the Next MoveKey Support and Resistance Levels
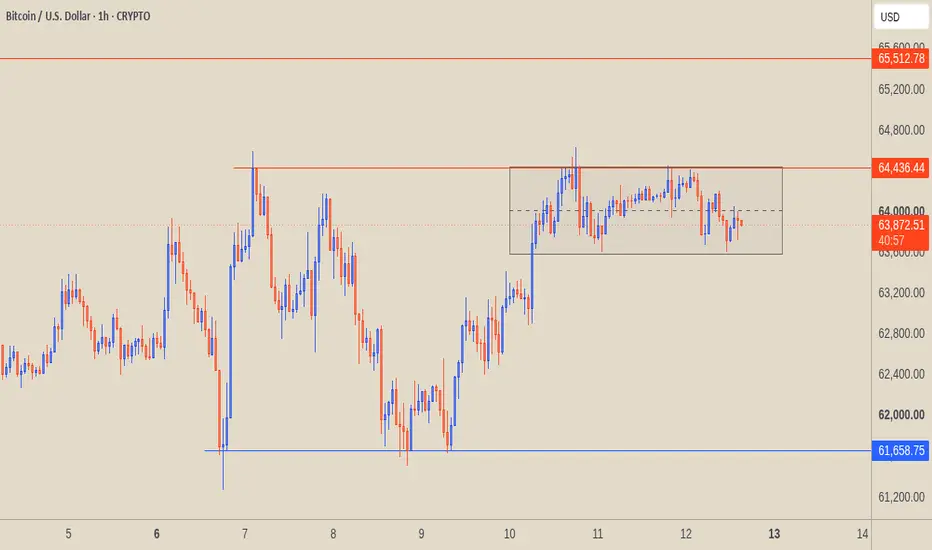
Major Support (Blue Line - 61,658.75): This is a critical structural low. The price saw a sharp rejection (long lower wick) at this level around the 6th/7th, establishing it as a strong demand zone. A subsequent higher low formed around the 9th, confirming this blue line as the foundational support for the current market structure.
Immediate Resistance (Lower Red Line - 64,436.44): This level previously acted as a local top. The price rallied aggressively from the lows to test this pivot, but was rejected, turning this line into a clear ceiling for the current price action.
Major Target Resistance (Upper Red Line - 65,512.78): If the bullish structure continues and breaks current resistance, this upper pivot serves as the next major structural target and liquidity zone.
Consolidation Box Analysis
The shaded rectangle highlights a distinct period of range-bound price action following the recent impulsive move upward.
Range Dynamics: The market is currently in a "choppy" sideways phase, digesting the recent gains. The box maps the boundaries of this consolidation, with the top anchored precisely at the 64,436.44 resistance level and the bottom near 63,600.00.
Equilibrium (Dashed Midline): The dashed line in the center of the box (around 64,000) represents the mean of this value area.
Current Price Action: The price (63,872.07) is currently hovering just below this dashed midline. This indicates slight local weakness within the range, as bears are defending the upper half of the box, pushing the price toward the lower boundary.
Structural Outlook
The current structure is a classic consolidation pattern following a strong bounce from major support. The next directional bias depends heavily on how the price interacts with the boundaries of the drawn box:
Bullish Breakout Scenario: A decisive 1h candle close above the top of the box (64,436.44) would confirm a continuation of the bullish market structure. This would likely trigger upward momentum toward the next major pivot at 65,512.78.
Bearish Breakdown Scenario: If the price loses the bottom of the box (around 63,600.00), the consolidation fails. This would signal a deeper retracement, likely sweeping liquidity lower to test the mid-62,000s or eventually retesting the ultimate major support at 61,658.75. Short 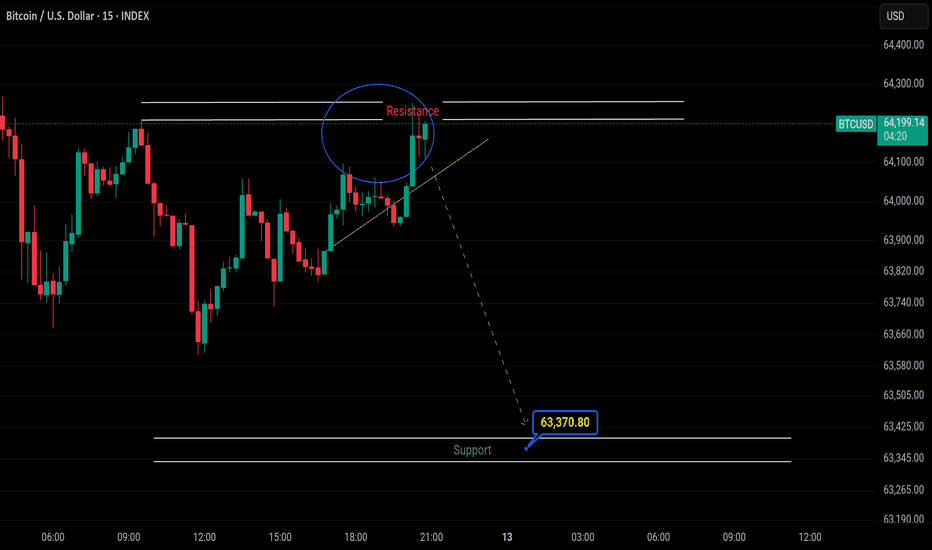
Short 
Long 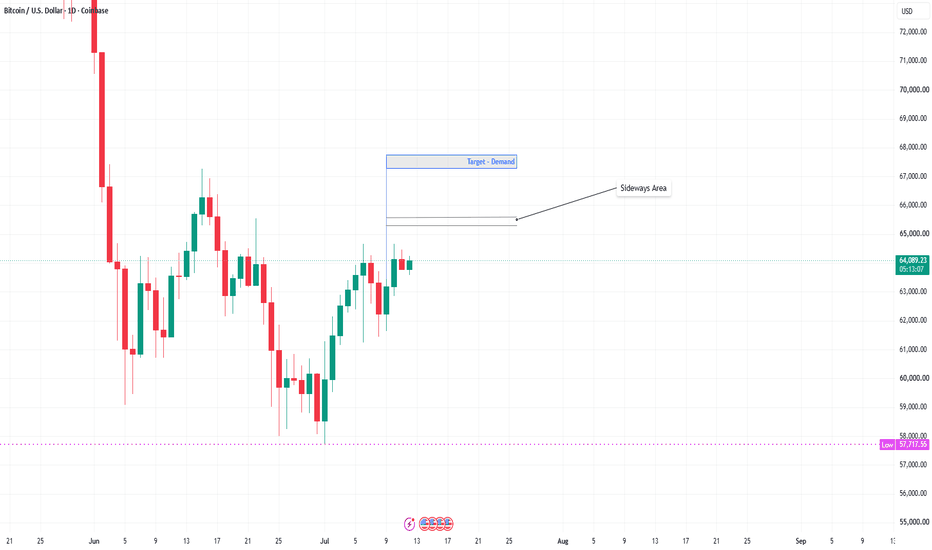
Short