SOMETHING DOESN'T LOOK RIGHT IN GOLD... HERE'S WHY!Overall, Gold is simply moving sideways and killing time because today is the last trading day of the week. At the same time, the market has already created a lot of confusion among retail traders. Many people are wondering whether Gold is actually bullish or bearish.
If you want to stay away from that confusion, make sure you read this psychological market analysis carefully. It will help you understand today's (Friday's) trading plan as well as the overall outlook for the coming sessions, allowing you to trade with much more confidence.
Over the last two days, we witnessed exactly the bullish move that we were expecting. The strong support zones that I mentioned also worked perfectly. First of all, I hope this week's analysis has been helpful for all of you.
On Wednesday, when the market dropped sharply, many random sellers got trapped. However, traders who respect proper price action were patiently waiting for a retracement before entering short positions. Yesterday (Thursday), the market repeatedly tried to invite those sellers into the trade, but once again many of them got trapped.
The reason behind this was pure market psychology, which I clearly explained in my previous analysis. Sometimes the market doesn't respect traditional price action because it enters a manipulation phase. During those periods, understanding market psychology becomes far more important than simply following textbook price action.
My plan for Friday is very simple.
As long as Gold does not close above $4,128, buying aggressively becomes a little difficult. Yes, I am still bullish overall, and there is absolutely no doubt about that. However, considering the current price behaviour, entering fresh buy positions too early could be risky because the market may first trap buyers.
I believe Gold could continue moving in a zigzag pattern and revisit the $4,100 area before making its next move. This is because $4,100 is an extremely important psychological level.
Just like last week when Gold was trading around $4,000, the market repeatedly trapped both buyers and sellers around that major round number. I expect very similar price behaviour around $4,100 this week as well.
That is why I would suggest trading carefully on Friday.
Overall, as long as Gold remains above $4,086-$4,092, I remain strongly bullish. Keep this level in mind. I have already marked two green demand zones on the chart where we can look for buying opportunities with proper confirmation.
The moment Gold manages to close above $4,128, I believe we could see a strong bullish continuation that has the potential to push price directly toward $4,166.
So, to keep it simple, I am still bullish on Gold. I have repeatedly pointed out that $4,086 is a very important institutional key level. As long as the market continues trading above it, my overall bias remains Buy on Dips.
The only reason we are experiencing some uncertainty right now is because Gold is trading very close to the important $4,100 psychological level. Keep that in mind and try to understand how Smart Money operates before planning your trades.
I hope all of you enjoyed this analysis.
Good luck for the last trading day of the week! I hope my analysis helped you throughout the week and that everyone finishes the week with profitable trades.
What is your trading plan for Gold today?
Let me know in the comments!
XAUUSD: Sellers Still Own 4,085 XAUUSD: Sellers Still Own 4,085
Market Context
Gold is trading around 4,062 after losing short-term momentum again. The market is still leaning bearish, and the latest reaction shows that buyers are not strong enough to reclaim structure yet.
The softer gold price in INR also reflects short-term pressure in the broader gold market. When gold weakens across local pricing and XAUUSD remains below resistance, it tells us one thing clearly: buyers are still reacting, but sellers are still controlling the story.
Technical Structure
Gold remains in a short-term downward trend after repeated BOS and CHOCH signals. Price is currently sitting below the 4,085 sell zone, which is the nearest level sellers are likely to defend.
The key downside trigger is 4,041. If price loses this near-liquidity area, the next move may open toward 4,014, which is the main intraday target.
The deeper support is around 3,972. This is the stronger support area if selling pressure continues and price extends below the main target.
Above the current price, 4,085 is the decision zone. As long as gold stays below this level, the bearish view remains stronger. A clean reclaim above 4,085 would be the first warning that buyers are trying to shift the structure.
Key Levels
Current Price: 4,062
Nearest Sell Zone: 4,085
Near Liquidity: 4,041
Main Target: 4,014
Deep Support: 3,972
Pullback Sell Zone: 4,120 - 4,135
Major Supply: 4,170 - 4,200
Bullish Confirmation: Above 4,085
Bearish Continuation: Below 4,041
Trading Plan
Sell Scenario: Rejection From 4,085
Entry: 4,080 - 4,085 after bearish confirmation
Stop Loss: Above 4,105
TP1: 4,041
TP2: 4,014
TP3: 3,972
Conditions: Price must rebound into the 4,080 - 4,085 sell zone and fail to break higher. Bearish rejection should appear near resistance. Buyers must lose momentum, and price should remain below 4,085. This remains the priority setup while the short-term structure stays weak.
Sell Continuation Scenario
Entry: Below 4,041 after confirmed breakdown and retest
Stop Loss: Above 4,065
TP1: 4,014
TP2: 3,990
TP3: 3,972
Conditions: Price breaks below the near-liquidity level at 4,041, retest fails, and bearish momentum continues. This would confirm that sellers are extending the move toward the main target.
Buy Scenario: Reclaim Above 4,085
Entry: Above 4,085 after breakout and retest
Stop Loss: Below 4,041
TP1: 4,120
TP2: 4,135
TP3: 4,170
Conditions: Price must reclaim 4,085 with strength, hold the retest, and form a clear bullish CHOCH. Without this confirmation, buying remains risky because price is still trading under seller control.
Alternative Sell Scenario: Sell From Higher Supply
Entry: 4,120 - 4,135 after bearish confirmation
Stop Loss: Above 4,160
TP1: 4,085
TP2: 4,041
TP3: 4,014
Conditions: Price recovers into the pullback sell zone but fails to hold above it. Strong rejection from this area would confirm that sellers are still defending the broader bearish structure.
Overall Bias
Gold is still weak below 4,085. The current bounce does not confirm a bullish reversal yet.
If price rejects from 4,080 - 4,085, the downside path toward 4,041 and 4,014 remains open. If 4,041 breaks, sellers may push deeper toward 3,972.
Best approach: wait for reaction at 4,085 or confirmation below 4,041. Do not chase buys while price is still under the sell zone.
Will gold reclaim 4,085, or will sellers push price straight toward 4,014?
 Short
Short
MASON XAUUSD – Bullish Pullback Before Mid-Term Rally
XAUUSD is trading around 4,123 after recovering from the short-term correction zone. Price is still holding above the main uptrend trendline, while the current pullback is moving around the Fibonacci reaction area.
The priority view remains bullish in the medium term, as long as gold continues to hold above the buy order zone and the rising trendline support.
Technical View
Gold is still moving inside a bullish recovery structure. The higher low formation from the previous support area shows that buyers are still defending the market, even though price is currently correcting below the short-term descending trendline.
The most important point on this chart is the uptrend trendline. Price has respected this trendline several times, which means the broader bullish structure remains valid while gold stays above it.
The 4,101–4,106 area is the main buy order zone. This zone is important because it aligns with the Fibonacci correction area, the rising trendline support, and the previous reaction zone. If gold pulls back into this area and holds, it may confirm another higher low before the next bullish leg.
Short term, price may still face resistance around 4,138 and 4,159. The 4,159 area is marked as a sell order zone, so some rejection or consolidation may appear there first. However, if gold breaks and holds above 4,159, the bullish structure may open a stronger move toward the 4,203 resistance.
Ichimoku also supports the idea that the market is trying to recover. Price has moved back near the Ichimoku structure, and if buyers can keep price above the cloud support, the next medium-term bullish continuation will become more convincing.
Key Zones
Current price: 4,123
Buy order zone: 4,101–4,106
Trendline support: 4,095–4,106
Short-term resistance: 4,138
Sell order reaction zone: 4,159
Major resistance: 4,203
Ichimoku support area: 4,067–4,101
Invalidation: below 4,067
Trading Plan
Buy Priority: 4,101–4,106
Condition: wait for bullish rejection, higher low formation, or price holding above the uptrend trendline and Fibonacci support area.
SL: below 4,067
TP1: 4,138
TP2: 4,159
TP3: 4,203
Alternative Scenario
If gold breaks above 4,159 directly, wait for a retest of this zone as support before looking for buy continuation toward 4,203. A clean hold above 4,159 would confirm stronger bullish momentum for the medium-term move.
Sell View
Sell is not the priority while price stays above the uptrend trendline and the 4,101–4,106 buy order zone. A short-term sell reaction may appear around 4,159, but it should only be treated as a correction unless gold breaks below 4,067.
Final View
Overall, gold remains in a bullish structure. The current movement looks more like a Fibonacci correction before continuation rather than a full bearish reversal. The cleaner plan is to wait for price to hold the 4,101–4,106 buy zone, then follow the next bullish leg toward 4,138, 4,159, and potentially 4,203.
Will gold respect the Fibonacci buy zone and start the next bullish leg, or retest the trendline support first?
Long 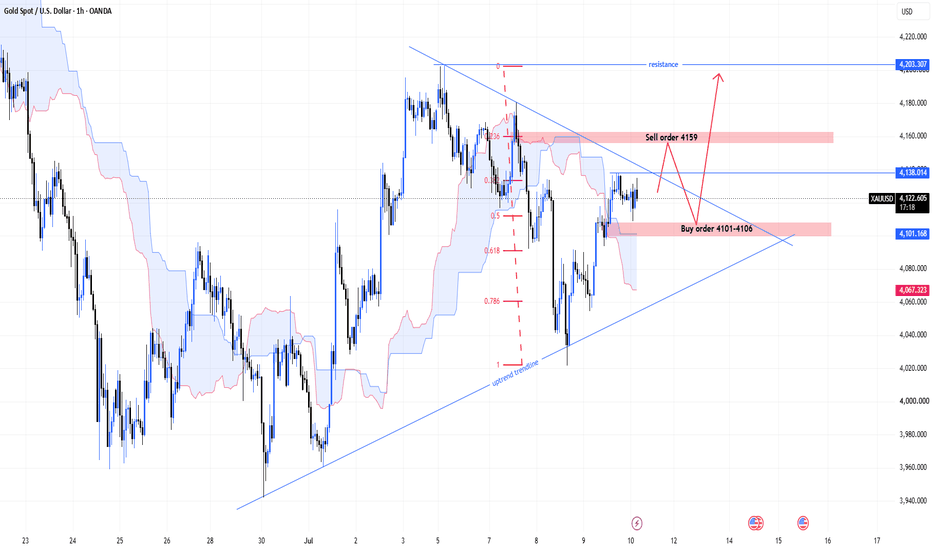
XAUUSD: Rebound to 4,193 May Be Just a Short-Term Bull TrapXAUUSD is holding above the short-term uptrend line near 4,130, leaving room for a potential rebound before sellers truly step back in. However, a strong supply zone lies overhead at 4,193–4,210, coinciding with a resistance area that has previously triggered price reversals.
With US yields remaining high and expectations of continued Fed tightening weighing on gold, the current rally lacks the basis to confirm a sustainable uptrend. The most likely scenario is a bounce from 4,130 to test the 4,193 zone, followed by profit-taking pressure.
Suggested Strategy:
Entry: Sell on rejection near 4,190–4,200
TP: 4,130
SL: Above 4,220 Short 
XAU/USD (Gold) 4H AnalysisGold remains in a short-term bullish market structure after recovering strongly from the recent sell-off. Price is currently trading below a well-defined major supply zone (4140–4145), where sellers have already defended the market once. A direct breakout is possible, but the higher-probability scenario is a pullback into demand before continuation.
The first demand zone (4055–4062) is the nearest area where buyers may step in. If this zone fails to hold, the strong demand zone (4020–4040) becomes the key level to watch for fresh buying interest. As long as price respects these demand areas and forms a bullish confirmation, the overall structure remains constructive.
A successful rebound from either demand zone could provide the momentum needed to retest the recent swing high around 4130 and challenge the 4140–4145 supply zone once again. A decisive breakout and close above this resistance would confirm bullish continuation and expose higher targets near 4160 and beyond.
However, if sellers push price below the strong demand zone, the bullish outlook would weaken, increasing the probability of a move toward the psychological support at 4000.
Key Levels
Resistance: 4130, 4140–4145, 4160
Support: 4055–4062, 4020–4040, 4000
Trading Idea: Wait for bullish confirmation from the highlighted demand zones before targeting a move back toward the major supply. Risk management remains essential, especially while price is trading below resistance.
🚨 This analysis is for educational purposes only and is not financial advice. Always wait for confirmation before entering a trade. Short 
Short 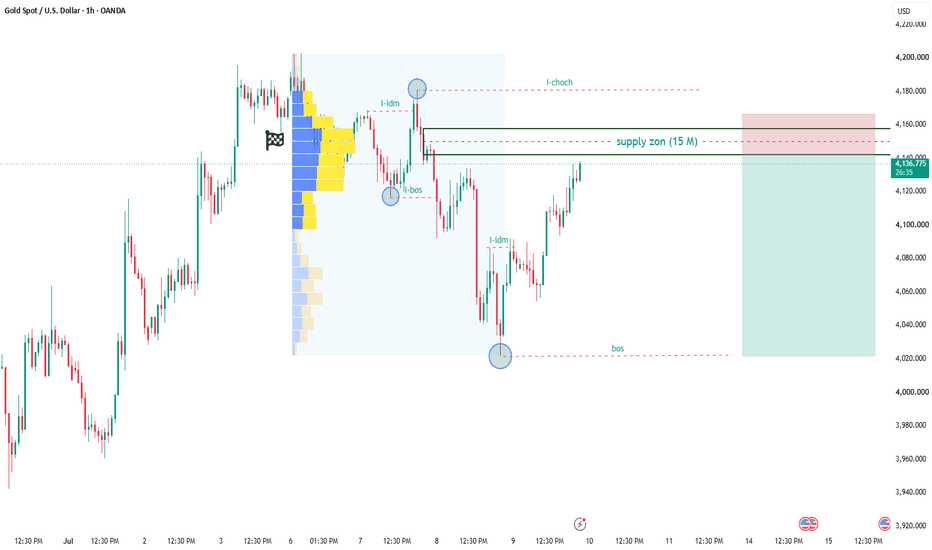
Short 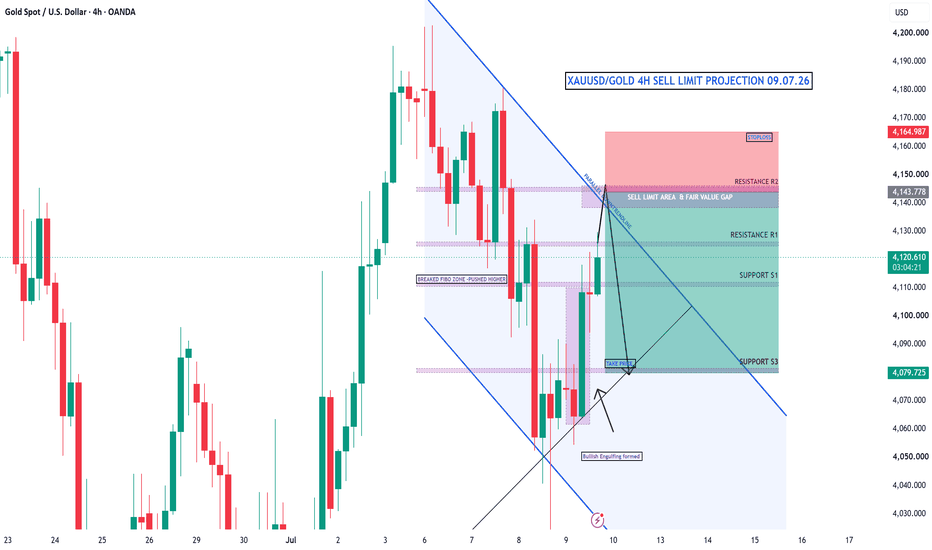
XAUUSD: Bulls Testing Key Breakout Zone | 📌 Symbol: XAUUSD / Gold
⏱️ Timeframe: 30-Minute
💰 Current Price: Around $4,126
Key View:
XAUUSD is showing a strong recovery from the lower support zone and is now trading near an important resistance area around $4,134.
Important Levels:
🟢 Support Zone: $4,108 - $4,100
🔴 Major Resistance: $4,134
🎯 Upside Targets: $4,180 / $4,203/ $4,250
⚠️ Breakdown Zone: Below $4,099
Technical Setup:
Price is moving inside an upward channel.
Gold has bounced strongly from the lower channel support.
RSI is near 70, showing strong bullish momentum but also slight overbought pressure.
A clean breakout above $4,134 can open the way toward $4,180-$4,203.
If price rejects from $4,134, a retest of $4,108-$4,100 is possible.
Bullish Scenario:
✅ If XAUUSD sustains above $4,134, buyers may push price toward $4,180 and then $4,203.
Bearish Scenario:
❌ If price fails to break $4,134 and falls below $4,100, weakness may continue toward $4,092.
Final View:
🔥 Gold is at a decisive level. Breakout above $4,134 can trigger strong upside momentum, while rejection may bring a short-term pullback. Wait for confirmation before entering.
Disclaimer: Educational analysis only. Trade with proper risk management Long 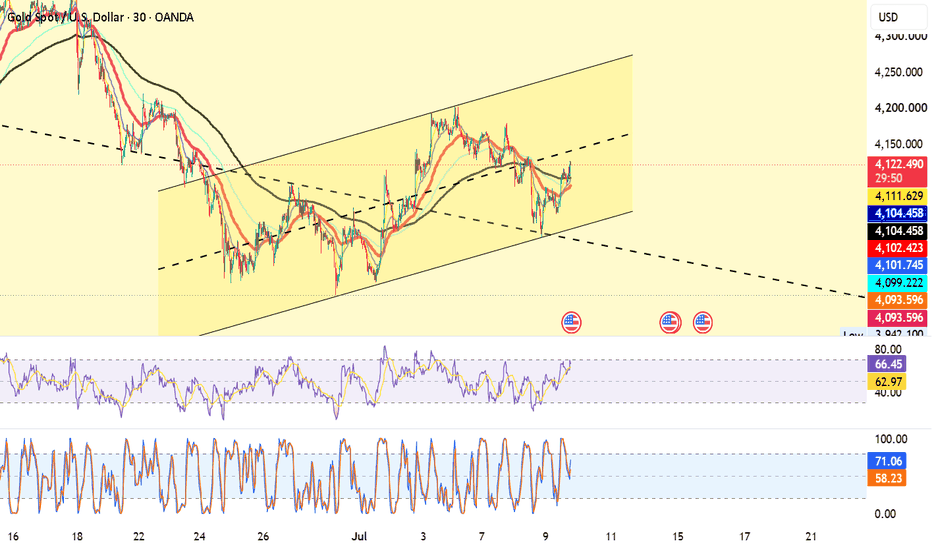
 Long
Long
XAUUSD 4H | Reversal Zone Waiting for ConfirmationGold is currently slowing down after completing a bearish supply move. The previous demand was fast, while the recent supply has been relatively slow, showing that sellers are gradually losing momentum.
According to my structure, the current supply has already completed its expected move, and now the market is approaching an important reversal zone.
At this stage, I am not looking for an immediate buy. I want to see proper confirmation first.
The ideal confirmation would be a liquidity sweep below the marked level or an After Effect move, followed by a strong bullish candle closing back above the marked line. If that happens, it will indicate that buyers are stepping back into the market.
Another important observation is that this bearish trend has been moving slowly, and several bearish candles have already failed to continue lower. That is often an early sign that selling pressure is weakening.
If the sweep and bullish confirmation appear inside the reversal zone, the market could deliver a Fast-Slow-Fast (FSF) move toward the upside.
For now, I am waiting for confirmation rather than predicting the move early. The reaction inside the reversal zone will decide whether buyers regain control or sellers continue the trend. Long 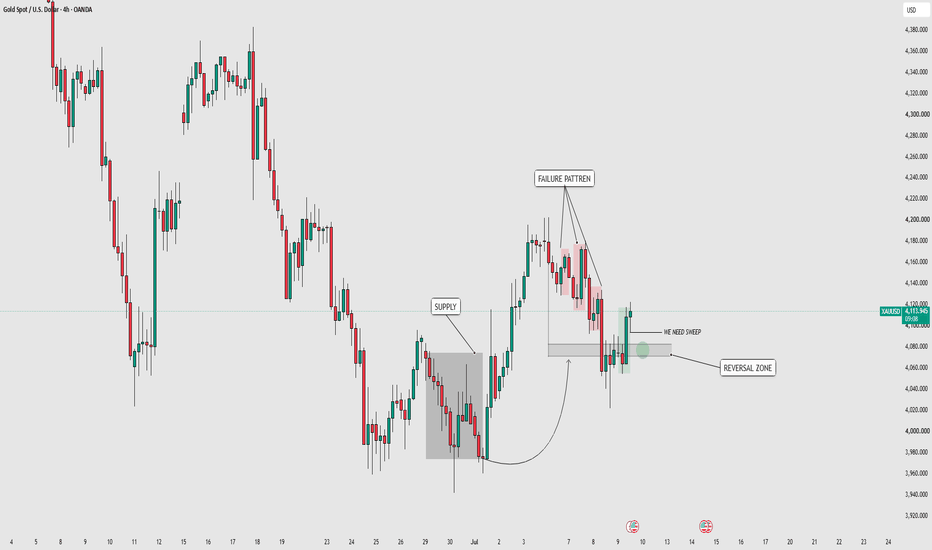
Short 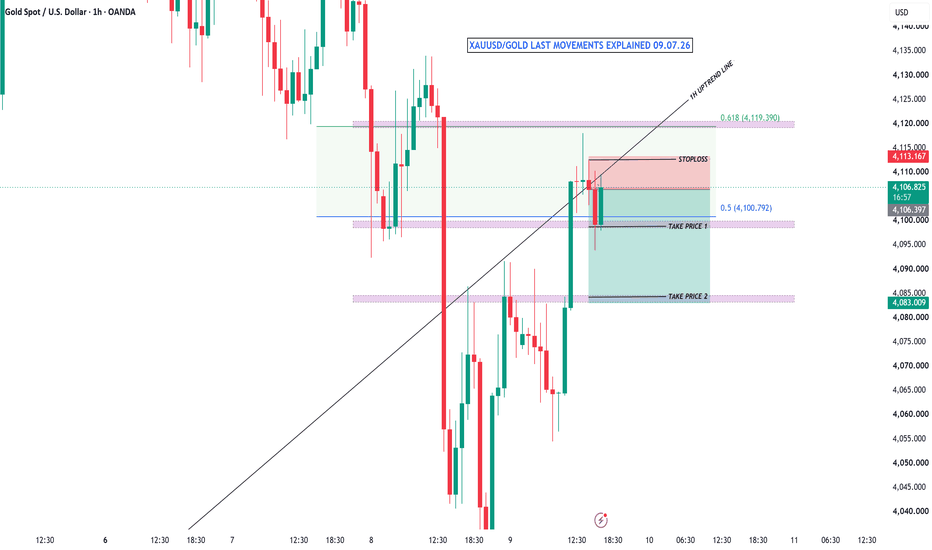
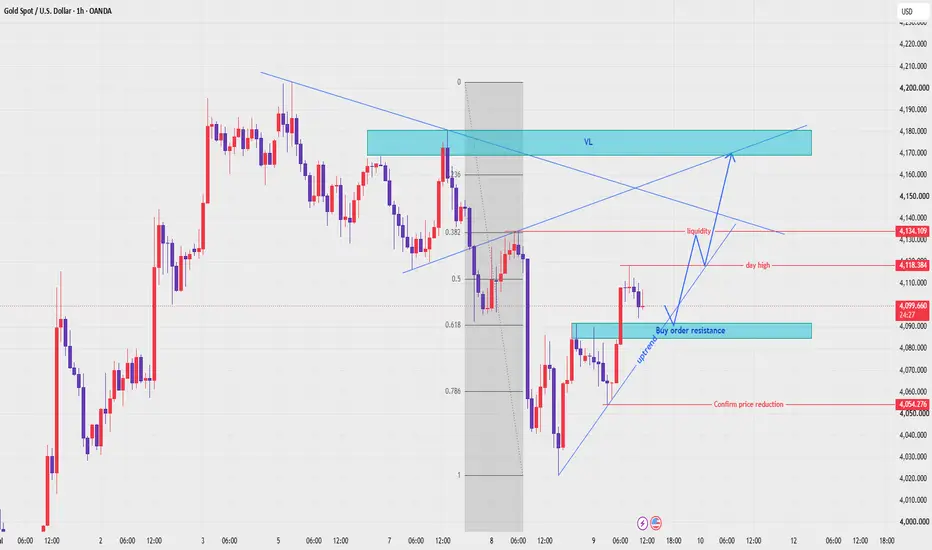
XAUUSD — Bullish Setup Holding Above Buy Zone
Fundamental Analysis
Gold is still reacting to USD momentum, Treasury yields, and upcoming U.S. data. For now, the short-term structure remains positive while buyers continue to defend the recovery trend.
Technical Analysis
On the 1H chart, XAUUSD is trading around 4,100 and holding above the rising trendline. The key buy order zone at 4,087 - 4,092 is acting as the main value area. If price holds this zone, the bullish structure can continue toward the day high at 4,118, then the liquidity area around 4,134. A stronger breakout may open the way toward 4,168 - 4,180.
Important Key Levels
Current price: 4,100
Buy zone: 4,087 - 4,092
Short-term support: 4,054
Day high: 4,118
Liquidity target: 4,134
Main target: 4,168 - 4,180
Invalidation: below 4,054
Trading Scenario
Main Buy Setup
Entry: 4,087 - 4,092
Stop Loss: 4,054
Take Profit 1: 4,118
Take Profit 2: 4,134
Take Profit 3: 4,168 - 4,180
Buy Condition
Wait for price to retest 4,087 - 4,092 and show bullish rejection. A clean hold above this zone keeps the bullish setup valid. If price breaks above 4,118, upside momentum becomes stronger. If price breaks and holds below 4,054, the buy setup is invalid.
Overall View
XAUUSD remains bullish while price holds above the rising trendline and the 4,087 - 4,092 buy zone. The preferred plan is to wait for confirmation from the value area, then look for continuation toward 4,118, 4,134, and 4,168 - 4,180.
Do you share the same bullish view on gold, or are you waiting for confirmation above the day high?
Long 
Long 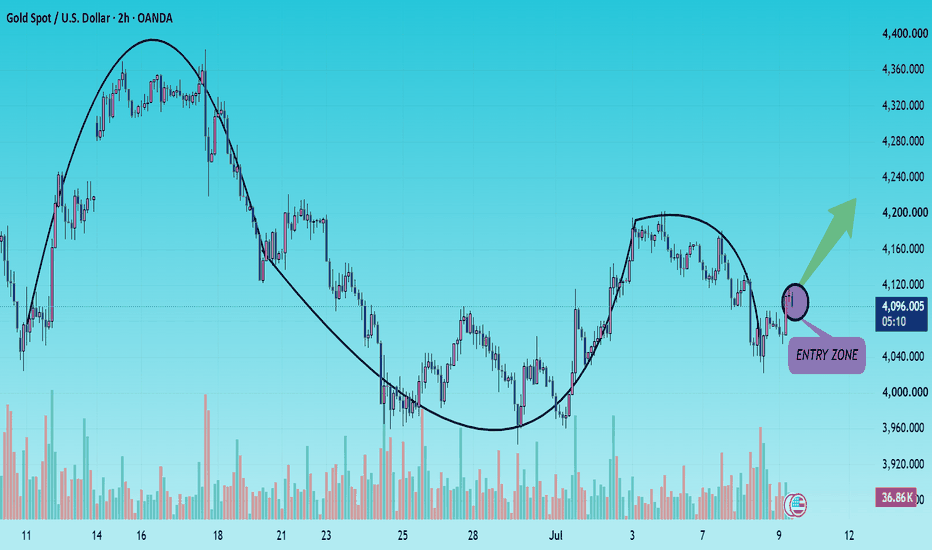
 Long
Long
Short 
Short 
XAUUSD – Gold Pulls Back, But The Rising Channel Is Still XAUUSD – Gold Pulls Back, But The Rising Channel Is Still Holding
Gold is pulling back, but the structure is not broken yet.
After price dropped close to the 4,100 area, buyers started to react near the lower boundary of the rising channel. Gold is now trading around 4,125, just above the key buy zone around 4,112.
This is an important moment on the H1 chart. The market is testing whether the recent decline is only a correction inside the bullish channel, or the beginning of a deeper breakdown.
FUNDAMENTAL ANALYSIS
Gold came under pressure in early Asian trading as geopolitical tension between the U.S. and Iran continued to create uncertainty across the market.
At the same time, weaker U.S. NFP data has reduced expectations for a more aggressive Fed path. This can limit downside pressure on gold, because softer labour data often supports the idea of easier policy expectations.
For now, the fundamental background is mixed. Geopolitical risk can support gold, while short-term USD strength can pressure price. That is why the technical reaction around the current buy zone becomes very important.
TECHNICAL ANALYSIS – SMC + MARKET STRUCTURE
From an SMC perspective, gold is still moving inside a rising channel. Price has created higher lows from the late-June base, which means the short-term recovery structure remains active.
The current buy zone around 4,112 is the most important area on the chart. This zone is sitting near the lower channel boundary, where buyers need to defend the structure.
If gold holds above 4,112 and forms a bullish reaction, price may continue higher toward 4,151 first. Above that, the next attention area is around 4,209, where the market may test stronger liquidity and possible resistance.
The major upside resistance remains around 4,276. If buyers can push price through 4,209, the path toward 4,276 becomes more interesting.
However, if gold breaks below 4,112 and loses the lower channel, the bullish structure becomes weaker. In that case, price may return toward the 4,100 area or lower support zones.
KEY PRICE ZONES TO WATCH
Current price: 4,125
Main buy zone: 4,112
Lower channel support: 4,112 – 4,120
Short-term resistance: 4,151
Attention zone: 4,209
Strong resistance: 4,276
Bullish continuation target: 4,209
Main upside target: 4,276
Invalidation for bullish view: Below 4,112
TRADING SCENARIOS
Buy Scenario – Channel Continuation View
If gold holds above the 4,112 buy zone, I will watch for bullish continuation inside the rising channel.
Buy Zone: 4,112 – 4,120
Entry: Bullish rejection, liquidity sweep, lower-timeframe CHoCH, or strong bullish reaction from channel support
SL: Below 4,112 or below the nearest swing low
TP1: 4,151
TP2: 4,209
TP3: 4,276 if momentum continues
Breakout Buy Scenario
If gold breaks and holds above 4,151, buyers may continue pushing price toward the next liquidity area.
Buy Condition: Clean breakout above 4,151, followed by retest and bullish confirmation
Target: 4,209 – 4,276
Sell Scenario – Only If Channel Support Fails
Sell is not the priority while gold holds above the buy zone. However, if price breaks below 4,112, the recovery structure becomes weaker.
Sell Zone: Below 4,112 after confirmation
Entry: Clean breakdown, bearish retest, or lower-timeframe bearish CHoCH
TP1: 4,100
TP2: 4,080
TP3: Lower support if selling pressure expands
Invalidation: If price quickly reclaims 4,112 – 4,120, the sell idea becomes weaker.
MY VIEW ON GOLD
My current view for gold is cautious bullish while price stays inside the rising channel.
The pullback near 4,100 created pressure, but buyers are still defending the lower channel area. This means the market has not confirmed a bearish breakdown yet.
The key level for today is 4,112. If this zone holds, gold may continue toward 4,151 and possibly 4,209. If 4,112 fails, the structure changes and sellers may regain short-term control.
For now, gold is at a quiet but important decision point.
Do you think buyers will defend 4,112 and push gold toward 4,209, or will the rising channel break today?
Long 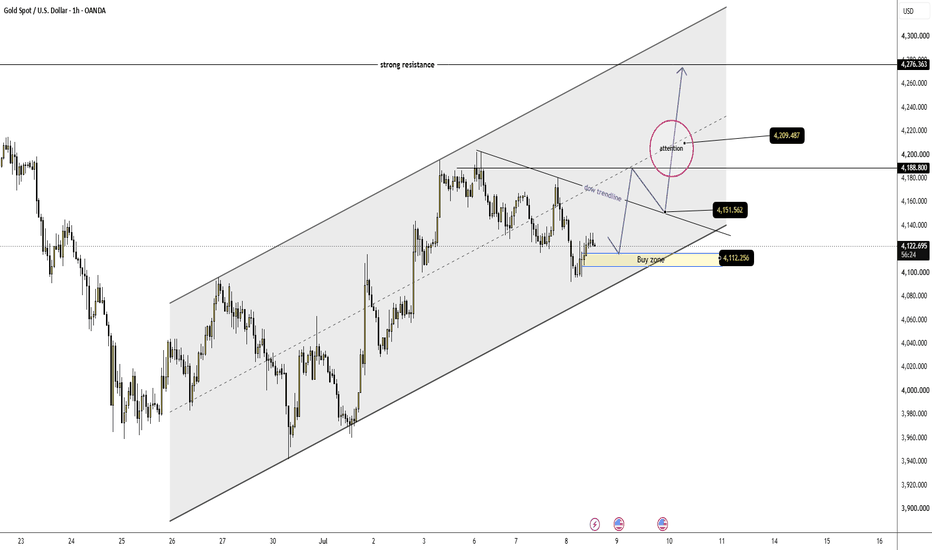
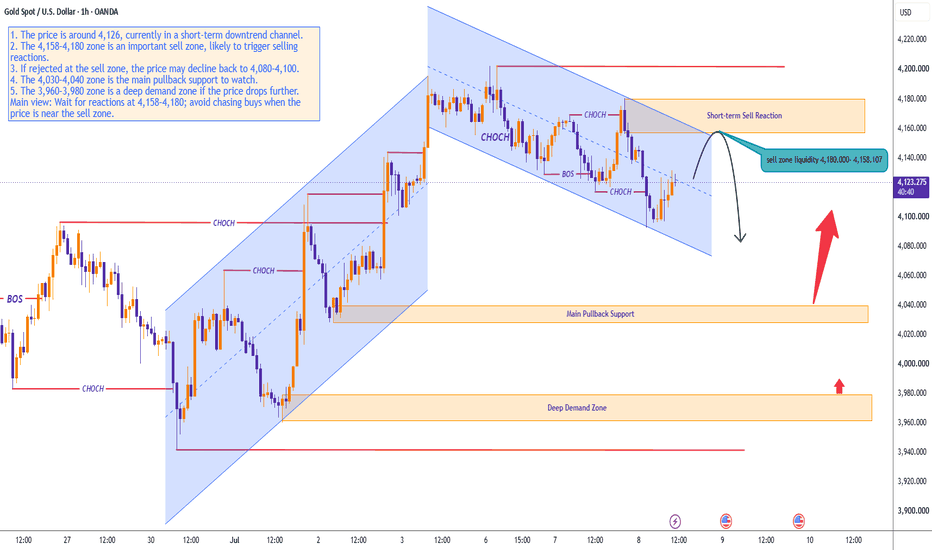
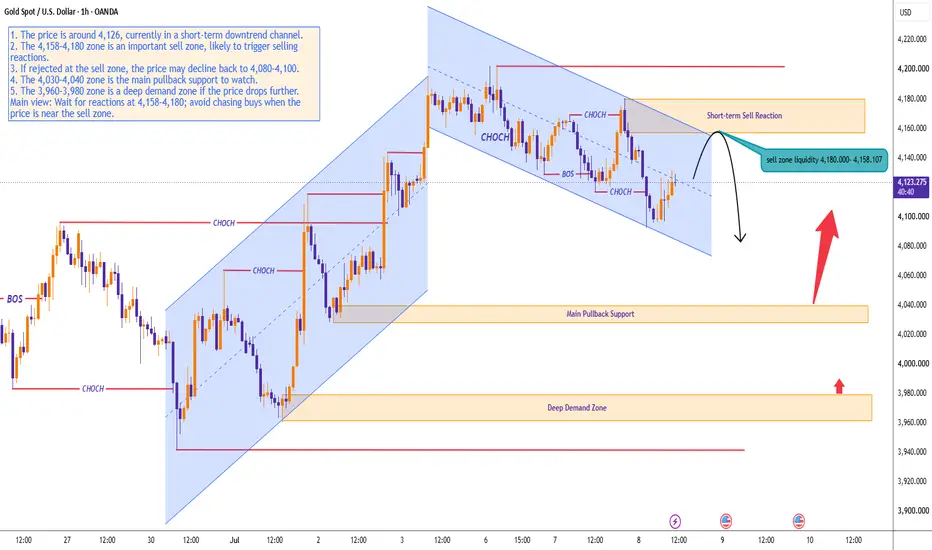
XAUUSD: Buyers Are Walking Into a Sell Zone XAUUSD: Buyers Are Walking Into a Sell Zone
Market Context
Gold is trading around 4,124 after recovering from the early Asian weakness near 4,100. The market remains sensitive as US-Iran tension keeps risk sentiment unstable, while weaker US NFP data has reduced expectations for another Fed rate hike.
This creates a mixed backdrop for gold. Softer Fed expectations can support the metal, but USD volatility, oil pressure, and geopolitical headlines can still create sharp intraday swings.
The main story is simple: gold is rebounding, but price is now moving toward a short-term sell reaction zone. Buyers are not safe until 4,180 is reclaimed with strength.
Technical Structure
Gold is currently moving inside a short-term downward channel after failing from the recent upper structure. The recovery from 4,100 looks constructive, but it is still approaching resistance instead of confirming a clean breakout.
The key sell zone is 4,158 - 4,180. This is where sellers may return if price fails to break the channel and hold above liquidity.
If gold rejects from this zone, the first downside area to watch is 4,080 - 4,100. Below that, the main pullback support sits around 4,030 - 4,040.
The deeper demand zone remains 3,960 - 3,980. This is the major support area if sellers fully regain control.
Key Levels
Current Price: 4,124
Short-term Sell Zone: 4,158 - 4,180
First Downside Area: 4,080 - 4,100
Main Pullback Support: 4,030 - 4,040
Deep Demand Zone: 3,960 - 3,980
Bullish Confirmation: Above 4,180
Bearish Risk: Below 4,100
Trading Plan
Sell Scenario: Rejection From Sell Zone
Entry: 4,158 - 4,180 after bearish confirmation
Stop Loss: Above 4,200
TP1: 4,100
TP2: 4,080
TP3: 4,040
Conditions: Price must push into the 4,158 - 4,180 sell zone and fail to break higher. Bearish rejection should appear near the channel resistance. Buyers must lose momentum and price should start forming lower highs again. Avoid early sells before price reaches the reaction zone.
Buy Scenario: Breakout Above Supply
Entry: Above 4,180 after breakout and retest
Stop Loss: Below 4,140
TP1: 4,200
TP2: 4,220
TP3: 4,250
Conditions: Price must break above 4,180 with strength, retest the zone successfully, and hold above the short-term channel. A clear bullish BOS or CHOCH should appear before considering continuation. Avoid chasing the first breakout candle without a retest.
Buy Pullback Scenario
Entry: 4,030 - 4,040 after bullish confirmation
Stop Loss: Below 3,980
TP1: 4,080
TP2: 4,100
TP3: 4,158
Conditions: Price pulls back into the main support area and shows a strong bullish reaction. Buyers must defend 4,030 - 4,040 clearly. This setup is valid only if the pullback is controlled, not a sharp breakdown with strong bearish momentum.
Breakdown Sell
Entry: Below 4,030 after confirmed breakdown and retest
Stop Loss: Above 4,080
TP1: 3,980
TP2: 3,960
TP3: 3,940
Conditions: Price loses the main pullback support, retest fails, and bearish momentum continues. This would confirm that the rebound has failed and gold may rotate back into the deep demand zone.
Overall Bias
Gold is recovering, but the rebound is moving directly into resistance. The 4,158 - 4,180 zone is the decision area.
If sellers defend this zone, gold may drop back toward 4,100 and 4,040. If buyers break and hold above 4,180, the short-term structure can shift toward a stronger recovery.
Best approach: wait for reaction at 4,158 - 4,180. Do not chase buys when price is already close to the sell zone.
Will buyers break 4,180, or will sellers turn this rebound into another rejection?
Short