XAUUSD
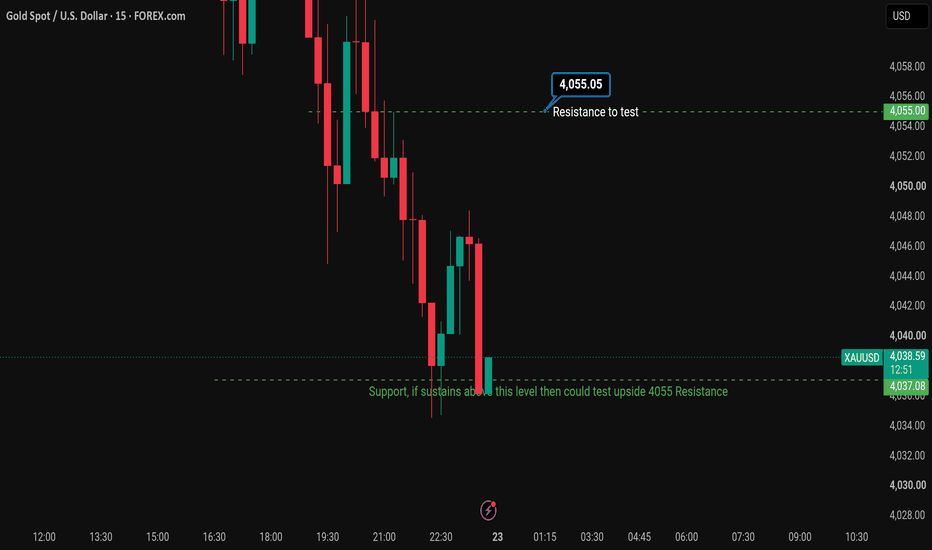
XAUUSD 15m: Bullish Reversal Plan from Key Support Baseline
• Ticker: XAUUSD (Gold Spot / U.S. Dollar) via FOREX.com
• Timeframe: 15-Minute (15m)
• Current Price: 4,038.73 USD (-7.45 / -0.18%)
Key Technical Levels
• Overhead Resistance Target: 4,055.05 USD (Major structural ceiling labeled on the chart as: "Resistance to test").
• Defined Support Base: 4,037.08 USD (The structural floor marked by the label: "Support, if sustains above this level then could test upside 4055 Resistance").
Futures market
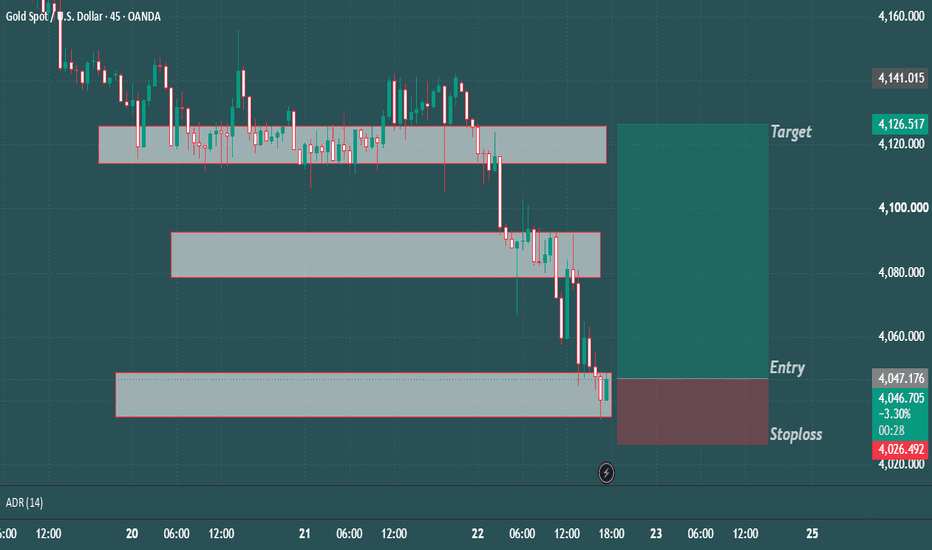
XAU/USD 45M | Support Zone Reaction and Potential Upside SetupGold has recently experienced strong selling pressure, moving down through several previously established support areas. Price is now approaching a marked zone around 4,040–4,050, where a reaction may develop.
Technical Overview
Market Structure: Recent price action shows bearish momentum, with lower prices following the breakdown of previous consolidation zones.
Current Zone: Price is testing the lower highlighted area, which may act as a potential support region.
Entry Area: The chart mark
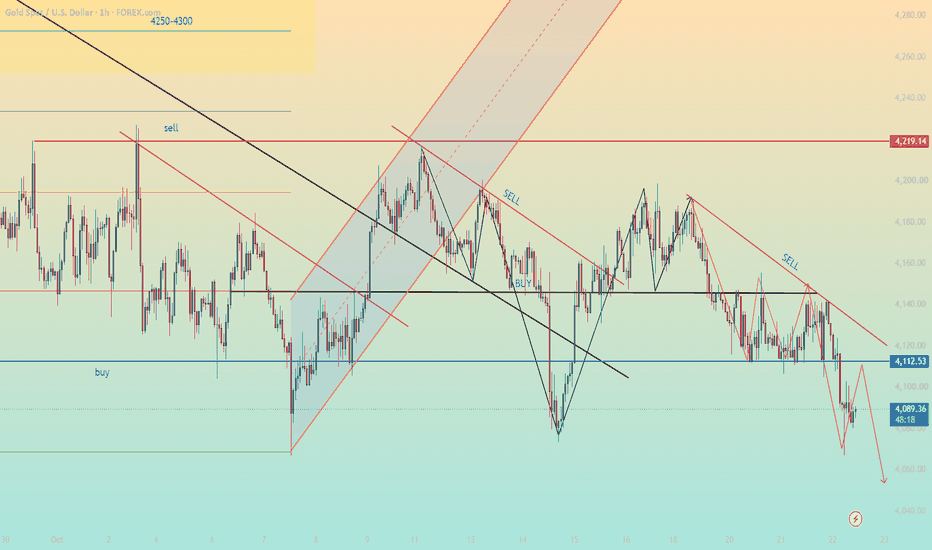
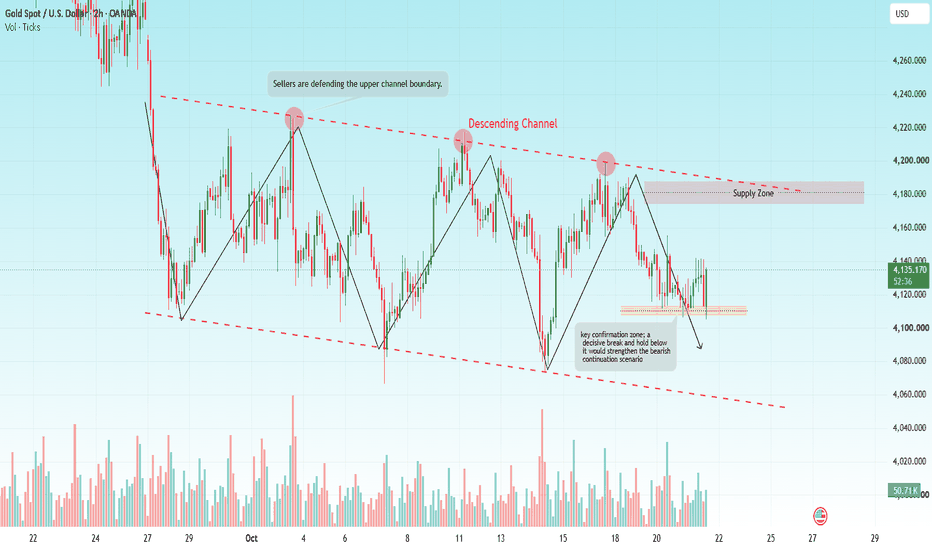
XAUUSD Bearish Continuation | Descending Channel Sell SetupGold continues to show bearish characteristics on the 2-hour chart, with price action respecting a descending channel and repeatedly failing to sustain upward momentum. The sequence of lower highs suggests that sellers remain active during recovery attempts, while the upper channel boundary continues to act as dynamic resistance.
The recent rebound toward the 4,180–4,200 supply region failed to establish a sustained bullish breakout. This rejection indicates that buyers have not yet demonstrate
XAU/USD 4H — SUPPORT UNDER PRESSURE!
Gold sellers are maintaining control as price continues to print lower highs and lower lows beneath a descending trendline.
The key battle is now unfolding around $4,030–$4,050. Will buyers defend this support, or will gold break lower toward the psychological $4,000 level?
📊 MARKET STRUCTURE
• Bearish trend structure remains intact.
• Price is testing the latest support zone.
• The $4,125–$4,145 area is a potential resistance zone if a rebound develops.
🟢 BULLISH SCENARIO
If $4,030–$4,050 h
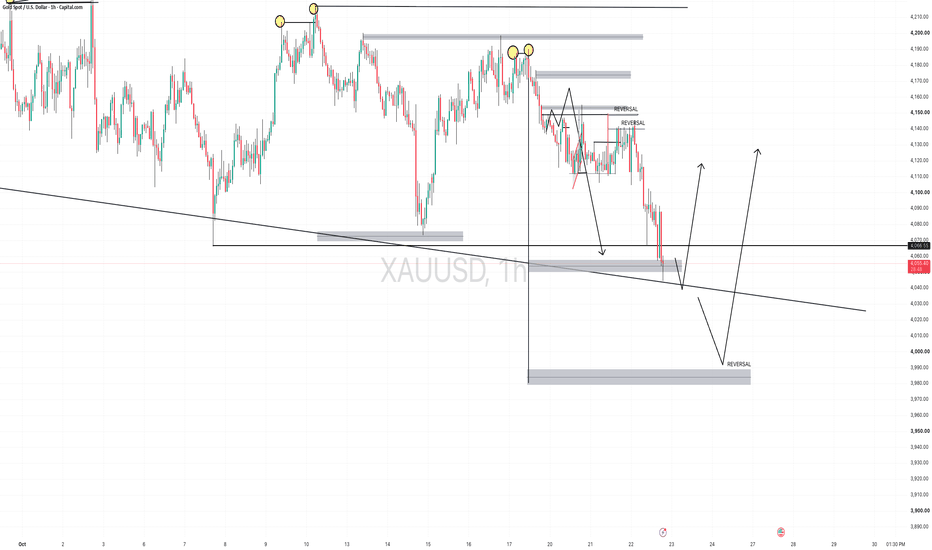
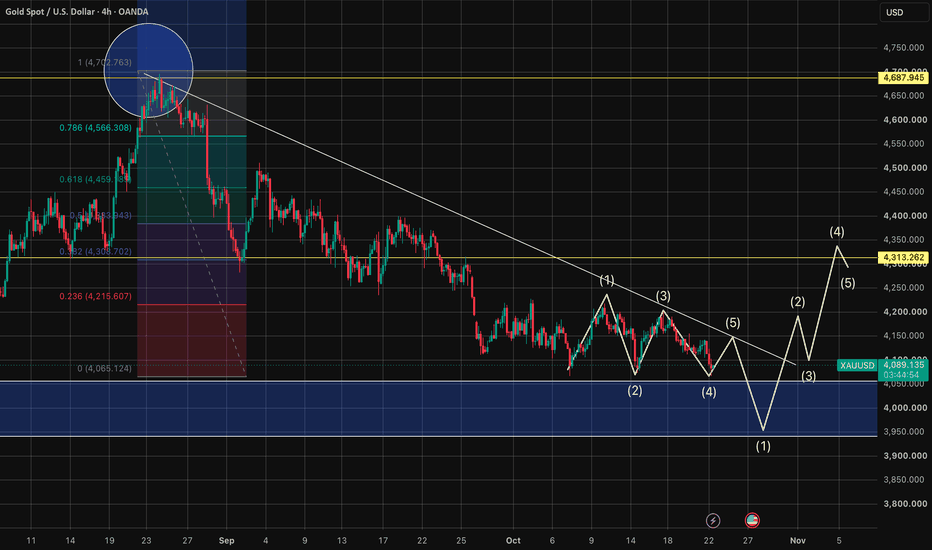
MFTC IS BULLISH AT 4000–3950 ON XAUUSD | MAJOR BULLISH REVERSALXAUUSD 1H — MFTC Bullish Reversal Setup
MFTC Structure | Potential Bullish Reversal Zone
XAUUSD is currently approaching a critical MFTC reversal zone around 4050–4000, with the broader reaction area extending toward 3950.
According to the MFTC structure, supply pressure appears to be slowing down in this zone, while the market is showing signs of possible large-player manipulation and supply exhaustion
We also have a 4H triangle breakout failure / fakeout, which adds confluence to the possi
XAUUSD
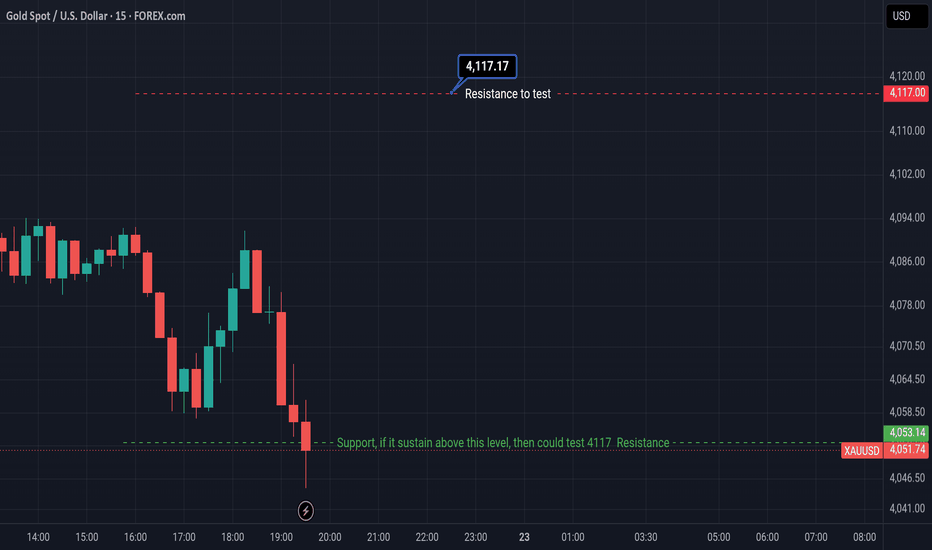
XAUUSD 15m: Bullish Reversal Plan from Key Support Baseline
• Ticker: XAUUSD (Gold Spot / U.S. Dollar) via FOREX.com
• Timeframe: 15-Minute (15m)
• Current Price: 4,050.32 USD (-6.59 / -0.16%)
Key Technical Levels
• Overhead Resistance Target: 4,117.17 USD (Major structural ceiling labeled on the chart as: "Resistance to test").
• Defined Support Base: 4,053.14 USD (The structural floor marked by the label: "Support, if it sustain above this level, then could test 4117 Resistance").
M
XAUUSD
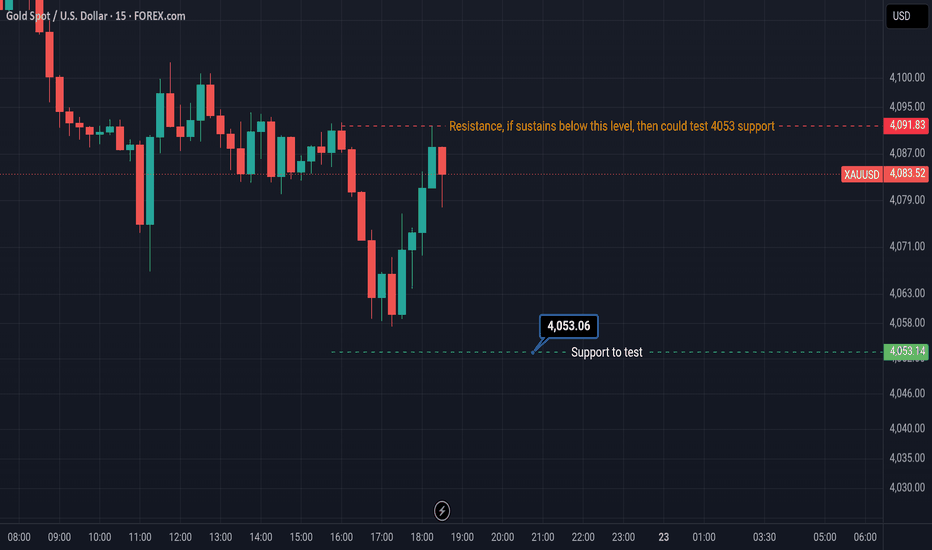
XAUUSD 15m: Bearish Rejection at Flipped Resistance Targets Lower Support
• Ticker: XAUUSD (Gold Spot / U.S. Dollar) via FOREX.com
• Timeframe: 15-Minute (15m)
• Current Price: 4,082.54 USD (-5.66 / -0.14%)
Key Technical Levels
• Overhead Resistance Line: 4,091.83 USD (Identified structural ceiling labeled as: "Resistance, if sustains below this level, then could test 4053 support").
• Horizontal Support Target: 4,053.14 USD (Identified downside target zone labeled as: "Support to test").
Gold Trapped in a Range: Capped Above, Supported Below During TGold Trapped in a Range: Capped Above, Supported Below
During Thursday’s Asian morning session, spot gold traded within a narrow range near $4,115 per ounce, extending the weakness seen the previous day. The core tension currently driving gold prices lies in the tug-of-war between safe-haven demand—spurred by geopolitical conflict—and the opportunity cost pressures stemming from a high-interest-rate environment. Consequently, the precious metal finds it difficult to stage a significant decline
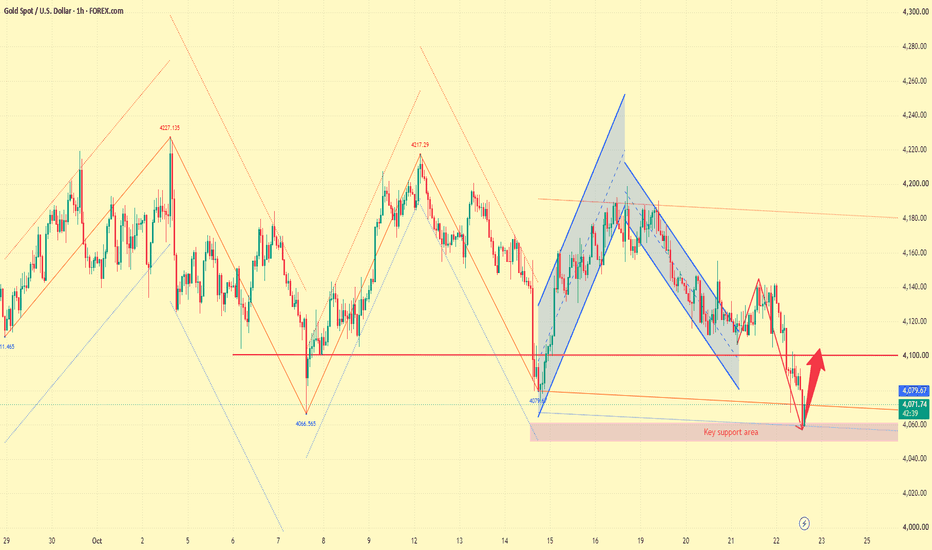
XAU/USD Gold Market Analysis | Assessing Downside Breakouts and XAU/USD Gold Market Analysis | Assessing Downside Breakouts and Support Levels
📊 During the Asian and European trading sessions, gold has remained weak, with prices dipping toward the 4059 level. The previous support level at 4079.67 has been breached, further reinforcing a bearish structure. Gold is currently moving within a downward channel, with successive lower highs indicating that selling pressure remains dominant in the short term; however, following a sustained decline, one should also
Option TradingIntraday trading involves buying and selling financial instruments within the same trading session, with all positions closed before the market ends. Traders aim to take advantage of short-term price fluctuations using fast decision-making and technical analysis. Intraday trading is highly active and often relies on chart patterns, volume analysis, momentum indicators, and market news to identify quick trading opportunities.
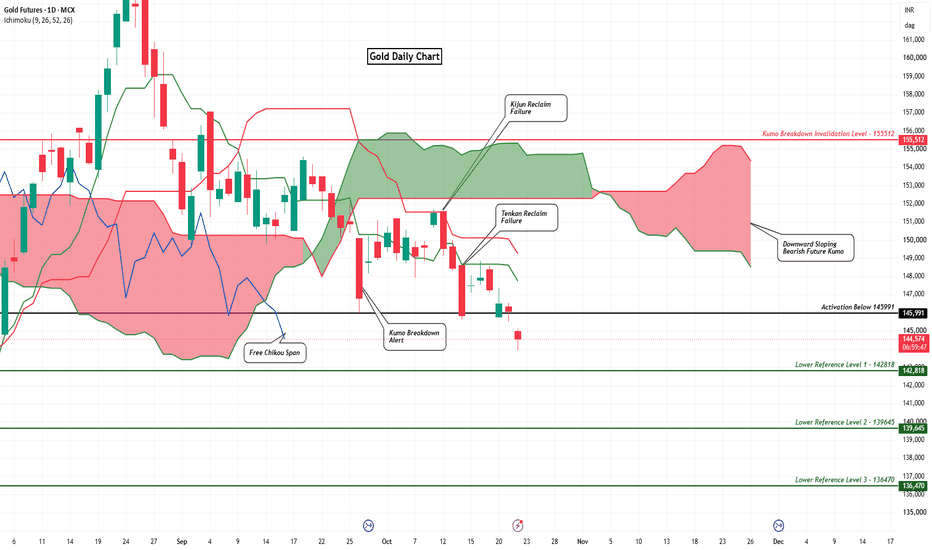
GOLD1!(D) Bears Growl With Kumo Breakdown + TK Reclaim FailuresThe initial Kumo breakdown dragged price and Tenkan below the Kumo while Kijun was still hovering near the Kumo Top.
Price action staged a brief throwback post-breakdown, which eventually dragged Kijun below the Kumo too .
The 9th bar post breakdown did material damage to the structure by forming a Kijun reclaim failure below the Kumo.
This was eventually followed by a Tenkan reclaim failure , with price subsequently breaking below the Kumo breakdown candle's low and activating the
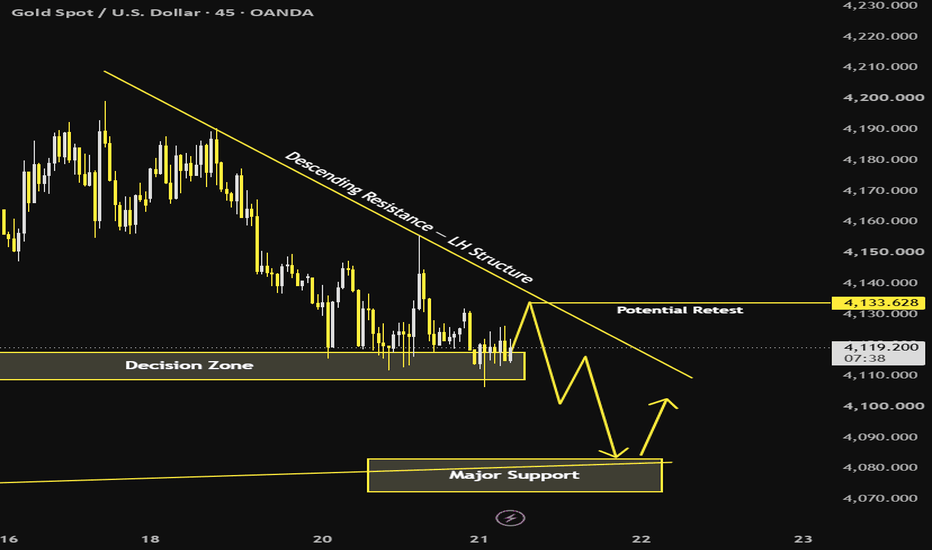
XAUUSD: A Retest Before the Next Breakdown?
Gold is approaching a critical structural decision. While buyers are defending near-term support, the sequence of lower highs suggests that sellers have not surrendered control.
Could the next bounce simply create another selling opportunity?
Market Structure — Lower Highs Dominate
On the M45 chart, Gold has developed a bearish short-term structure following its rejection from the 4,190 region.
Successive lower highs remain beneath a descending resistance trendline, while recent price actio
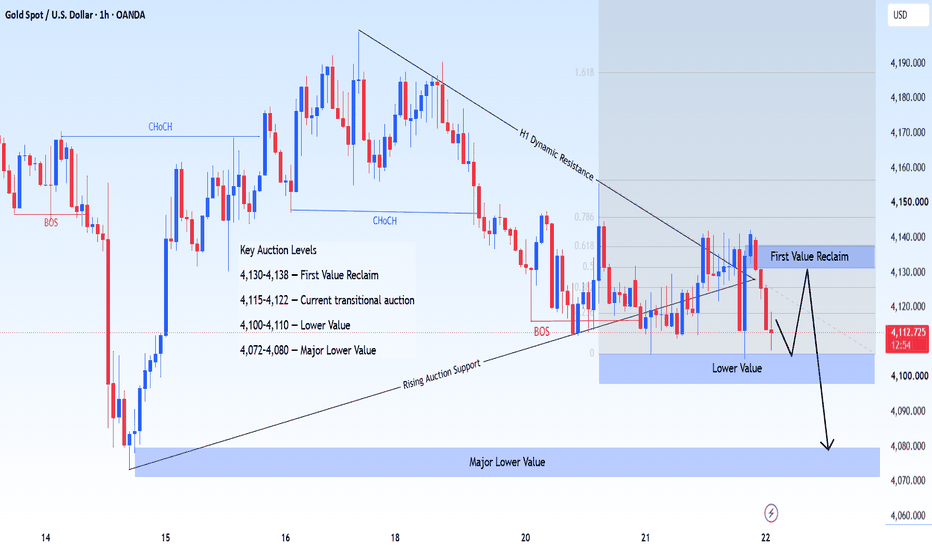
XAUUSD — Value Acceptance Around 4,115
Auction State
XAUUSD on H1 remains in a directional lower auction, although the market is beginning to slow after reaching the 4,105–4,115 area. Price has remained below the descending H1 dynamic resistance and continues to trade beneath the previous higher-value distribution.
The latest macro backdrop is slightly more supportive for Gold but has not yet changed the auction structure. Gold recovered toward $4,138 as U.S. Treasury yields eased, while the dollar also softened ahead of the Octobe
## Gold (XAU/USD) Chart Summary## Gold (XAU/USD) Chart Summary
Overall direction: Bearish 📉
- Current price: 4,085
- Support: 4,066
- Next support: 4,047–4,035
- Resistance: 4,112–4,133
- Stronger resistance: 4,149–4,172
Possible trades:
- 🔴 Sell: If price pulls back and shows bearish confirmation.
- 🟢 Buy: If price bounces from 4,066 with strong bullish confirmation.
- ⚠️ If price breaks below 4,066, it may fall toward 4,047–4,035.
My conclusion: Sellers are currently stronger, but don't enter immediately after a sharp
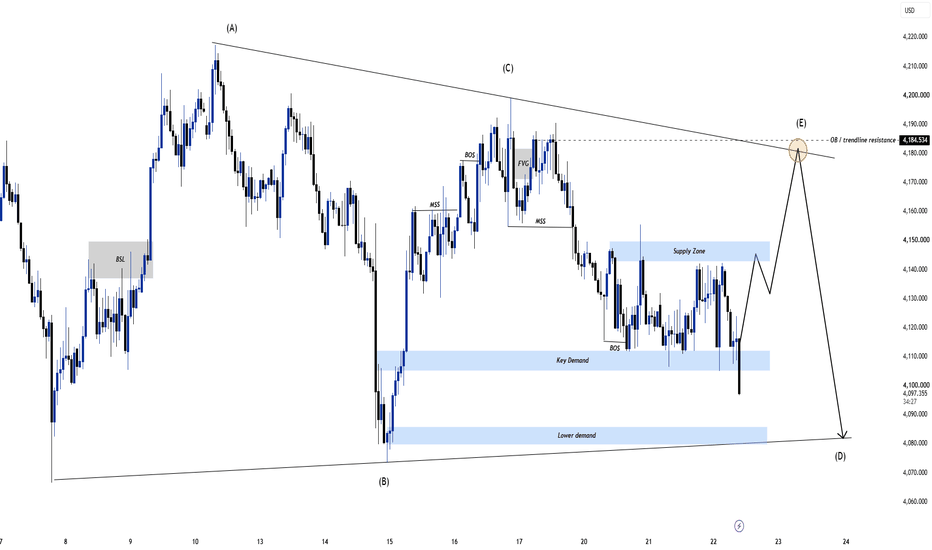
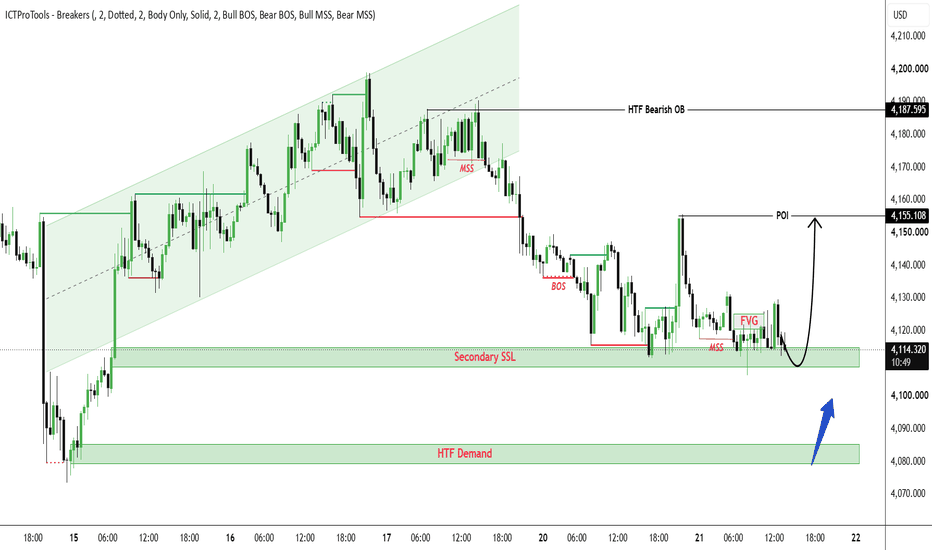
Gold H1: A Demand Bounce Into the Next Trap?Gold is reacting from demand again. Could that recovery carry price into resistance before sellers regain control?
The chart still shows a bearish MSS followed by BOS. A bounce can develop within that structure, but buyers need confirmation before the projected recovery becomes credible.
Macro Context
Easing Treasury yields offer potential relief, while elevated energy costs and uncertainty over the policy outlook keep the backdrop mixed.
H1 Technical Map
• Approximately 4,105–4,112: key de
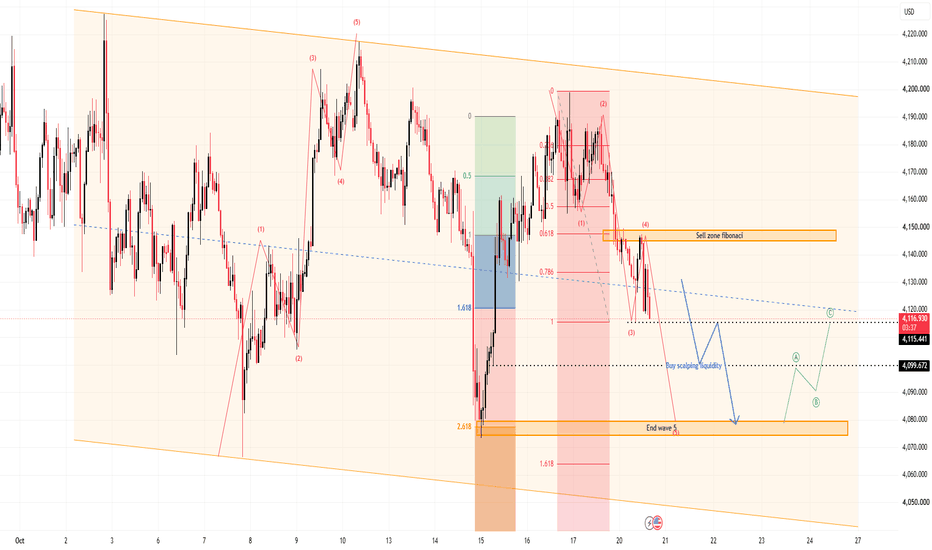
XAUUSD — Bearish Wave 5 Toward 4,080
From Kelly’s view, gold remains inside a broader bearish structure and continues to trade within a descending channel. Price is currently around 4,122, while the latest rebound has failed to break the sequence of lower highs. The 4,144–4,150 Fibonacci sell zone is still the key resistance area controlling the short-term bearish scenario.
The key idea is simple: if sellers continue to defend the 4,144–4,150 zone, gold may complete the current Wave (4) correction and extend lower through 4,115,
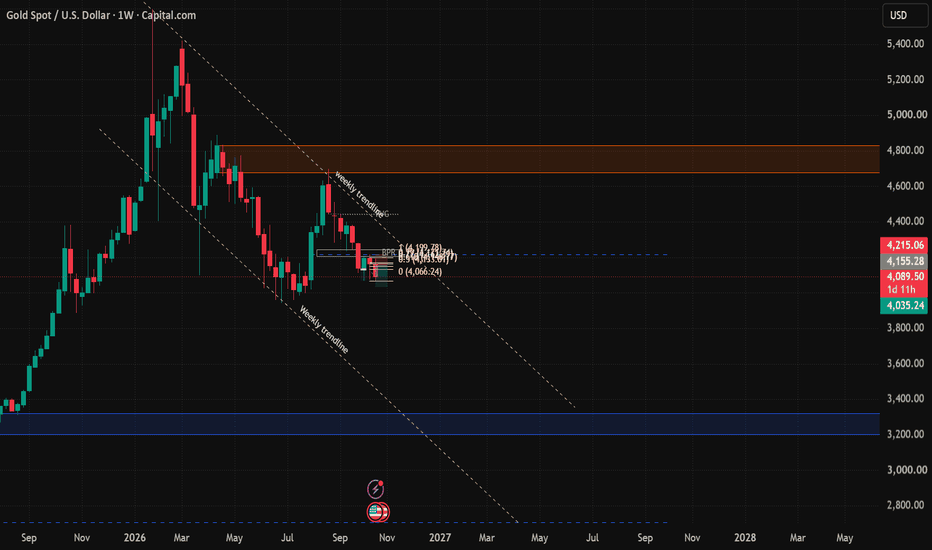
GOLD 4H Chart pattern Gold at its peak now at demand zone
4000 is strong demand zone last time it get support from this level it reverse the whole pattern from that level there is strong bull buy and touch the high of 4650-700 from 4000 level now again it is near 4000 m gonna buy at demand zone 4000-3900 gonna take some risk if it breaks 3900 gold will fall pretty much according to mee.. 4000 is strong demand zone wait for proper restest..
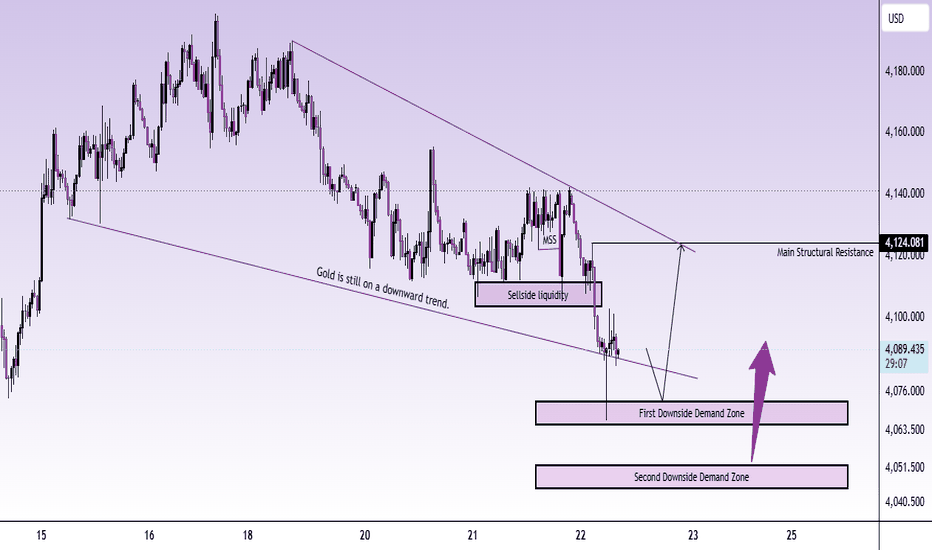
XAUUSD — 4100 Broken: Liquidity Trap?
Gold has finally broken the level buyers were fighting to defend.
But I'm not convinced the next move will be as simple as another straight decline.
After several sessions of failed recoveries, gold has dropped beneath the 4,100–4,110 support structure and is now trading around 4,092.
The sellers have clearly regained control.
Lower highs continue to form, the descending resistance trendline remains intact, and the latest bearish expansion has taken liquidity beneath the previous consolida
XAUUSD: Gold Tests Key Support — Rebound or Further Decline?🟡 TREND FORECAST | XAUUSD
• Gold remains under bearish pressure following repeated rejection from the 4140–4145 supply wall and a breakdown below 4108–4112.
• Price is currently trading around 4096 after a sharp liquidity sweep below 4090–4087 and a subsequent rebound. Despite the recovery, the H1 structure continues to favor selling rebounds while price remains below the key resistance zones.
Keylevel
• Resistance: 4108–4112 → 4117–4121 → 4140–4145
• Support: 4090–4087 → 4074–4070
🚀 TRADING S
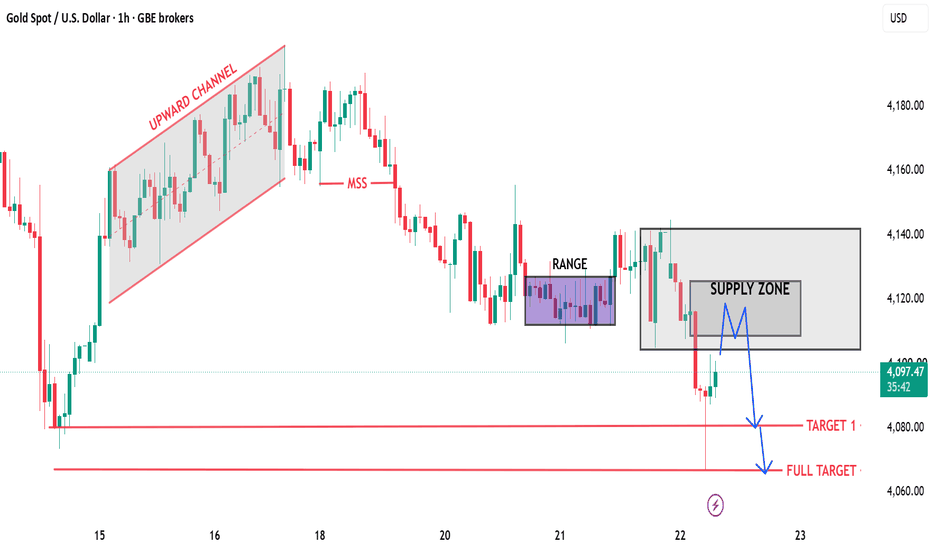
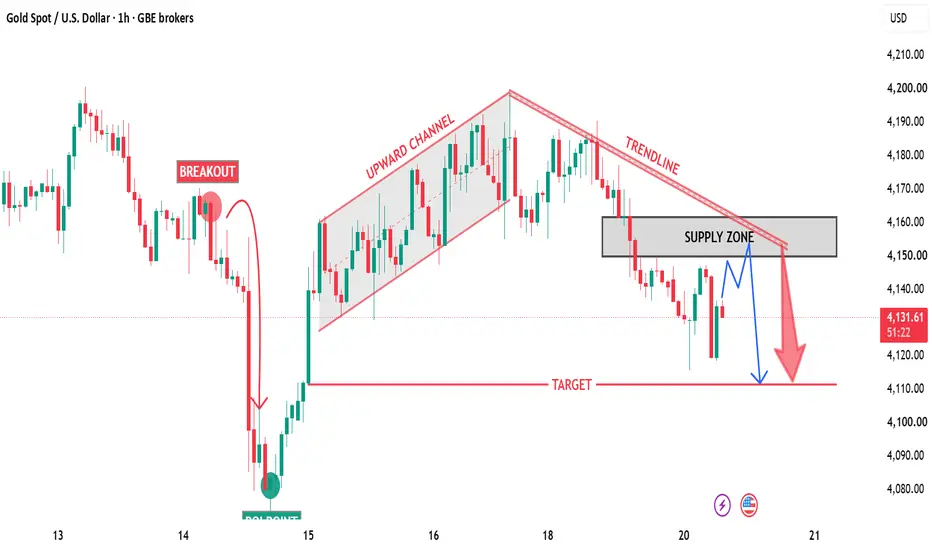
XAUUSD: Bearish Continuation via Supply Zone Retest | Target ?📌 Market Context & Technical Analysis
Gold (XAUUSD) on the 1-Hour timeframe has completed a clear structural shift:
Upward Channel Failure & MSS: After climbing within an ascending channel, Gold broke down heavily and created a Market Structure Shift (MSS). This shift flipped market sentiment and order flow to bearish. Range Breakdown: Following the initial sell-off, price spent time consolidating inside a tight Range ($4,115 – $4,127). The recent impulse move broke below this range, confirmin
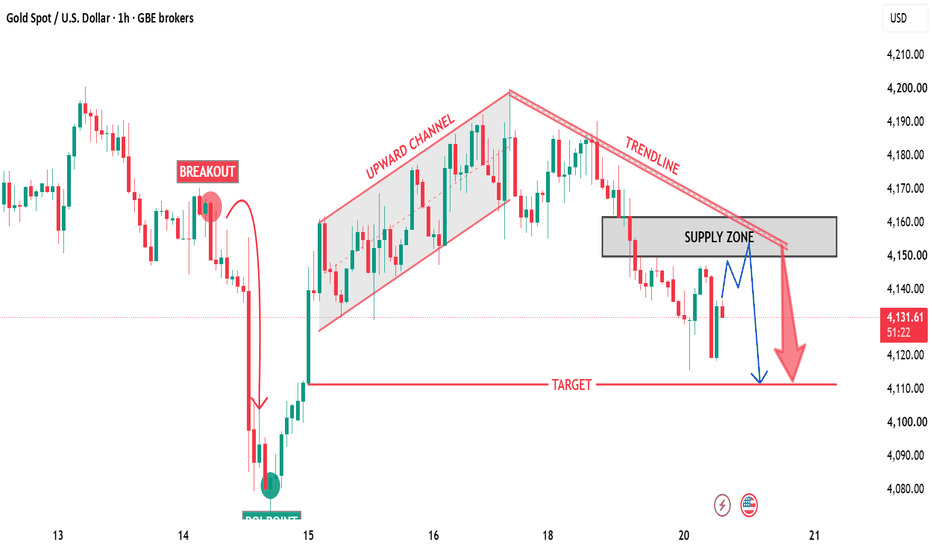
GOLD (XAUUSD) 1H: Retest of Trendline Resistance & Supply Zone ?Technical Overview:
Gold (XAUUSD) on the 1-hour chart has broken down from its previous Upward Channel after failing near the 4,200 key resistance area. Price is currently forming lower highs below a strong descending Trendline
Trade Plan & Key Levels:Supply Zone / Resistance: 4,150 – 4,160 Descending Resistance: Downward-sloping trendline acting as dynamic resistance Target: 4,110 (Previous swing low / key support level)
Execution Strategy:Pullback & Retest: Looking for price to make a
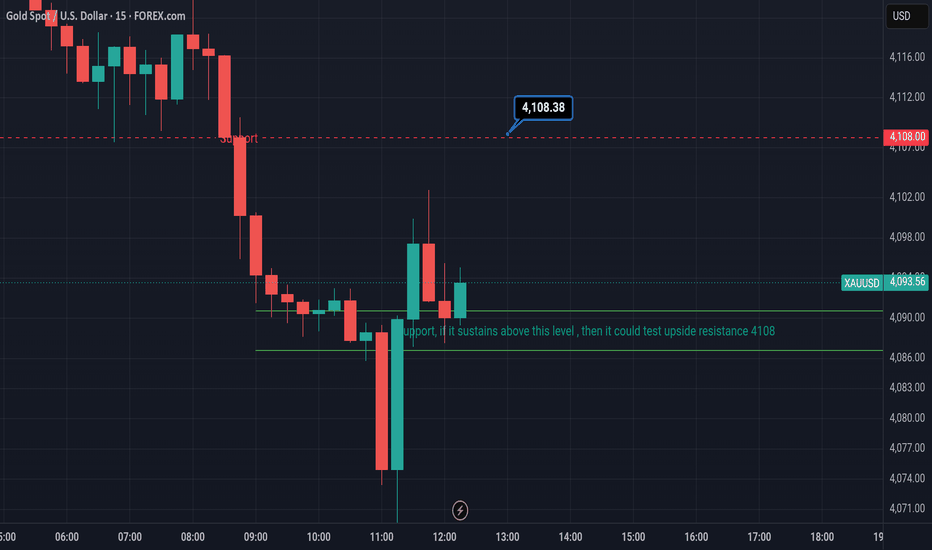
XAUUSD
XAUUSD 15m: Technical Reversal Setup Targets Overhead Liquidity
• Ticker: XAUUSD (Gold Spot / U.S. Dollar) via FOREX.com
• Timeframe: 15-Minute (15m)
• Current Price: 4,093.16 USD
Key Technical Parameters
• Upside Resistance Objective: 4,108.38 USD (Prior structural support zone, now acting as flipped overhead resistance).
• Defined Support Base: 4,088.00 USD (Horizontal accumulation floor noted on chart: "Support, if it sustains above this level, then it could test upside resistance 41
Bearish Repricing Toward Sell-Side Liquidity
Market Context
Gold remains under pressure as rising oil prices revive inflation concerns and reinforce expectations that the Federal Reserve may need to keep policy restrictive for longer. Markets are pricing a low probability of an October hike but still expect tighter policy risk into December, while Treasury yields and the USD remain important drivers. With Gold recently trading near 4,119, downside momentum remains relevant despite intermittent safe-haven demand.
SMC View
The chart shows