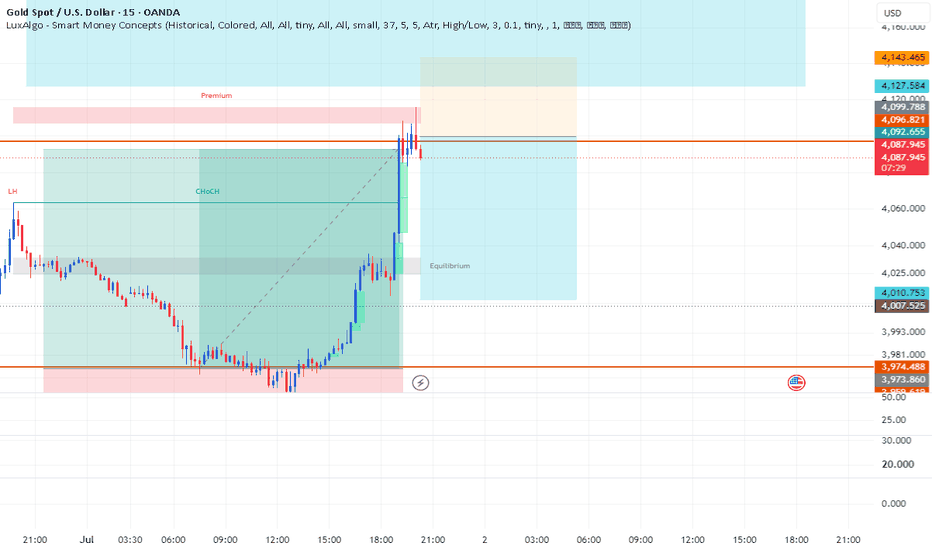
Long
Long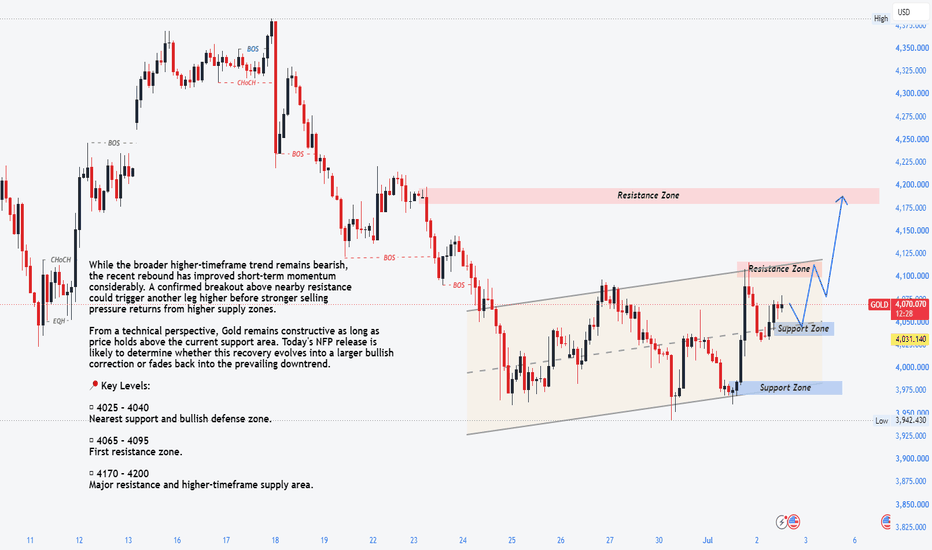
XAUUSD – Gold Is Holding The Buy Order Zone, But 4,120 XAUUSD – Gold Is Holding The Buy Order Zone, But 4,120 Is The Real Test
Gold is showing a stronger recovery after reacting from the strong support area around 3,960.
Price is now trading near 4,069 after forming a clear bounce from the lower zone. The short-term structure has improved, and buyers are trying to build momentum above the buy order area around 4,036.
But the chart is now entering an important test. Gold has recovered well, but the next resistance zones will decide whether this is the start of a stronger bullish continuation or just another corrective move before sellers return.
FUNDAMENTAL ANALYSIS
Gold remains sensitive to the U.S. dollar, Treasury yields, and market expectations around interest rates. After the recent decline, the current rebound may be supported by technical buying from lower levels and short-term profit-taking from sellers.
For now, the technical structure is giving the clearest signal. Price has reacted from support, but buyers still need to break through the resistance zones before the bullish view becomes stronger.
TECHNICAL ANALYSIS – SMC + FIBONACCI
From an SMC perspective, gold has respected the strong support zone near 3,960 and created a strong bullish reaction. This shows that sellers lost momentum at the lower area, while buyers started to defend the market.
The current buy order zone around 4,036 is very important. As long as gold stays above this area, the short-term bullish recovery remains valid.
The recent pullback also respected the Fibonacci reaction area, showing that buyers are trying to hold structure instead of allowing price to fall back into the previous low. This gives the chart a cleaner recovery setup.
The first resistance is around 4,090 – 4,100. If gold breaks above this area, the next major resistance sits around 4,115 – 4,125. This zone is important because it aligns with the previous reaction area and could decide whether buyers can continue the move.
Above that, the stronger sell price reaction zone is around 4,155 – 4,165. If gold reaches this area, sellers may defend again, so confirmation is still needed before expecting a full bullish breakout.
KEY PRICE ZONES TO WATCH
Current price: 4,069
Buy order zone: 4,036
Short-term support: 4,036 – 4,045
Nearest resistance: 4,090 – 4,100
Key resistance: 4,115 – 4,125
Sell price reaction zone: 4,155 – 4,165
Strong support: 3,960 – 3,970
Bullish continuation target: 4,155 – 4,165
Invalidation for short-term bullish view: Below 4,036
TRADING SCENARIOS
Buy Scenario – Priority Recovery View
If gold continues to hold above the 4,036 buy order zone, I will watch for a bullish continuation setup.
Buy Zone: 4,036 – 4,045
Entry: Bullish rejection, liquidity sweep, lower-timeframe bullish CHoCH, or strong bullish displacement from the buy zone
SL: Below 4,036 or below the nearest swing low
TP1: 4,090 – 4,100
TP2: 4,115 – 4,125
TP3: 4,155 – 4,165
Breakout Buy Scenario
If gold breaks and holds above 4,100, buyers may continue pushing price toward the higher resistance zone.
Buy Condition: Clean breakout above 4,100, followed by retest and bullish confirmation
Target: 4,115 – 4,165
Sell Scenario – Reaction From Resistance
Sell is not the first view while gold stays above 4,036. However, if price reaches 4,115 – 4,165 and shows rejection, a short-term pullback may appear.
Sell Zone: 4,115 – 4,165
Entry: Bearish rejection, failed breakout, or lower-timeframe bearish CHoCH
TP1: 4,090
TP2: 4,045
TP3: 4,036
Invalidation: If price breaks and holds above 4,165, the sell reaction idea becomes weaker.
MY VIEW ON GOLD
My current view for gold is short-term bullish recovery while price holds above 4,036.
The chart has improved after the bounce from strong support, and buyers are now trying to build a cleaner continuation structure. But the real test is not the current price. The real test is how gold reacts around 4,100 and 4,115 – 4,125.
If buyers break these levels with strength, gold may continue toward the 4,155 – 4,165 sell reaction zone. But if rejection appears there, the market may pull back again to retest the buy order area.
For now, gold is recovering — but the next resistance will tell us whether buyers are truly in control.
Do you think gold can break above 4,125 and continue toward 4,165, or will sellers defend the resistance again?
Long 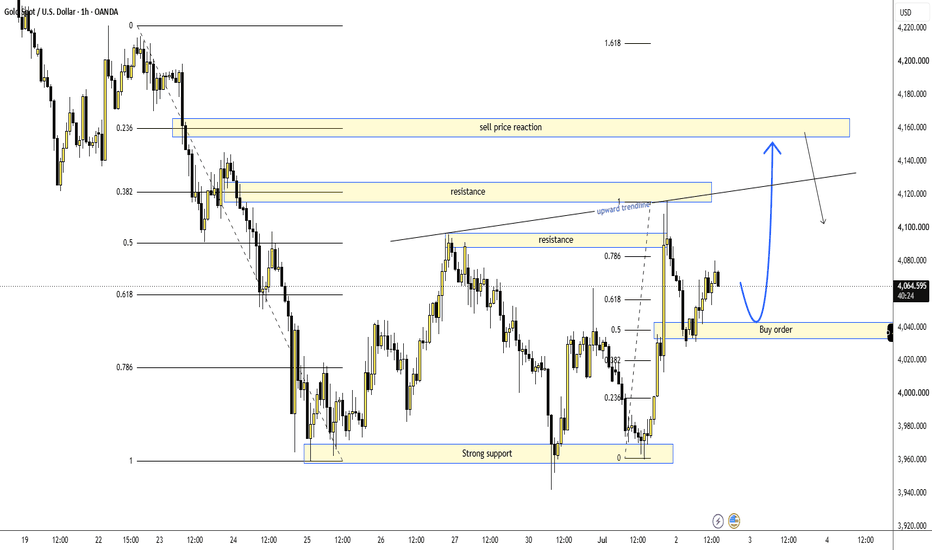
Short 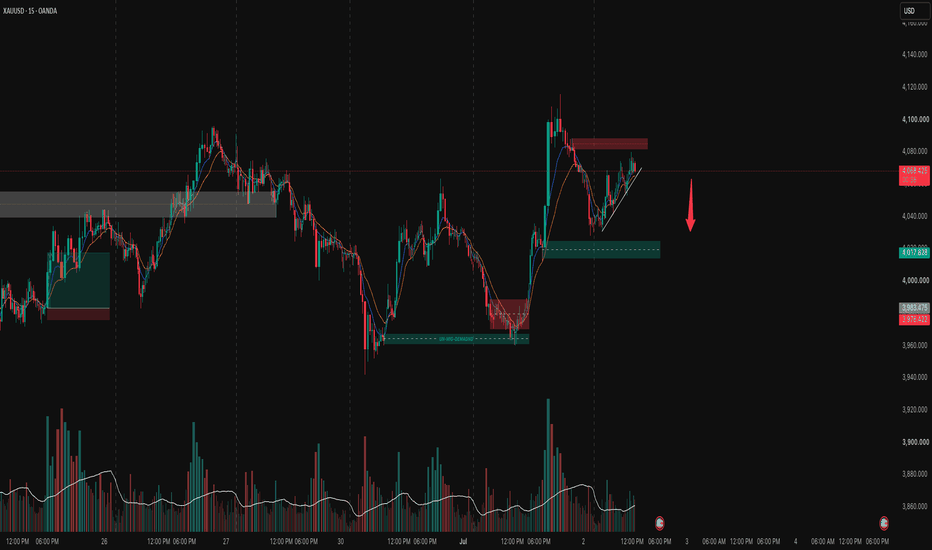
Instrument: XAUUSD (Gold/USD)Instrument: XAUUSD (Gold/USD)
Timeframe: H1
Main Bias: Bullish (short-term) — market structure shifted from bearish to bullish after a ChoCH, currently in a corrective pullback before continuation to the upside.
Core Idea: Price swept liquidity within the Accumulation zone (3,980 - 4,090), printed a ChoCH breaking the prior bearish structure, then confirmed with a bullish BOS. Price then rallied into the Order Block zone, leaving behind an unfilled FVG above. Price has since pulled back in a rising Correction channel and is now retesting the Order Block, looking for a continuation entry toward the FVG.
Liquidity Focus:
Sell-side liquidity already swept at the Accumulation low (~3,980) and the Correction low (~3,920)
Buy-side liquidity resting above the FVG zone (~4,180 - 4,200), acting as the draw on liquidity
Main Zone:
Order Block (key support/demand zone): 4,080 - 4,100
FVG (target/resistance zone): 4,165 - 4,200
Invalidation: H1 candle close below the Order Block low (~4,080), or a break of the Correction Long 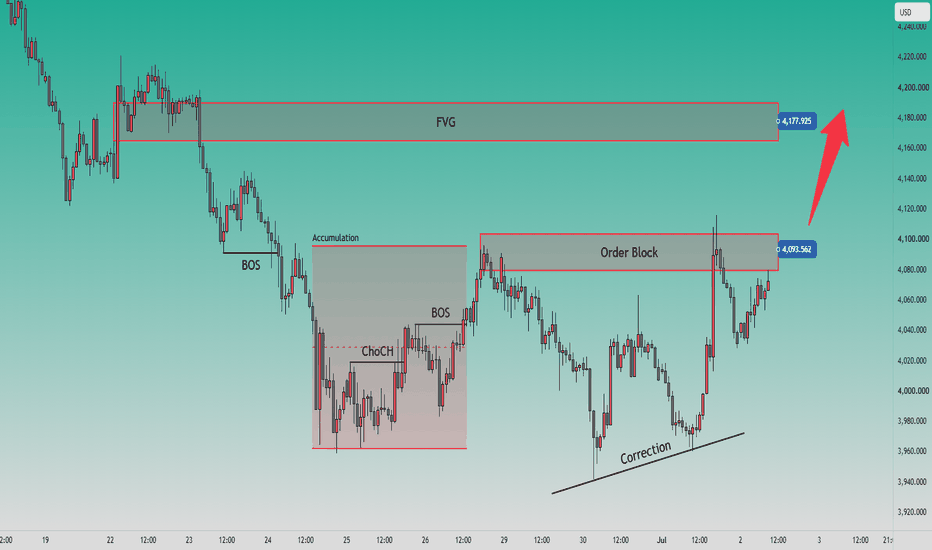
Brian XAUUSD - Gold creates bullish wave aheadBRIAN XAUUSD – GOLD BUILDS A BULLISH WAVE AHEAD OF NFP
Gold is building a stronger bullish wave after reclaiming the lower value area and pushing back above the 4,025 buy zone. The move shows that buyers are no longer passive. Price has shifted from lower-value compression into a recovery structure.
However, NFP is approaching, so this is not a market to chase blindly. Liquidity can expand fast, and false breaks are possible around major Volume Profile levels.
Technical structure
On the H1 chart, gold has reacted strongly from the lower base and is now holding above the Buy zone POC around 4,025.
This zone is the main area I am watching. As long as price stays above 4,025, the bullish recovery remains valid and gold can continue pushing towards the Sell zone VAH around 4,099.
Above 4,099, the next major upside target is the POC Sell Swing around 4,193. This is the stronger resistance where sellers may defend again, especially before or after NFP volatility.
Important zones
Buy zone POC: 4,025
Main support and preferred buy-reaction area.
Sell zone VAH: 4,099
First major resistance if the bullish wave continues.
Done Test POC: 4,115 - 4,120
Short-term reaction zone above the current structure.
POC Sell Swing: 4,193
Major Volume Profile resistance and upside liquidity target.
Trading scenario
Buy reaction from Buy zone POC 4,025
Entry:
Look for buy positions only if price pulls back into 4,025 and shows clear bullish rejection.
Stop Loss:
Below the Buy zone POC or below the local swing low.
Take Profit:
TP1: 4,099
TP2: 4,115 - 4,120
TP3: 4,193 if bullish momentum expands
This setup follows the current bullish wave, but confirmation is important because NFP can create sharp liquidity sweeps.
Final view
Gold is showing a bullish recovery structure, and the 4,025 zone is now the key level buyers need to defend.
If price holds above 4,025, the next upside path remains open towards 4,099 and possibly 4,193.
If 4,025 fails, the bullish wave weakens and gold may rotate back into lower value before NFP.
For now, I prefer buying confirmed pullbacks, not chasing candles into resistance.
Trade the retest. Respect the volume zone. Long 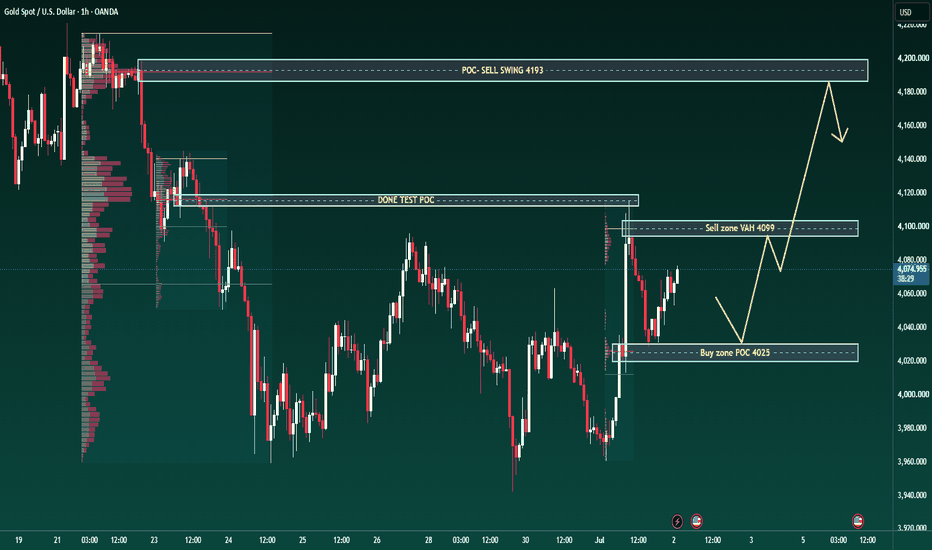
 Long
Long
XAUUSD: 4,085 Is the Trap Zone XAUUSD: 4,085 Is the Trap Zone
Market Context
Gold is rebounding from the lower side of a descending channel, but the overall trend is still not fully bullish. Buyers are pushing price higher, yet sellers are likely waiting near 4,085. If this level holds, the rebound may turn into a sell setup.
Technical Structure
Price is around 4,062, approaching the liquidity sell zone at 4,080 - 4,085 and the channel resistance. This is a key decision area.
Support sits at 4,016, the liquidity buy zone and near the short-term trendline. If price rejects from 4,085, this becomes the first downside target.
Below that, the next demand zone is 3,960 - 3,970. A break of 4,016 could push price toward this area.
Key Levels
Current Price: 4,062
Liquidity Sell Order: 4,080 - 4,085
Liquidity Buy Order: 4,016
Lower OB Zone: 3,960 - 3,970
Bullish Confirmation: Above 4,085
Bearish Continuation: Below 4,016
Trading Plan
Sell Scenario
Entry: 4,080 - 4,085 after rejection
Stop Loss: Above 4,105
TP1: 4,040
TP2: 4,016
TP3: 3,970
Condition: Price fails at resistance and shows bearish momentum.
Buy Scenario
Entry: Above 4,085 after breakout and retest
Stop Loss: Below 4,040
TP1: 4,120
TP2: 4,160
TP3: 4,200
Condition: Strong breakout and hold above resistance.
Alternative Buy
Entry: 4,016 after bullish reaction
Stop Loss: Below 3,970
TP1: 4,040
TP2: 4,062
TP3: 4,085
Condition: Price holds support and shows buying strength.
Breakdown Sell
Entry: Below 4,016 after breakdown
Stop Loss: Above 4,040
TP1: 3,970
TP2: 3,950
TP3: 3,920
Condition: Support fails and bearish momentum continues.
Overall Bias
Gold is still inside a bearish channel. The 4,080 - 4,085 zone is key.
Rejection here favors a move down to 4,016 or lower. A breakout above confirms stronger recovery.
Best approach: wait for reaction at 4,085.
Short 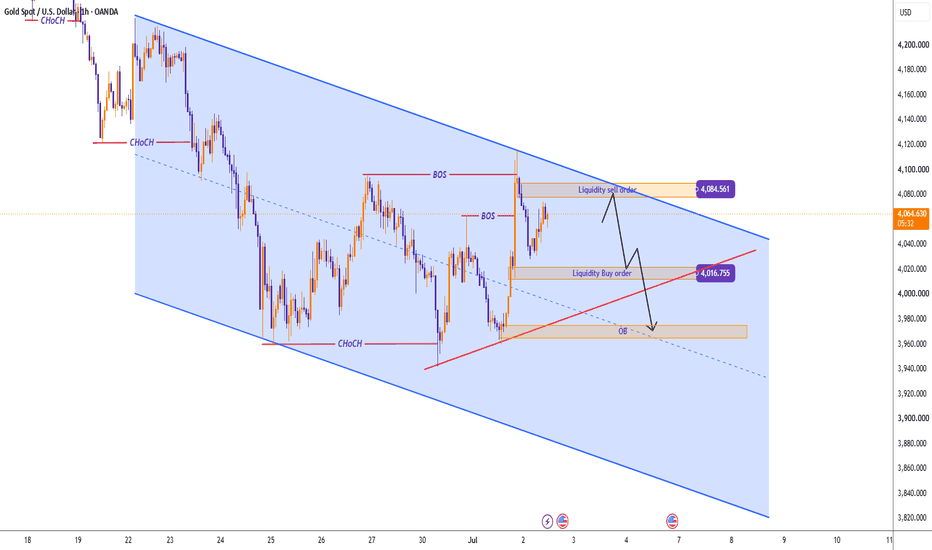
**XAU/USD Technical Analysis: ### **Market Overview (45-Minute Timeframe)**
The XAU/USD 45-minute chart continues to display a constructive bullish structure after a strong recovery from the 3,955 support zone. Price has established a sequence of higher lows and higher highs, confirming that buyers remain in control over the short term. The recent impulsive rally above the dynamic trend indicator suggests renewed buying interest following the previous correction.
At the time of analysis, Gold is trading around **4,062**, consolidating beneath a nearby resistance area after a sharp upward move. This pause appears to be a healthy retracement rather than a confirmed trend reversal.
### **Trend Structure**
The dynamic trend ribbon has shifted back to green, indicating that bullish momentum has regained strength. Price remains above the support band, which is acting as dynamic support and continues to guide the short-term uptrend.
The multi-timeframe trend panel further supports the bullish outlook:
* **5-Minute:** Bullish
* **15-Minute:** Bullish
* **45-Minute:** Bullish
* **4-Hour:** Bullish
* **Daily:** Bearish
This alignment suggests that although the higher daily timeframe remains under broader bearish pressure, intraday momentum strongly favors buyers.
### **Key Resistance Zone**
The immediate resistance lies around **4,070–4,080**, where previous selling pressure emerged. A decisive breakout above this region would likely trigger another bullish impulse toward the next psychological resistance levels near **4,100** and potentially higher.
Failure to clear this resistance could result in short-term consolidation before another breakout attempt.
### **Support Levels**
Immediate support is located around **4,045**, which coincides with the rising dynamic support ribbon.
A deeper pullback could test the **4,022** support zone. As long as price remains above this level, the bullish market structure remains intact.
### **Trading Outlook**
The current price action favors a **buy-on-dips** strategy while the market remains above dynamic support. Minor pullbacks toward the support ribbon may provide opportunities for buyers to re-enter the trend.
A confirmed break above **4,070–4,080** would strengthen bullish momentum and increase the probability of a continuation toward **4,100**. Conversely, a break below **4,022** would weaken the current bullish structure and could open the door for a larger corrective decline.
### **Conclusion**
XAU/USD remains technically bullish on the intraday timeframes despite the daily chart maintaining a bearish bias. Buyers continue to defend higher support levels, and the overall structure favors further upside as long as price holds above the dynamic support zone. Traders should closely monitor the resistance around **4,070–4,080**, as a successful breakout could signal the next leg of the bullish trend.
Short 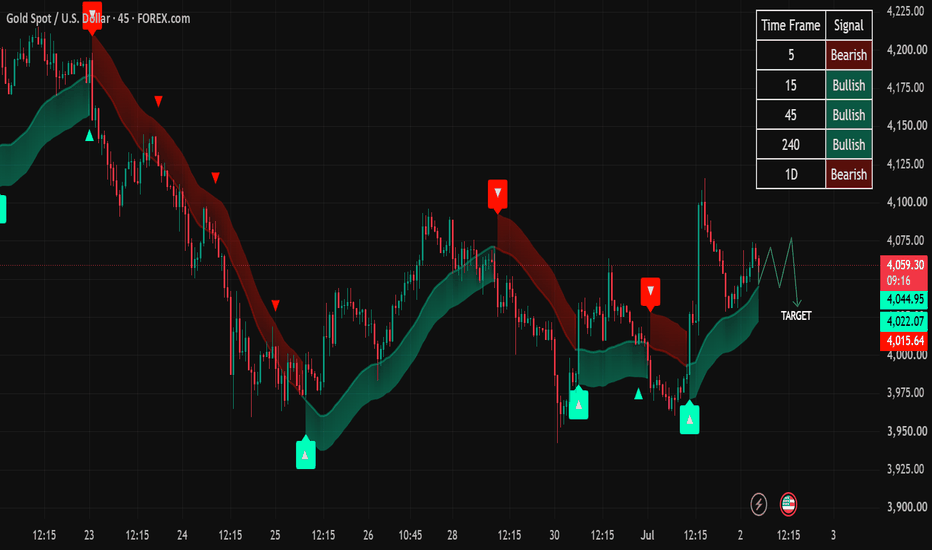
Long 
XAU Bullish Recovery Structure, Buy From FVG Remains PriorityXAUUSD — Bullish Recovery Structure, Buy From FVG Remains Priority
Gold is trading around $4,069 after reacting strongly from the lower support liquidity zone. Price has created a short-term CHoCH and is now showing signs of recovery, with buyers trying to build a bullish continuation structure.
From an SMC perspective, gold has already swept lower liquidity, defended the demand area, and started to form higher reactions from the bottom. The current move suggests that buyers may continue to control the short-term structure as long as price holds above the $4,003–$4,010 FVG buy zone.
The main buy area to watch is $4,003–$4,010. If gold pulls back into this FVG and confirms bullish reaction, the next upside targets are the day high around $4,116, buy-side liquidity near $4,144, and the higher OB sell zone around $4,180–$4,186.
Buy setup 1
Condition:
Gold pulls back into the FVG buy zone around $4,003–$4,010 and forms bullish rejection with lower timeframe MSS / CHOCH.
Entry: $4,003–$4,010
SL: below $3,960
TP1: $4,069
TP2: $4,116
TP3: $4,144
Buy setup 2
Condition:
If gold breaks above the day high around $4,116 and retests it as support, bullish continuation remains valid.
Entry: above $4,116 after breakout retest
SL: below $4,070
TP1: $4,144
TP2: $4,180–$4,186
TP3: $4,222
Sell setup
Condition:
Selling is not the priority. A sell setup is only valid if gold reaches the OB sell zone around $4,180–$4,186 and shows clear bearish rejection with MSS / CHOCH.
Entry: $4,180–$4,186 after rejection
SL: above $4,222
TP1: $4,144
TP2: $4,116
TP3: $4,069
Key levels
Current price area: $4,069
FVG buy zone: $4,003–$4,010
Support liquidity zone: $3,955–$3,970
Day high: $4,116
Buy-side liquidity: $4,144
OB reaction zone: $4,180–$4,186
Higher buy-side liquidity: $4,222
Bullish continuation confirmation: clean break above $4,116
Bullish invalidation: clean 2H close below $3,960
My current view is that gold is building a bullish recovery structure after defending the lower liquidity zone. The Prime Gold plan is to wait for price to pull back into the FVG buy zone, confirm bullish structure, then follow the recovery toward the upper liquidity and OB zones.
No confirmation, no trade.
Long 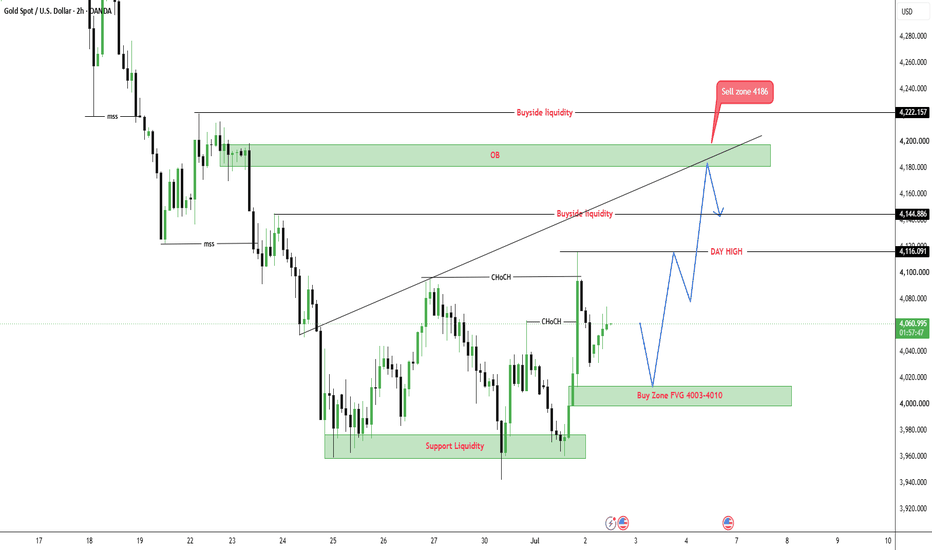
XAUUSD: NFP DAYHi, I'm Maicol, an Italian trader.
I've been studying Gold since 2019.
My trading approach focuses on swing trading and intraday setups.
I need your support.
Please leave a like and follow my profile.
It may seem like a small gesture, but it makes a big difference to my work.
Make sure to read the full description to understand today's trading plan.
Don't focus only on the chart. Thank you.
🌞 GOOD MORNING EVERYONE 🌞
🔍 Gold Price Action 🔍
Yesterday, Gold started moving higher shortly before the ADP release.
After that, it paused and then gained further bullish momentum during the New York session, helped by Waller's speech, reaching the intraday structural area that triggered the last daily break.
After yesterday's weak ADP report, it's reasonable to expect a weaker NFP as well, which could support another bullish move in Gold in the short term.
Everything will depend on today's data. Based on the outcome, I'll look for the best positioning.
That said, the daily trend is still bearish, and the main higher-timeframe resistance remains around 4200.
It's impossible to predict with certainty, but this is the scenario I'm considering:
🟢 50% → NFP below 110K (bullish for Gold)
🟡 35% → NFP between 110K and 140K (mixed reaction, depending on unemployment and wages)
🔴 15% → NFP above 140K (bearish for Gold)
Also, don't forget the other two important figures:
Unemployment Rate: higher than expected = bullish for Gold.
Average Hourly Earnings: slower wage growth = bullish for Gold.
Faster wage growth could offset a weak NFP and limit or even reverse a bullish reaction.
Following yesterday's ADP report, I think the probabilities slightly favor an NFP that supports Gold.
However, wage data could be the deciding factor.
See you all at 14:00.
🔔 Turn on notifications so you don't miss any updates!
📬 If you have any questions, feel free to message me. I'll be happy to help.
🔍 Reminder 🔍
I avoid trading during the Asian and London sessions.
My main focus is on the high-impact news releases at 8:30 AM ET and the New York session open at 9:30 AM ET.
In the meantime, I wish everyone a great day.
HAPPY TRADING
MANAGE YOUR RISK
BE PATIENT MASON XAUUSD – Trendline Break Confirms Bullish Recovery
XAUUSD is trading around 4,070 after breaking above the descending trendline and recovering above the Ichimoku structure. This breakout changes the short-term structure from bearish pressure into a bullish recovery phase.
The priority view is buy on pullback, as long as gold continues to hold above the broken trendline and the nearest support zone.
Technical View
Gold has broken above the descending trendline that previously capped the upside move. This is an important shift because the market is no longer respecting the same bearish pressure line.
Price is also trading above the Ichimoku support area. The Ichimoku lines are now below price, which means they may act as dynamic support if gold pulls back. As long as price stays above this structure, buyers still have better control in the short term.
The current buy zone around 4,060–4,075 is important because price is testing this area after the breakout. If gold holds here and forms a higher low, the bullish continuation scenario remains valid.
The first upside liquidity area is around 4,114. A clean break above this level may open the way toward Target 1 near 4,155–4,165, which aligns with the Fibonacci 1.618 extension.
If buying pressure continues, the next major liquidity area is around 4,200–4,215, followed by Target 2 near 4,275–4,280, close to the Fibonacci 2.618 extension.
Key Zones
Current price: 4,070
Buy zone: 4,060–4,075
Nearest support: 4,028
Ichimoku support area: 4,016–4,028
Short-term liquidity: 4,114
Target 1: 4,155–4,165
Higher liquidity: 4,200–4,215
Target 2: 4,275–4,280
Invalidation: below 4,009
Trading Plan
Buy Priority: 4,060–4,075
Condition: wait for bullish rejection, higher low formation, or price holding above the broken trendline and Ichimoku support.
SL: below 4,009
TP1: 4,114
TP2: 4,155–4,165
TP3: 4,200–4,215
Final target: 4,275–4,280
Alternative Scenario
If gold breaks above 4,114 directly, wait for a retest of this level as support before looking for continuation toward Target 1.
Sell View
Sell is not the priority while price stays above the broken trendline and Ichimoku support. A sell setup only becomes safer if gold loses 4,028 and breaks back below the Ichimoku structure.
Final View
Overall, gold has confirmed a short-term bullish recovery after breaking the trendline. The cleaner plan is to wait for price to hold the buy zone, then follow the upside structure toward 4,114, 4,155, and potentially 4,275.
Will gold hold the buy zone and continue toward Target 1, or retest the Ichimoku support first?
Long 
Gold Just Tested The Same Wall again And Failed againGold Just Tested The Same Wall again And Failed again: Now NFP Decides Which Way This Range Finally Breaks
Second attempt, second rejection. Gold pushed back into the 4,060 to 4,097 supply for the second time this week, could not hold above it, and pulled right back into the range. That is the headline. But look closer and there is a more interesting story underneath the failure, because this rejection did not look like the last one, and today's jobs report is exactly the kind of catalyst that ends a standoff like this.
TWO FAILURES, BUT NOT THE SAME KIND OF FAILURE
The pattern on the chart is now unmistakable. Price has made repeated attempts at the same H4 supply and been turned back both times. On the surface that reads as pure bearish control, the wall holding, the range capped. But the structure panel tells a different story underneath the price action. 15m, 1H and 4H have all flipped bullish, three timeframes now aligned to the upside, with only the 1D and 1W still bearish. That is a real shift from where this bounce started, when only the fastest timeframe had turned. The market is not fading from this level, it is building repeated pressure against it. Failed attempts that keep coming back stronger are usually not a sign of exhaustion, they are a sign of a level being tested for weakness.
So the fair read is this. Good news, gold keeps finding buyers and keeps making fresh attempts higher. Bad news, none of those attempts have closed above the wall, and until one does, this is still a rangebound market going nowhere on a net basis.
THE RANGE HAS TO BREAK, ONE WAY OR THE OTHER
This is the point worth taking seriously. Two rejections at the same level inside a tightening structure is not a market that stays quiet much longer. It needs a clean H4 or daily close on one side of 4,060 to 4,097 to actually resolve. Close above it and the path opens toward the next supply at 4,178 to 4,195, with the bigger daily wall at 4,236 to 4,363 still the level that would flip the higher timeframe picture entirely. Close below it and reject the range again, and the move points back toward 4,000 and the weekly demand at 4,059 to 3,884 underneath it.
There is no edge in guessing which side wins before the close. The edge is in waiting for the close and trading the side that confirms.
WHY TODAY IS THE DAY THIS LIKELY GETS DECIDED
The June jobs report lands today, and it is arriving into a market that is already coiled at a decision point. Current market pricing is centered around a payrolls print near 100,000 with the unemployment rate holding close to 4.3 percent, a moderate cooldown from May's much stronger number. That framing matters. A print that comes in hot, anywhere close to or above May's pace, reinforces the hawkish Fed narrative that has capped gold all month, strengthens the dollar, and most likely produces the third rejection at this same wall. A soft miss does the opposite, takes pressure off yields, and gives the three already bullish intraday timeframes the fuel to finally force a close above 4,097.
Either way, expect the move to be sharp. A single data point deciding a market that has failed twice at the same level is a textbook setup for a fast, high volatility resolution rather than another quiet range day.
THE PLAN
Do not anticipate the break, confirm it. Watch for a clean close, H4 or daily, above 4,097 as the first sign this finally graduates into something bigger, and equally respect a close back below the range as confirmation the sellers still control the bigger picture. The higher timeframe bias remains unresolved by design, 1D and 1W bearish, 15m, 1H and 4H bullish, and that split only ends when price commits. Size down into the release, let the number and the reaction do the work, and trade the outcome, not the anticipation. Long 
Gold Rebound Slows as Sellers Watch $4,060Gold has bounced from the $3,950–4,000 area, but the recovery is now slowing near an important resistance zone. Buyers have reacted, but they still need stronger confirmation to shift the short-term structure.
For now, the setup still favours selling into resistance unless gold breaks clearly above $4,060.
Trade Setup:
Sell Zone: $4,040 – $4,060
Stop Loss: $4,095
Take Profit 1: $4,000
Take Profit 2: $3,950 Short 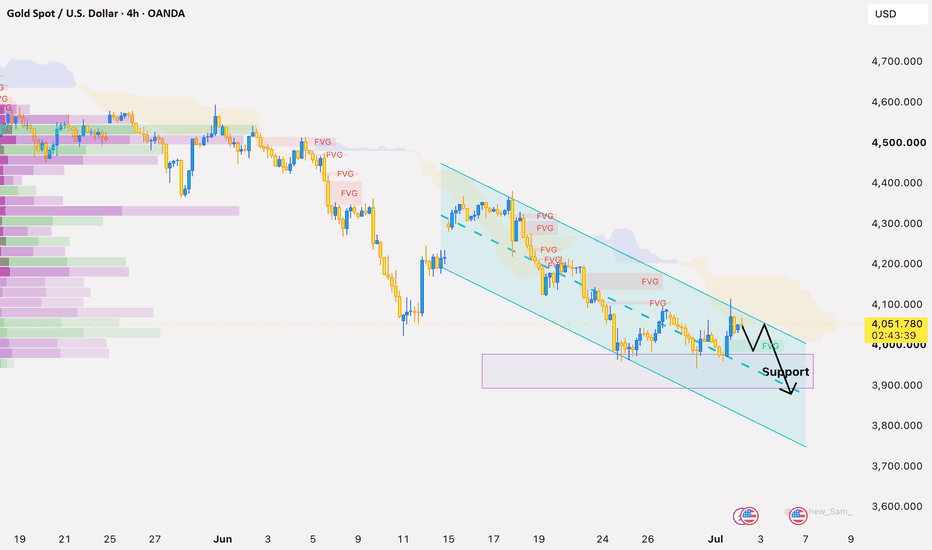
XAUUSD Change of Character with FSF StructureThe market has broken the previous high without creating a new low, which signals a clear Change of Character (CHOCH). This suggests that the market is beginning to shift its direction toward the upside.
After breaking the previous high, price is now returning for a retest. At the same time, the previous supply has already been reduced by nearly half, increasing the probability that demand will take control from this area.
My main focus is the marked reversal zone. I expect the market to spend some time moving in a zig-zag structure before continuing higher. This follows the FSF (Fast–Slow–Fast) concept , where the market first makes a strong impulsive move, then slows down during accumulation, and finally continues with another fast expansion.
If the market forms a Bullish Engulfing, Positive CCP, or any strong bullish confirmation candle inside the reversal zone, it could be the confirmation for the next leg to the upside.
For now, I'm waiting for confirmation rather than entering early. The structure has already shifted in favor of the buyers, and the reaction from the reversal zone will decide whether the next bullish move begins.
Let's see how the market reacts. Long 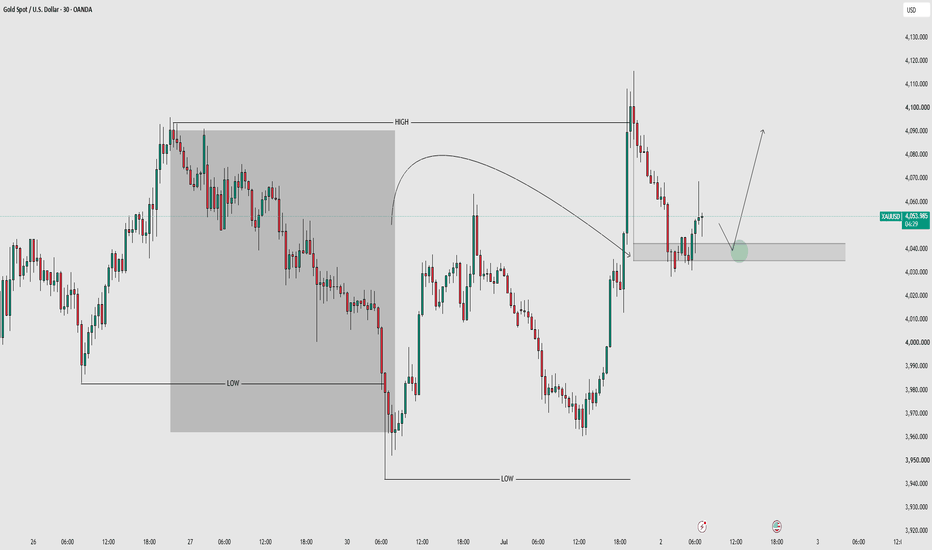
Long 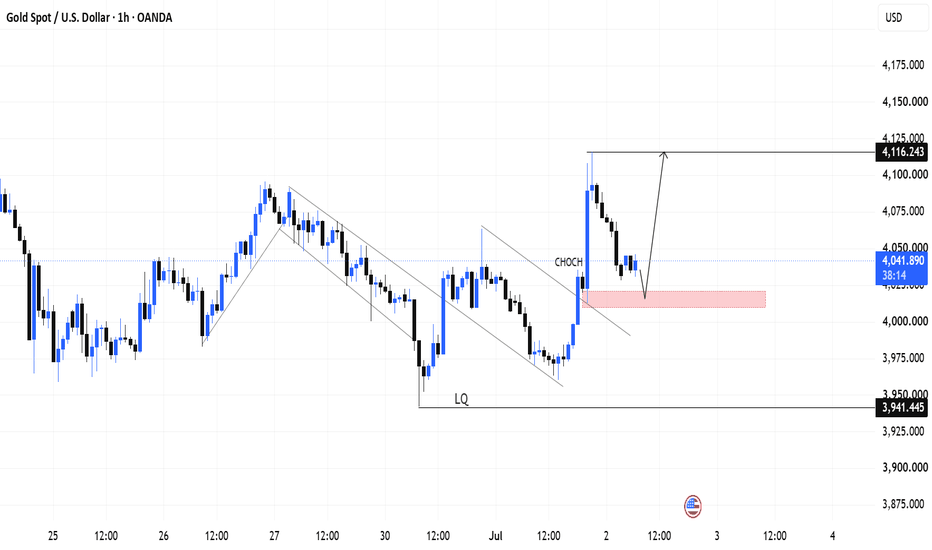
Gold Analysis & Trading Strategy | July 1-2✅ 4-Hour Trend Analysis
From the 4-hour timeframe, the current price has already moved back above MA5 (4037), MA10 (4025), and the BOLL midline / MA20 (4028), indicating that short-term bullish momentum has clearly strengthened. The market has shifted from a low-level weak bearish structure into a rebound recovery structure.
On the 4-hour chart, the upper Bollinger Band is around 4105, while the previous high resistance is near 4115. This shows that after the rapid rally, gold has already entered a short-term resistance area. Therefore, we should not blindly chase long positions at the current level. The key is to watch whether the 4065–4050 area can turn from previous resistance into support.
✅ 1-Hour Trend Analysis
From the 1-hour chart, gold previously broke strongly above MA5, MA10, MA20 / BOLL midline with a large bullish candle, reaching a high of 4115.71, which indicates that short-term buying momentum increased rapidly.
At present, the price has pulled back to the previous key resistance area around 4065. This is currently the key battleground between bulls and bears. If the price can hold above 4065–4070, there is still a chance for gold to continue testing 4080 → 4090 → 4105 in the short term. However, if the price breaks below 4065 and further falls below 4050, it would indicate that the short-term rebound momentum is weakening, and the market may enter a corrective pullback phase.
🔴 Key Resistance Levels
● 4080–4096: Short-term resistance
● 4115–4124: Strong resistance zone
● 4150–4185: Structural resistance zone
🟢 Key Support Levels
● 4065–4050: Short-term key support zone
● 4037–4028: First support zone below
● 4016–4004: Defensive support zone for pullbacks
● 3975–3943: Key previous-low defense zone
✅ Trading Strategy Reference
🔰 Bullish Strategy: Wait for a pullback that holds before entering short-term longs
👉 Aggressive buy zone: 4065–4050
👉 Conservative buy zone: 4037–4028
🎯 Targets: 4080 → 4090 → 4105
After breaking above 4105, gold may continue toward 4115 → 4124
🔰 Bearish Strategy: Watch for short opportunities at resistance
👉 Sell zone 1: 4090–4105
👉 Sell zone 2: 4115–4124
🎯 Targets: 4080 → 4065 → 4050
If gold breaks below 4050, it may continue toward 4037 → 4028
📍 Reasons:
● After the rapid short-term rally, gold is already close to the 4-hour upper Bollinger Band resistance.
● The 1-hour chart pulled back after reaching 4115.71, showing clear selling pressure above.
● If gold fails to regain and hold above 4105–4115, it can easily form a rally-and-drop structure.
🙌 If you find my analysis helpful, please like, share, and stay tuned for future updates. Your support is my motivation to continue sharing professional insights. Wishing everyone smooth trading and steady profits! Short 
Short