XAUUSD: 4,163 Retest Could Trigger Further DeclineXAUUSD continues to trade clearly within a downtrend channel that has persisted since early May. Notably, selling pressure emerges quickly whenever the price rallies to the channel's upper boundary, resulting in a series of lower highs. Currently, the price is hovering around the 4,060 level—situated within the bearish structure—with no signs yet that the bulls have regained control.
On the chart, the 4,163.6 level stands out as key resistance, representing the confluence of the downtrend channel's upper boundary and an overhead supply zone. If the price rallies to this area but fails to break through, the most likely scenario is a rejection followed by a resumption of the downward trend. Given the prevailing bearish trend, current short-term rallies are best viewed as technical corrections rather than genuine trend reversals.
Entry Focus: Prioritize SELL positions if the price rebounds to the 4,150–4,163 range and shows clear signs of rejection (e.g., a rejection candle).
Target: 3,885.0
Invalidation: The bearish scenario is invalidated if the price closes strongly above the 4,163–4,180 zone and decisively breaks out of the channel's upper boundary.  Short
Short
Gold Bounced Off Demand ,What Comes NextGold Bounced Off Demand, Hit the First Wall, and Now 4,097 Decides What Comes Next
The bounce off the weekly demand did its job. Gold swept the lows below 4,000, found buyers exactly where the map said they would be, and pushed back up into the first real test. That test is right here, right now. Price has rallied into the H4 supply at 4,060 to 4,097, swept through the lower half of it, and is now stalling at the top of that band. One level decides the next move: 4,097. Above it or below it, the trade is clean.
THE BOUNCE THAT WORKED, AND ITS LIMITS
Price swept the weekly demand at 4,059 to 3,884, reacted sharply, and the intraday timeframes responded immediately. The 15m and 1H are both bullish, the first two timeframes to break out of the Full Bear alignment that had dominated this entire correction. That is the footprint of real buying pressure at a real level, not just short covering noise. The bounce is legitimate.
But the H4 is still bearish. The 1D is still bearish. The 1W is still bearish. Three of the five timeframes that matter most are still pointing down, and the overall structure remains a correction until something structural changes. So this is a bounce inside a bearish correction, which means every level overhead is resistance until proven otherwise, and the burden of proof sits firmly on the buyers.
THE LEVEL THAT DECIDES THIS WEEK
The H4 supply at 4,060 to 4,097 is the first gate, and price is sitting right at the top of it after sweeping through it. Watch 4,097 closely. A clean break and hold above it opens the path toward the second supply cluster at 4,178 to 4,195, the next shelf the bounce has to clear before it can even think about the daily supply wall at 4,236 to 4,363. That daily supply is the level that would make this bounce structurally meaningful, and it is still well overhead.
If 4,097 holds as resistance and price rolls back from here, the bounce fades into the demand zone. Support sits at 4,000 and the upper edge of the weekly demand at 4,059. A clean rejection at the H4 supply keeps the lower high sequence intact and puts the bears back in control. That is still the higher probability path with three bearish HTF timeframes above.
WHAT WOULD CHANGE THE BIAS
Nothing changes on the higher timeframe until one of two things happens. Either the daily supply at 4,236 to 4,363 is reclaimed and held, which flips the daily structure and converts this bounce into a genuine reversal. Or price loses the floor at 3,884, which voids the bounce thesis entirely and opens the next leg lower toward the monthly demand at 3,453 to 3,281. Everything between those two extremes is still the range, and the range belongs to neither side cleanly.
The honest read is that confirmation of any reversal has not arrived. The demand zone held, the intraday timeframes have lifted, and the bounce is real, but a bounce is not a bottom until the structure above it breaks. Right now the H4 supply is the structure above it, and it has not broken. Until 4,097 gives way and holds on a close, every long here is a counter trend trade with a defined ceiling, not a trend change.
Short 
XAUUSD: New Week, Same Sell-on-Rally Story XAUUSD: New Week, Same Sell-on-Rally Story
Market Context
Gold starts the new week with a weak recovery attempt after ending its two-day rebound from the seven-month low. Sellers are returning as the market enters NFP week, while the US Dollar is still supported by renewed Middle East tension and expectations that the Fed may keep a hawkish tone.
The broader message remains bearish. With RSI weakening and the daily chart still watching a possible Death Cross signal, gold remains a sell-on-rally market unless buyers can reclaim the key resistance zone with real strength.
Technical Structure
Gold is trading around 4,068 after recovering from the lower support area, but the structure is still fragile. The bounce is visible, yet price has not reclaimed enough resistance to confirm a true reversal.
The key zone above is 4,070 - 4,095. This is where buyers must prove strength. If gold fails to hold above this area, the recovery may fade quickly and sellers can return.
The major sell reaction zone is around 4,120 - 4,140. If price pushes into this area and shows bearish rejection, the main bearish trend may continue for another leg lower.
On the downside, 3,980 - 4,020 is the key support reaction area. Losing this zone would weaken the rebound and open the path toward lower levels.
Key Levels
Current Price: 4,068
Reclaim Zone: 4,070 - 4,095
Major Sell Reaction Zone: 4,120 - 4,140
Key Support Reaction Area: 3,980 - 4,020
Breakdown Zone: Below 3,980
Weekly Bearish Target: 3,950
Bullish Confirmation: Above 4,140
Trading Plan
Buy Scenario: Rebound Continuation
Entry: Above 4,095 after bullish confirmation
Stop Loss: Below 4,020
TP1: 4,120
TP2: 4,140
TP3: 4,180
Conditions: Price must reclaim 4,070 - 4,095 with strength, hold the retest, and form a clear bullish CHOCH. Buyers must defend the 3,980 - 4,020 support area. This is only a corrective rebound setup while gold remains below the higher sell zone.
Sell Scenario: Sell From Resistance
Entry: 4,120 - 4,140 after bearish confirmation
Stop Loss: Above 4,165
TP1: 4,095
TP2: 4,020
TP3: 3,980
Conditions: Price pushes into the major sell reaction zone but fails to continue higher. Bearish rejection appears, buyers lose momentum, and price fails to hold above 4,140. This remains the priority setup if gold continues to trade like a sell-on-rally market.
Breakdown Sell
Entry: Below 3,980 after confirmed breakdown and retest
Stop Loss: Above 4,020
TP1: 3,950
TP2: 3,920
TP3: 3,900
Conditions: Price loses the 3,980 - 4,020 support area, retest fails, and bearish momentum returns. This would confirm that the recovery has faded and sellers are ready to extend the weekly downtrend.
Overall Bias
The weekly outlook remains bearish unless gold can reclaim 4,120 - 4,140 with strength. The current rebound is not enough to call a reversal yet.
For this week, the main plan is to watch for sell reactions from 4,120 - 4,140. If gold fails there, the downside path back toward 4,020, 3,980 and 3,950 remains open.
Only a strong breakout above 4,140 would shift the short-term view toward a deeper recovery.
New week, same question: will buyers reclaim 4,140, or will sellers use this rebound to push gold lower again?
Long 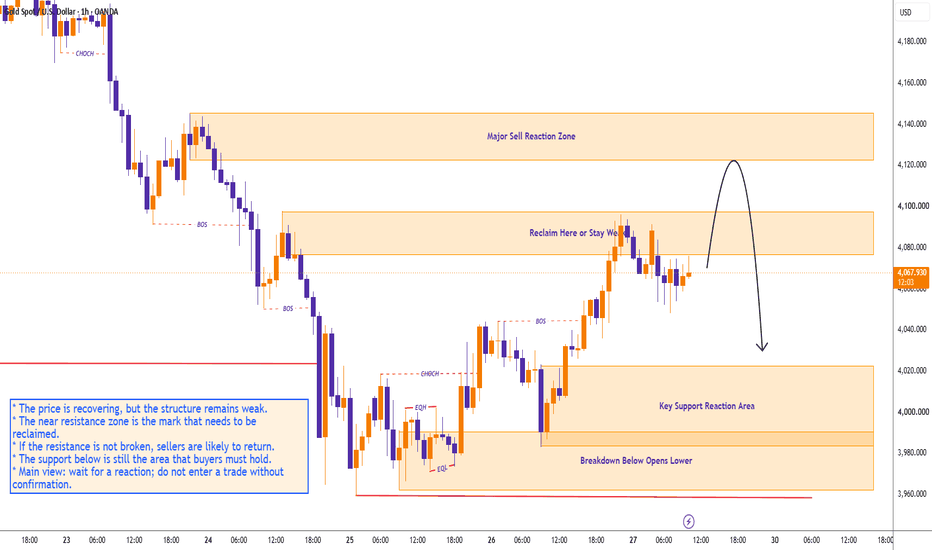
Gold Holds $4,050 as Buyers Attempt RecoveryGold is trying to stabilise after bouncing from below $4,000. The key support now sits around $4,040–4,050, where buyers need to keep control to extend the rebound.
Softer USD and lower yields after US PCE data have reduced pressure on gold, giving room for a short-term recovery attempt.
Trade Setup:
Buy Zone: $4,040 – $4,050
Stop Loss: $4,000
Take Profit 1: $4,080
Take Profit 2: $4,110 Long 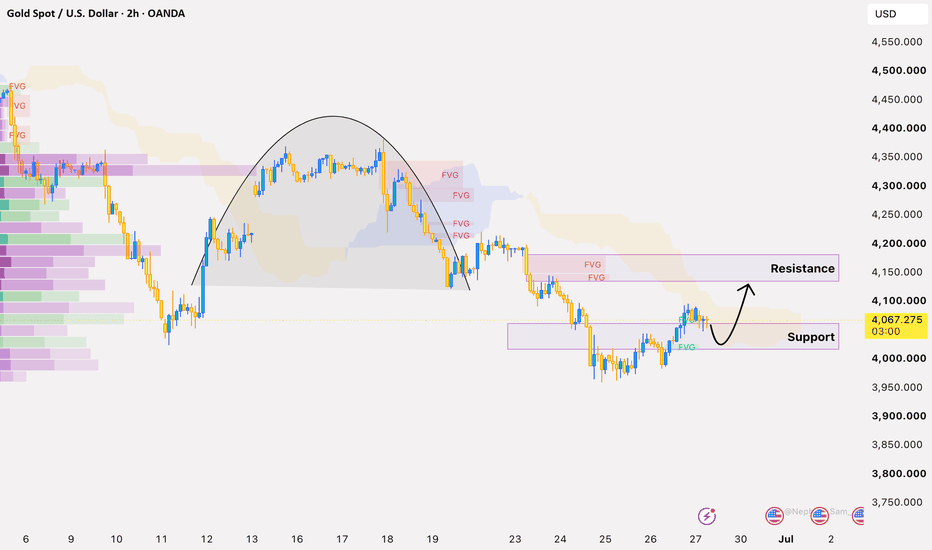
Short 
Gold Analysis & Trading Strategy | June 29🌐Hello traders! I’m Jack Blackwell, with 15 years of experience in analysis and trading in the futures and forex markets. Below are my technical analysis views based on the current XAUUSD (4H and 1H timeframes) chart structure.
✅ 4-Hour Trend Analysis
From the 4-hour timeframe, gold previously continued to pull back from higher levels and formed a short-term low around 3959.35, followed by a clear corrective rebound. Price is currently trading near 4081 and has moved back above the short-term moving average cluster, indicating that the short-term rebound structure is still intact.
At the same time, the 4-hour MACD green histogram continues to expand, showing that rebound momentum has not fully faded yet. However, price is already approaching the key resistance zone around 4092–4096, where the previous high resistance overlaps with short-term resistance. Only if price effectively breaks above and holds above 4096 can further upside room open up.
✅ 1-Hour Trend Analysis
From the 1-hour chart, after rebounding from the 3976 / 3959 area, gold’s short-term structure has clearly strengthened and once rallied toward the 4096 area. After that, price pulled back to around 4059 and rebounded again, suggesting that short-term bulls still have support.
The 1-hour structure is currently not a strong one-sided uptrend. Instead, it looks more like a high-level consolidation phase before choosing the next direction. As long as price holds above the 4059–4057 area or the 4040 support area, the short-term bullish structure still has a chance to continue.
🔴 Key Resistance Levels
● 4092–4096: Short-term key resistance zone
● 4110–4140: Rebound extension target zone
● 4190: Important 4-hour overhead resistance zone
🟢 Key Support Levels
● 4059–4057: First short-term support zone
● 4040–4045: Short-term structural support zone
● 4011: Intermediate support if the pullback deepens
● 3978–3959: Key lower defensive support zone
✅ Trading Strategy Reference
🔰 Short Position Strategy: Light Short at Resistance
👉 Sell Zone 1: 4092–4096
👉 Sell Zone 2: 4110–4120
🎯 Targets: 4059 → 4040 → 4011
📍 Rationale:
● Price is already approaching a key short-term resistance zone.
● 1-hour MACD momentum is showing signs of weakening.
● If 4096 cannot be effectively broken, price may easily form a pullback after a false breakout or rejection.
🔰 Long Position Strategy: Buy the Pullback
👉 Buy Zone 1: 4058–4062, watch for a pullback that holds
👉 Buy Zone 2: 4040–4045, watch for stabilization around structural support
👉 Breakout Follow-Through: If price breaks and holds above 4096 with a solid candle close, wait for a pullback confirmation before following long
🎯 Targets: 4092 → 4096 → 4110 → 4140
📍 Rationale:
● The 4-hour rebound structure is still continuing.
● Price has already moved back above the short-term moving average cluster.
● If support above 4040 remains valid, bulls still have a basis to push price higher.
⚠️ Trend Outlook
👉 If gold effectively breaks above and holds above 4096, the short-term rebound may continue to expand, with upside targets at 4110 → 4140, followed by further attention to resistance near 4190.
👉 If price remains under pressure around 4092–4096 and falls below 4040, it would indicate that the rebound rhythm is weakening. In that case, price may pull back toward 4011, or even retest the 3978–3959 support zone.
Short 
Long 
XAUUSD: The $4,000 Polarity Flip is Here!Here is a comprehensive technical analysis of XAUUSD based on your structural breakout levels.
The market is currently exhibiting high volatility around the psychologically crucial 4,000 handle, acting as a massive structural pivot. Your breakdown of the specific "if/then" breakout scenarios maps perfectly onto current market mechanics, utilizing key Liquidity Zones, Supply/Demand imbalances, and Order Blocks.
Scenario 1: The Bullish Breakout (4150 $\rightarrow$ 4183)
▲
│ (Aggressive Expansion / FVG Fill)
│
┼ ── ── ── ── ── ── ── ── ── ── ── ── ── ── ──
▲
│ (Sustained H4/D1 Candle Close Above)
The Catalyst (4,150 Break): The 4,150 zone acts as immediate overhead resistance and a cluster for buy-stop liquidity. For this move to validate, we need to see a clean H4 or D1 candle close above 4,150 to confirm a structural Shift in Market Structure (SMS) rather than a simple liquidity sweep (fakeout).
The Path to 4,183: Once 4,150 flips to support, it clears a path through a minor Fair Value Gap (FVG) left behind during recent distributions.
The Target (4,183): The 4,183 target aligns precisely with a previous daily Rejection Block/Supply Zone. Expect heavy profit-taking here. If bulls clear this, it opens the door to retest the stronger 4,220 structural resistance.
Scenario 2: The Bearish Breakdown (4054 $\rightarrow$ 4022)
│
┼ ── ── ── ── ── ── ── ── ── ── ── ── ── ── ──
│ (Breaching Intermediary Support)
▼
│ (Panic Selling / Stop-loss Cascade)
The Catalyst (4,054 Break): The 4,054 level represents the immediate local higher-low/demand failure point. Breaking below this level signals a continuation of the broader bearish order flow.
The Path to 4,022: A clean break below 4,054 will trigger sell-stops from retail buyers trying to catch a bounce near the 4,050 psychological level. This cascade of selling momentum should quickly flush price lower into the next major liquidity pool.
The Target (4,022): The 4,022 area is a critical Higher Timeframe (HTF) Demand Block and a previous structural swing low. This is a high-probability zone for institutional buyers to step in, look for a sweep of sell-side liquidity, and potentially initiate a sharp corrective rebound back toward 4,100+.
⚠️ Key Risk Note: Keep a close eye on the macroeconomic calendar—specifically upcoming FOMC statements and Nonfarm Payrolls (NFP). High-tier news drops can cause rapid, volatile spikes that bypass these level-to-level targets before stabilizing. Protect your capital by trailing stops once price reaches 50% of either target path. XAUUSD | The $4,120 Bounce Is LiveHeading into Monday, June 29, 2026, the structural trend for XAUUSD remains bearish on higher timeframes, but the market closed Friday with a strong short-term counter-trend signal.
Gold found immediate demand after sweeping lower to test a key liquidity block around $3,960, closing the week around $4,081–$4,088.
The strong possibility signals map out across two primary scenarios for Monday's open and early sessions:
1. The Primary Scenario: Short-Term Corrective Bounce (Buying Bias to Resistance)
The Signal: Friday's strong 1.5% recovery was fueled by the US Dollar Index (DXY) pulling back from its yearly highs near 101.80 down to 101.20, combined with a cooling of hawkish Fed bets after oil prices stabilized.
SMC/Technical Context: On the H4 chart, a bullish divergence has formed on the RSI while the market was in deep oversold territory. This indicates that selling pressure is exhausted for the immediate term, clearing the path for an upside correction.
Monday Target Execution: Price is likely to target internal buy-side liquidity. The immediate upside target sits near the $4,120 – $4,180 supply zone. If momentum continues, it may retest the 20-period EMA which sits higher up near $4,232.
2. The Macro Scenario: The Bearish Trend Continuation (Sell on Rallies)
The Signal: Despite the Friday bounce, the overall market structure has been heavily broken since gold fell from its previous consolidations earlier this year. The trendline and moving averages are firmly pointing down.
SMC/Technical Context: The bounce from $3,960 is currently viewed as a complex pullback rather than a structural reversal. Higher US interest rates (holding at 3.75%) and a strong structural DXY keep the macro pressure alive.
Monday Target Execution: If the opening hours fail to break past $4,120, or if a bearish rejection pattern (like an H1 shooting star or an MSB — Market Structure Shift) happens in the $4,180 resistance zone, sellers will likely step back in. A failure to hold the Friday lows will open the gates to a deeper drop toward the critical psychological support at $3,886.
XAUUSD — Medium-Term Bearish Shift Below EMA Structure
Fundamental Analysis
Gold remains under pressure as the market continues to watch USD momentum, Treasury yields, and upcoming U.S. macro data.
For now, the medium-term structure is weakening. As long as gold trades below the main EMA area, recovery attempts should be treated as technical pullbacks rather than a full bullish reversal.
Technical Analysis
On the daily chart, XAUUSD is showing a clear medium-term bearish shift. After failing to hold the higher structure near the previous swing high, price started to move lower and is now trading below the EMA 34, EMA 89, and EMA 200 area.
The EMA structure is beginning to converge and turn downward. This is important because it suggests that the previous bullish momentum is losing control, while sellers are gradually taking over the medium-term direction.
Price is currently around 4,088 after reacting from the strong liquidity zone near 4,000. However, the bounce remains below the EMA resistance area, so the main plan is still to wait for a recovery into the value zone before looking for sell confirmation.
The key sell swing zone is around 4,307 - 4,352. This area aligns with the Fibonacci retracement zone, EMA resistance, broken trendline pressure, and previous market structure. If gold reaches this zone and rejects, the bearish continuation scenario becomes stronger.
The medium-term downside target remains the Fibonacci extension and liquidity zone around 3,481 - 3,462.
Important Key Levels
Current price area: 4,088
Strong liquidity zone: 3,980 - 4,000
Main sell swing zone: 4,307 - 4,352
EMA resistance area: 4,307 - 4,497
Key bearish invalidation: above 4,497
First downside target: 3,980 - 4,000
Medium-term target: 3,481 - 3,462
Trading Scenario
Main Sell Scenario
Entry: 4,307 - 4,352
Stop Loss: 4,497
Take Profit 1: 4,000
Take Profit 2: 3,800
Take Profit 3: 3,481 - 3,462
Sell Condition
The preferred setup is to wait for gold to recover into the 4,307 - 4,352 sell swing zone. This area is important because it combines EMA resistance, Fibonacci retracement, and the broken structure from the previous bearish move.
A sell setup becomes more valid if price forms bearish rejection from this zone, such as a long upper wick, bearish engulfing candle, failed breakout, or lower high below the EMA structure.
If price rejects from the sell zone and breaks back below 4,000, the medium-term bearish view becomes stronger. The next major downside focus would be the Fibonacci extension target around 3,481 - 3,462.
Entry Conditions
Wait for price to recover into 4,307 - 4,352.
Look for bearish rejection before entering sell.
Do not sell aggressively at the low without a pullback.
A break below 4,000 confirms stronger bearish pressure.
If price breaks and holds above 4,497, the sell setup is invalid.
Overall, the main view remains bearish while XAUUSD trades below the converging EMA structure. The preferred plan is to wait for a pullback into the EMA and Fibonacci value zone, then look for sell confirmation toward 4,000 and the medium-term target around 3,481 - 3,462.
Do you share the same medium-term bearish view on gold, or are you waiting for a cleaner rejection from the EMA value zone first?
Short 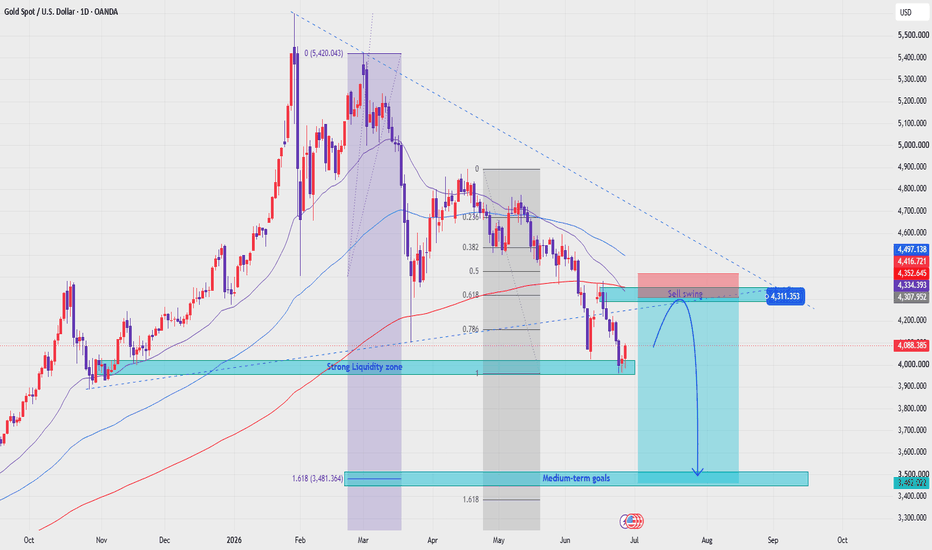
XAUUSD: ABC Wave Nears Fibonacci End ZoneGold is recovering from the recent lower base after completing a strong bearish sequence, and price is now developing an Elliott ABC structure. From Kelly’s view, the rebound is technically valid, but the market is approaching the zone where the ABC wave may complete around Fibonacci resistance.
The key idea is simple: gold can still push higher in the short term, but the strongest reaction may appear near the Fibonacci convergence area.
⟡ Market structure
The chart shows gold reacted from the lower accumulation area near 3,960–3,980, then started building a corrective recovery structure. Price is currently holding around the 4,011 buy zone and trying to continue higher from this base.
The nearest resistance sits around 4,044, while the more important reaction zone is the 4,069 area. If buyers can continue defending the buy zone, gold may extend towards the end of the ABC wave near 4,120.
However, this is still a corrective recovery inside a broader bearish environment, so each resistance zone should be treated carefully.
➤ Key levels
◌ 4,011: buy zone and short-term support
◌ 4,044: first reaction resistance
◌ 4,069: psychological resistance and sell scalping zone
◌ 4,120: Fibonacci confluence and possible end of ABC wave
◌ 3,980: lower reaction support
◌ Below 3,960: area where the ABC recovery setup weakens
⌁ Elliott Wave view
From an Elliott Wave perspective, gold appears to be forming an ABC corrective rebound after the previous bearish wave 5 ended near the lower zone.
Wave A pushed price away from the low and showed the first sign of seller exhaustion.
Wave B corrected back into the buy zone and held above the recent base.
Wave C may now be forming, with the upside path pointing towards 4,069 first and 4,120 as the stronger Fibonacci completion zone.
If wave C reaches the 4,069–4,120 resistance area and starts showing rejection, the ABC recovery may be close to completion.
▸ Trading scenario
Preferred scenario: wait for price to hold above the 4,011 buy zone and continue the ABC recovery.
Entry zone: 4,011–4,027 if bullish confirmation appears
Stop loss: below the confirmed reaction low or below 3,980
Take profit 1: 4,044
Take profit 2: 4,069
Take profit 3: 4,120
Alternative scenario: if gold fails to hold above 4,011 and breaks below 3,980, the ABC structure weakens. In that case, price may retest the lower accumulation zone before forming a new base.
⌁ Kelly’s view
For Kelly, this is a short-term ABC recovery structure, not a confirmed long-term bullish reversal. The buy zone is still holding, but the main focus is how price reacts around Fibonacci resistance.
If gold reaches 4,069–4,120 and sellers appear again, the ABC wave may be close to completion.
Gold is recovering from the lower base.
But structurally, the ABC wave may finish near the Fibonacci convergence zone.
Share your view below. Long 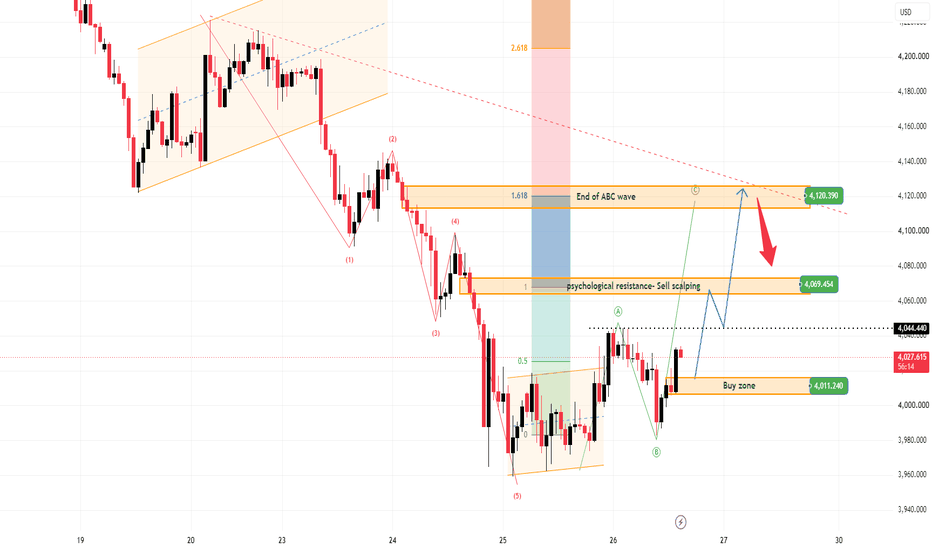
 Short
Short
Short 

GOLD TRYING TO REGAIN VALUE AFTER WEAKNESSBRIAN XAUUSD – GOLD TRYING TO RECLAIM VALUE AFTER A WEAK WEEK
Gold had a heavy week, with sellers controlling most of the structure after price failed to hold the upper value zones. The market pushed lower from the 4,240 area and continued to create lower highs, showing that the broader pressure stayed on the sell side.
However, the final part of the week is starting to show a different reaction. Gold found support from the lower value area and is now trying to recover above the short-term base around 4,040 - 4,050. This is where the next direction will be decided.
Technical structure
On the 3H chart, gold is still recovering from the recent low, but the market has not fully reversed yet.
The key area now is 4,040 - 4,050. This zone decides whether the current bounce can continue or whether sellers regain control again. If buyers defend this area, gold can push higher towards the next resistance near 4,115 - 4,125.
The stronger resistance remains around 4,240 - 4,250, where sellers may defend aggressively if price reaches that area.
Important zones
Current decision zone: 4,040 - 4,050
This area decides whether the bounce can continue.
Reclaim zone: 4,115 - 4,125
Price needs to reclaim this zone to show stronger recovery.
Seller defense zone: 4,240 - 4,250
Major resistance where sellers may return.
Lower support area: 3,980 - 4,000
Key downside support if price loses the current base.
Trading scenario
Buy reaction from 4,040 - 4,050
Entry:
Look for buy positions only if price holds 4,040 - 4,050 and shows clear bullish rejection.
Stop Loss:
Below the decision zone or below the local swing low.
Take Profit:
TP1: 4,088
TP2: 4,115 - 4,125
TP3: 4,240 only if buyers reclaim value with strength
This setup is based on the current lower Volume Profile base, where buyers are trying to defend the rebound structure.
Final view
Gold finished the week still under broader bearish pressure, but the current bounce is not dead yet.
The main level is 4,040 - 4,050. If this zone holds, gold can continue the recovery towards 4,115 - 4,125. If it fails, price can rotate back towards 3,980 - 4,000.
For now, the professional approach is simple: watch the reaction at the decision zone. No confirmation, no trade.
Trade the retest. Respect the volume zone. Long 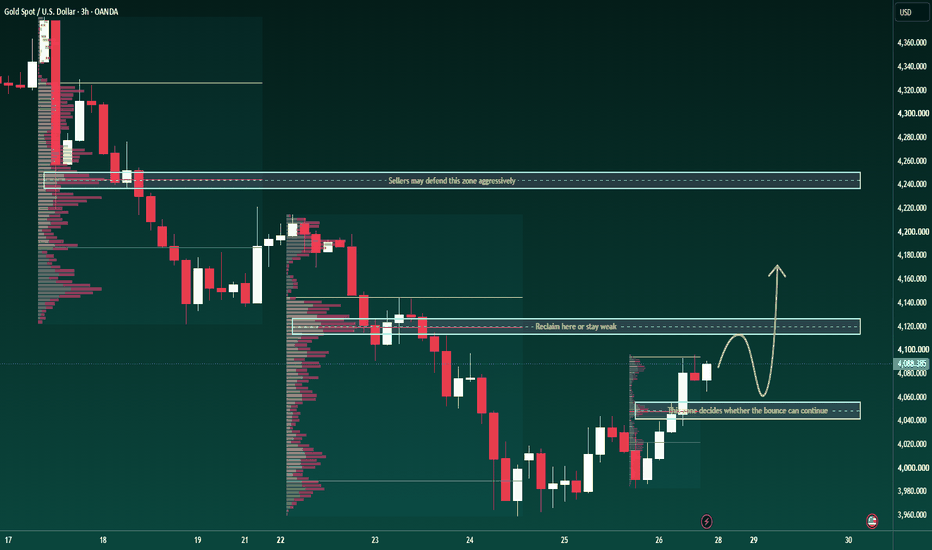
XAUUSD H4 — Liquidity Zones Decide The Next MoveXAUUSD H4 — Liquidity Zones Decide The Next Move
Gold is trading around $4,088 after recovering from the low near $3,958. The short-term reaction is bullish, but the H4 structure is not fully reversed yet. Price is now moving between a lower buy liquidity zone and a higher medium-term sell OB zone, so chasing the middle range is not ideal.
From an SMC perspective, gold created a CHoCH near the lower area and started to push upward. This shows that buyers are trying to defend the lower demand zone. However, above the current price, there are still major liquidity and supply areas that may attract selling pressure again.
The key buy zone is $4,013–$4,027. If gold pulls back into this zone and buyers defend it with clear bullish confirmation, price may continue toward $4,110–$4,125, then $4,175–$4,195. The main sell reaction zone is $4,175–$4,195, where the medium-term OB is located. If price reaches this area and fails to break higher, sellers may return.
Buy setup 1
Condition:
Gold pulls back into the $4,013–$4,027 buy liquidity zone and confirms bullish MSS / CHOCH on lower timeframe.
Entry: $4,013–$4,027
SL: below $3,985
TP1: $4,088
TP2: $4,110–$4,125
TP3: $4,175–$4,195
Buy setup 2
Condition:
If gold breaks above the liquidity zone around $4,110–$4,125 and retests it as support, bullish continuation remains valid.
Entry: $4,110–$4,125 after breakout retest
SL: below $4,075
TP1: $4,150
TP2: $4,175–$4,195
TP3: $4,222
Sell setup
Condition:
Gold reaches the medium-term OB sell zone around $4,175–$4,195 and shows bearish rejection with MSS / CHOCH confirmation.
Entry: $4,175–$4,195
SL: above $4,222
TP1: $4,125
TP2: $4,088
TP3: $4,027
Key levels
Current price area: $4,088
Buy liquidity zone: $4,013–$4,027
Low area: $3,958
Liquidity zone: $4,110–$4,125
FVG area: $4,130–$4,160
Medium-term OB sell zone: $4,175–$4,195
Buy-side liquidity: $4,222
Month high: $4,383
Bullish confirmation: clean break above $4,125
Bearish reaction confirmation: rejection from $4,175–$4,195
Bullish invalidation: clean H4 close below $3,985
My current view is that gold is in a recovery phase after taking lower liquidity, but the safest Prime Gold plan is still to wait for price to reach major liquidity zones. I prefer buying only around the $4,013–$4,027 liquidity zone with confirmation, and watching for sell reaction if price reaches the $4,175–$4,195 OB zone.
No confirmation, no trade.
Long 
XAU- Medium-Term Bearish Structure Still Targets Lower LiquidityMASON XAUUSD – Medium-Term Bearish Structure Still Targets Lower Liquidity
XAUUSD is trading around 4,088 after recovering from the recent support area. Although gold is showing a short-term rebound, the medium-term structure remains bearish.
The main trend is still down, and any recovery toward resistance should be treated as a corrective wave unless price breaks back above the major supply structure.
Technical View
Gold is still moving inside a broad bearish structure. The chart shows a clear sequence of lower highs and lower lows from the previous top area, which means sellers are still controlling the medium-term direction.
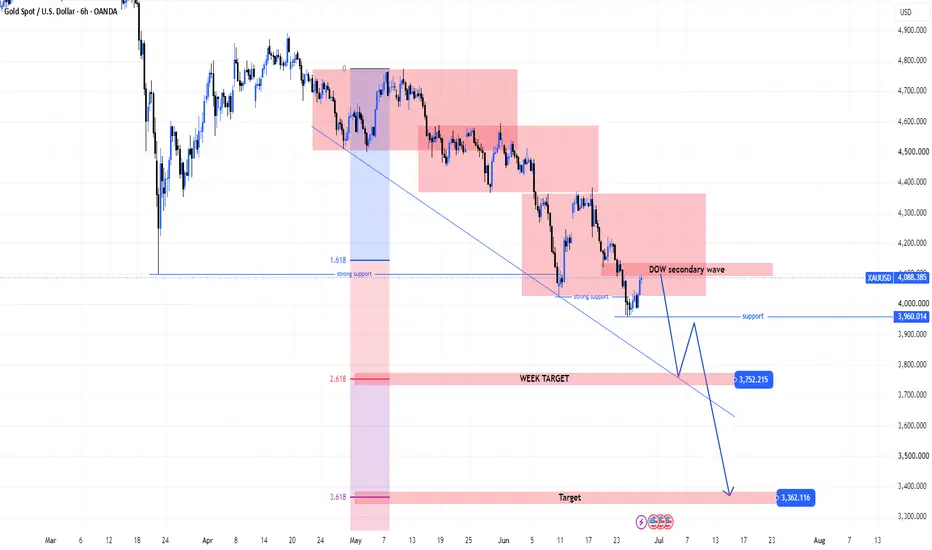
The latest rebound from the 3,960 support zone is only a technical reaction for now. Price has not broken the main bearish structure, and the recovery is moving back into a previous supply area.
The zone around 4,080–4,130 is important because it sits near the marked DOW secondary wave area. If price fails here and forms bearish rejection, this zone may become the next lower high before another downside continuation.
The 3,960 level is the nearest key support. If gold breaks below this area again, the next downside target is the weekly target around 3,752. A deeper bearish continuation can open the way toward the major target near 3,362.
Fibonacci also supports the bearish roadmap. The 2.618 extension area near 3,752 is marked as the weekly target, while the 3.618 extension near 3,362 is the deeper medium-term target.
Key Zones
Current price: 4,088
Short-term resistance: 4,080–4,130
DOW secondary wave zone: 4,100–4,130
Key support: 3,960
Weekly bearish target: 3,752
Major medium-term target: 3,362
Invalidation for bearish continuation: above 4,350
Trading Plan
Sell Priority: 4,080–4,130
Condition: wait for bearish rejection, failed breakout, or lower high formation around the resistance zone.
SL: above 4,350
TP1: 3,960
TP2: 3,752
TP3: 3,362
Alternative Scenario
If gold breaks above 4,130 and holds, price may continue a deeper corrective rebound toward 4,300–4,350. However, this would still be a correction unless the market breaks the full bearish structure.
Buy View
Buy is not the priority in the medium-term view. A short-term buy reaction may appear above 3,960, but it should be managed as a corrective move, not a confirmed trend reversal.
Final View
Overall, gold remains in a medium-term bearish structure. The current rebound can continue slightly higher, but the cleaner view is to watch for rejection around 4,080–4,130. If 3,960 fails, the next downside focus will be 3,752, followed by the deeper target around 3,362.
Will gold reject from the secondary wave zone, or extend the correction before the next bearish move?
Short 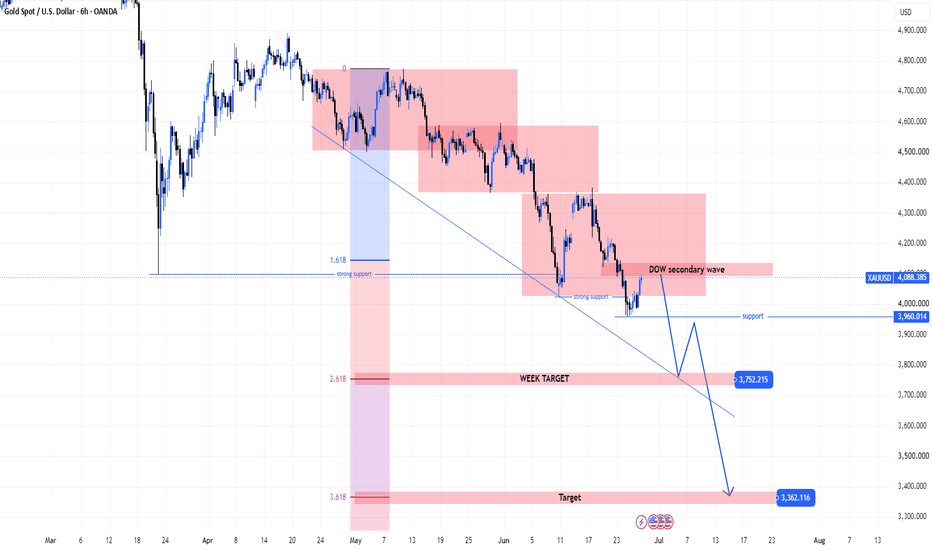
MASON XAUUSD – Important Rebound Zone AheadMASON XAUUSD – Gold May Rebound Toward Fibonacci Before Next Decision
XAUUSD is trading around 3,997 after a strong bearish move inside the descending channel. Price remains below the Ichimoku cloud, so the main structure is still bearish.
However, gold is reacting near the strong liquidity zone and buy area around 3,960–3,990, so a short corrective rebound may appear before the next trend confirmation.
Technical View
Gold is still moving inside a clear bearish channel. The market has been creating lower highs and lower lows, showing that sellers are still controlling the main structure.
Price is also below the Ichimoku cloud. This means the broader trend has not shifted bullish yet. Any recovery from the current zone should be treated as a correction unless price can break above the cloud and hold.
The current area around 3,960–3,990 is important because it combines the marked buy zone and strong liquidity support. Price reacting here shows that sellers may slow down in the short term.
If buyers defend this zone, gold may recover toward 4,040–4,050 first, then the Fibonacci and liquidity area around 4,118. This is the key rebound target to watch.
The stronger resistance remains near 4,216. If price reaches this zone and rejects, the bearish trend may continue again.
Key Zones
Current price: 3,997
Buy reaction zone: 3,960–3,990
Short-term confirmation: 4,040–4,050
Fibonacci & liquidity zone: 4,118
Strong resistance: 4,216
Invalidation for recovery: below 3,960
Trading Plan
Buy Recovery Priority: 3,960–3,990
Condition: wait for bullish rejection, higher low, or price holding above the strong liquidity zone.
SL: below 3,960
TP1: 4,040–4,050
TP2: 4,118
TP3: 4,216
Alternative Scenario
If gold breaks and holds above 4,050, wait for a retest before looking for continuation toward the Fibonacci liquidity zone at 4,118.
Sell View
Sell remains the main trend view while price stays below the Ichimoku cloud and inside the descending channel. A cleaner sell setup may appear if gold rejects from 4,118 or 4,216.
Final View
Overall, gold is still in a bearish structure, but the current liquidity zone may create a short corrective rebound. The key area to watch is 4,118, where Fibonacci and liquidity may decide the next move.
Will gold rebound toward the Fibonacci zone first, or break below the strong liquidity area directly?
Long 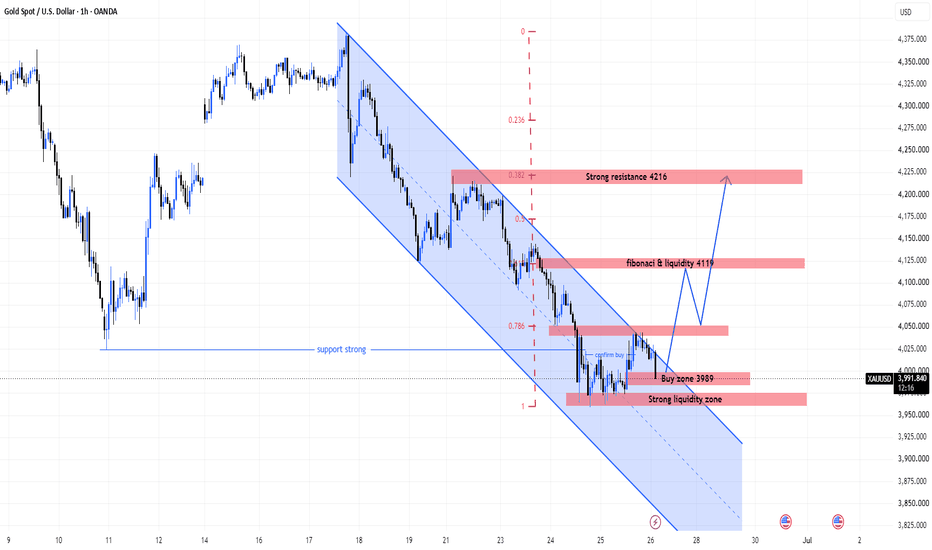
 Short
Short