Short
Short
GOLD BELOW 4000: OPPORTUNITY OR USD LIQUIDITY DRAIN?Gold remains trapped inside a strong bearish channel after weeks of persistent selling pressure. While price has started to stabilize and form a short-term consolidation, the broader market structure remains unchanged. The current pause appears to be a liquidity-building phase rather than evidence of a sustainable bottom.
Today's attention shifts toward the U.S. Core PCE Price Index, Final GDP, and Initial Jobless Claims. These releases are expected to generate short-term volatility, but unless they significantly weaken expectations for higher U.S. interest rates, they are unlikely to reverse the dominant bearish trend.
From a macro perspective, the market continues to favor the U.S. dollar. Sticky inflation, resilient economic data, and expectations that the Federal Reserve will maintain a restrictive policy continue to support USD strength. Despite gold already experiencing a deep correction, capital has yet to rotate back into safe-haven assets, suggesting investors still prefer dollar-denominated positions over defensive commodities.
Technically, gold remains inside a well-defined descending channel. The recent consolidation reflects slowing downside momentum rather than genuine accumulation. The first recovery zone is located around the 400x–404x Demand + Fibonacci confluence. If sellers successfully defend this resistance cluster, the broader bearish structure is likely to remain intact.
Failure to reclaim this resistance would reinforce the view that the current recovery is merely a corrective bounce before another leg lower toward the liquidity zones below 395x.
PRIMARY SCENARIO
Gold continues consolidating ahead of today's major U.S. economic releases.
A recovery into the 400x–404x Demand + Fibonacci resistance remains the preferred selling opportunity.
As long as price fails to reclaim this resistance cluster, the market is expected to continue rotating toward 395x, with further downside potentially extending into the 390x region.
Only a decisive break above the current resistance structure would weaken the immediate bearish outlook.
MARKET VIEW
The market is not waiting for good news to buy gold—it is waiting for a reason to leave the U.S. dollar.
Until inflation expectations soften and the Fed adopts a more dovish stance, capital flows are likely to remain concentrated in USD. That keeps the broader macro backdrop unfavorable for gold, making corrective rallies opportunities to trade with the prevailing trend rather than signals of a confirmed bottom.
Current Bias: Bearish continuation within the broader downtrend.
Key Focus: Demand + Fibonacci resistance around 400x–404x.
US Session Theme: Core PCE, GDP and Jobless Claims could increase volatility, but USD remains the dominant macro driver.
LucasGrayTrading  Short
Short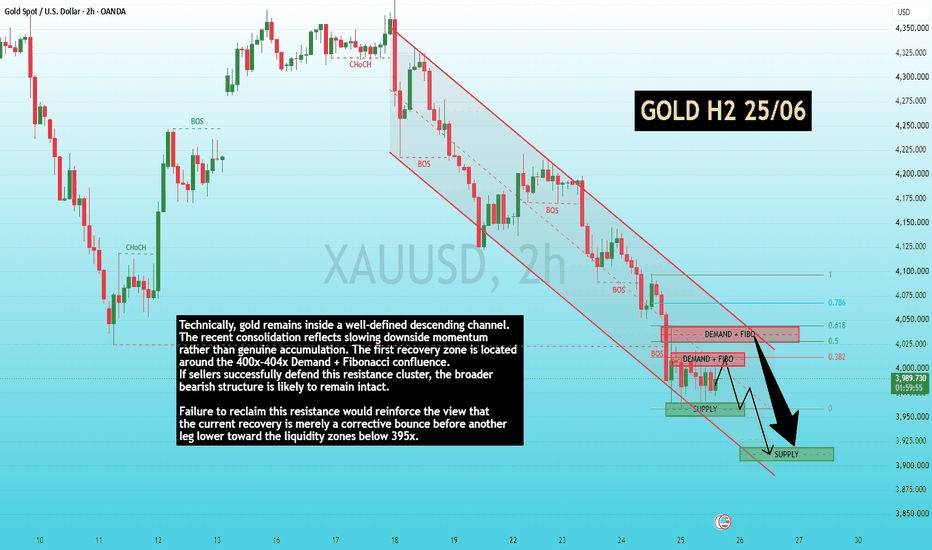
BRIAN XAUUSD - GOLD TESTING LOWER BUY ZONEBRIAN XAUUSD – GOLD TESTING LOWER POC BUY ZONE
Gold is still trading inside a short-term bearish structure, but price is now reaching the lower Volume Profile area where a corrective buy reaction can appear.
After the recent decline, XAUUSD is no longer in a clean sell-at-market position. Price is sitting near the Buy DCA area around 4,000 and approaching the Buy zone POC at 3,982 - 3,975. This is the main area where buyers may try to defend the next reaction.
Technical structure
On the H1 chart, gold has been moving lower from the upper value zones, but the current price is now trading close to a high-volume support base.
The Buy zone POC at 3,982 - 3,975 is the key level I am watching. This is not a random support zone. It is the lower value area where price may attract buy reaction after the recent sell-off.
If buyers defend this POC zone, gold can build a corrective rebound towards the Sell scalping VAH around 4,035 - 4,040. A stronger recovery can extend towards the next POC zone around 4,090, but only if price accepts above the first resistance.
Important zones
Buy zone POC: 3,982 - 3,975
Main Volume Profile support and preferred buy area.
Buy DCA: 4,000 - 4,001
Current reaction area before price reaches the lower POC.
Sell scalping VAH: 4,035 - 4,040
First resistance and short-term take-profit zone.
POC resistance: 4,090 - 4,095
Higher value resistance if the rebound expands.
High liquidity zone: 4,118 - 4,125
Major resistance inside the medium-term downtrend.
Trading scenario
Buy reaction from Buy zone POC 3,982 - 3,975
Entry:
Look for buy positions only if price pulls back into 3,982 - 3,975 and shows clear bullish rejection.
Stop Loss:
Below the Buy zone POC or below the local sweep low.
Take Profit:
TP1: 4,000
TP2: 4,035 - 4,040
TP3: 4,090 if bullish momentum expands
This setup is based on the lower Volume Profile support, where buyers may defend price after a strong decline.
Final view
Gold is still under medium-term bearish pressure, but the current location is not ideal for chasing sell.
The better plan is to wait for price to test the Buy zone POC at 3,982 - 3,975 and watch for buy confirmation. If this zone holds, gold can build a corrective rebound towards 4,035 and possibly 4,090.
This is a correction trade, not a full trend reversal.
Trade the retest. Respect the volume zone. Long 
Gold H4: Sell the RetracementGold (XAUUSD) remains in a clear bearish market structure on the H4 timeframe after creating a sequence of lower highs and lower lows. Price is currently attempting a corrective pullback toward the 0.5–0.618 Fibonacci retracement zone (4,051–4,073), which aligns with a fresh supply/resistance area.
This confluence creates a high-probability rejection zone where sellers may regain control.
Key Technical Levels
Resistance Zone: 4,051 – 4,073 (0.5–0.618 Fibonacci + supply)
Major Resistance: 4,125 – 4,160
Current Price: Around 4,028
Demand Zone: 3,945 – 3,965
Bearish Target: 3,908
Trading Scenario
🔹 Primary Bias: Bearish
Expect price to retrace into the 4,051–4,073 resistance area.
Watch for bearish confirmation such as:
Bearish engulfing candle
Pin bar rejection
Lower high formation
Break of minor bullish structure
If sellers step in, price could decline toward the 3,945–3,965 demand zone.
A confirmed break below demand may accelerate the move toward 3,908.
Invalidation
A sustained H4 close above 4,073, followed by acceptance above the resistance zone, would weaken the bearish outlook and could open the path toward the 4,125–4,160 resistance area.
Conclusion
The current setup favors selling rallies rather than chasing price lower. The 0.5–0.618 Fibonacci retracement offers a strong confluence zone for potential short entries, while the nearby demand zone remains the key support to monitor before a possible continuation toward 3,908. Short 
Gold Analysis & Trading Strategy | June 26🌐Hello traders! I’m Jack Blackwell, with 15 years of experience in analysis and trading in the futures and forex markets. Below are my technical analysis views based on the current XAUUSD (4H and 1H timeframes) chart structure.
📊 4-Hour Trend Analysis
From the 4-hour timeframe, gold has formed a short-term bottom around 3959 and has recently staged a notable rebound. Price has now moved back above MA5 and MA10, and is beginning to challenge MA20 (around 4070). At the same time, price is approaching the previous key resistance zone around 4040–4050.
However, from the broader market structure, price is still trading below both MA20 and MA200, and the moving averages have not yet formed a bullish alignment. Therefore, the long-term trend remains bearish. The current rally is more likely a corrective rebound following the previous decline, rather than a major trend reversal.
📊 1-Hour Trend Analysis
On the 1-hour chart, short-term momentum is clearly stronger than on the 4-hour timeframe.
Since rebounding from around 3959, gold has continued to form higher highs and higher lows. Both MA5 and MA10 are sloping upward, while the MACD remains above the zero line, indicating that bullish momentum still has the upper hand.
However, if price fails to break above 4050, upside potential may become limited, and the market is more likely to enter a period of sideways consolidation at higher levels.
🔴 Key Resistance Levels
● 4040–4050 (Short-term resistance zone)
● 4070–4090 (Major resistance zone)
● 4130–4140 (Medium-term strong resistance zone)
🟢 Key Support Levels
● 4000–3990 (Short-term support zone)
● 3960–3950 (Key support zone)
● 3920–3900 (Medium-term support zone)
📉 Trading Strategy Reference
🔰 Short Position Strategy (Sell at Resistance)
👉 Sell Zone 1: 4040–4050
👉 Sell Zone 2: 4070–4090
🎯 Targets: 4010 → 3990 → 3960
📍 Rationale:
● The overall 4-hour trend remains bearish.
● Price has entered a key resistance zone.
● Strong overhead supply and selling pressure remain.
🔰 Long Position Strategy (Buy the Pullback / Breakout Follow-Through)
👉 Buy Zone 1: 4000–3990 (Support retest)
👉 Buy Zone 2: 3960–3950 (Key support zone)
🎯 Targets: 4025 → 4050 → 4070
📍 Rationale:
● The 1-hour trend has turned bullish.
● MA5 and MA10 remain in a bullish alignment.
● If price can hold firmly above 4000, buyers may continue pushing the market higher.
⚠️ Trend Outlook
👉 If gold successfully breaks above 4050 and holds above it, the short-term rally could extend toward 4070 → 4090.
👉 If price repeatedly fails to break 4050 and falls back below 4000, the current rebound may come to an end, with the broader bearish trend likely to resume. In that case, watch the 3960 → 3950 support zone closely.
XAU/USD (Gold) 2H Chart Analysis — Bearish Retest Setup in a Dow
Market Structure
The chart shows a clear bearish trend:
Price has been making lower highs and lower lows.
The descending trendline connects major swing highs, confirming seller control.
Both EMAs (15 & 50) are sloping downward, indicating bearish momentum.
Price recently broke down from the 4,070–4,080 area and is now attempting a corrective bounce.
Key Levels
Resistance Zone (Sell Area)
🟦 4,060 – 4,075
Previous support turned resistance.
Confluence with the descending trendline.
Near the EMA cluster.
A rejection here would strengthen the bearish continuation scenario.
Support Zone
🟦 3,975 – 3,990
Recent consolidation base.
Buyers previously defended this area.
A break below would likely trigger another leg down.
Expected Scenario (Based on Drawing)
Scenario 1: Bearish Continuation (Higher Probability)
Price rallies into 4,060–4,075 resistance.
Sellers reject the retest.
Price drops toward 3,980 support.
Support breaks.
Next bearish targets:
3,950
3,920
3,880 (extended target)
This aligns with the dominant downtrend and the trendline resistance.
Scenario 2: Bullish Invalidation
If price:
Closes strongly above 4,075–4,080, and
Breaks the descending trendline,
then the bearish setup weakens.
Bullish targets would become:
4,120
4,160
4,200
Trade Idea
Aggressive Short
Entry: 4,060–4,075 rejection
Stop Loss: Above 4,085–4,095
Target 1: 4,000
Target 2: 3,980
Target 3: 3,920
Conservative Short
Wait for:
Rejection at resistance, then
Break below recent swing low around 3,990
This provides confirmation before entering. Short 
Elliott Wave Theory Most traders learn Elliott Wave Theory by focusing on numbers.
Wave 1. Wave 2. Wave 3. Wave 4. Wave 5.
Then come the corrective waves: A, B, and C.
While counting waves is important, many traders miss the idea that made Elliott Wave Theory revolutionary in the first place.
Elliott wasn't simply studying price patterns.
He was studying human behavior.
At its core, Elliott Wave Theory is a reflection of crowd psychology. Every wave represents a shift in emotion as market participants move between optimism, greed, fear, doubt, and panic.
Once you understand the psychology behind the waves, Elliott Wave becomes much more than a counting exercise. It becomes a way of understanding how people behave in financial markets.
Markets Move Because People Move
The stock market, forex market, and cryptocurrency market are all driven by people making decisions.
Every buy order reflects confidence.
Every sell order reflects concern, fear, or profit-taking.
When thousands or millions of participants make these decisions together, recognizable patterns begin to appear.
This is what Ralph Nelson Elliott observed.
He noticed that market movements were not completely random. Instead, they followed recurring cycles that reflected the emotional behavior of crowds.
## Wave 1: The First Signs of Optimism
The first wave usually begins when sentiment is still negative.
Most traders remain bearish because of recent price action.
However, a small group of participants starts buying.
The move often looks insignificant at first because confidence has not yet returned to the broader market.
This is why Wave 1 is frequently ignored.
Wave 2: Doubt Returns
After the initial rally, many traders believe the move was temporary.
They expect the previous trend to continue.
As a result, price retraces part of the first wave.
Psychologically, Wave 2 represents doubt.
The market begins questioning whether the new trend is real.
This is often where inexperienced traders lose confidence and exit too early.
Wave 3: Growing Confidence
Wave 3 is typically the strongest and longest wave.
By this point, more traders recognize the trend.
News becomes positive.
Analysts start upgrading their outlook.
Momentum traders enter positions.
The crowd begins moving in the same direction.
This wave is driven by growing confidence and increasing participation.
In many markets, Wave 3 reflects the period when optimism becomes widespread.
Wave 4: Taking Profits
No trend moves in a straight line forever.
After a strong advance, some traders begin locking in profits.
Price pulls back, creating Wave 4.
The trend remains healthy, but enthusiasm temporarily cools.
This phase often frustrates traders because momentum slows and uncertainty returns.
Wave 5: The Final Push
Wave 5 is frequently driven by excitement and emotion.
The trend is now obvious.
Financial media talks about it constantly.
Social media is full of success stories.
Many traders enter because they fear missing out.
Ironically, this is often when the trend is approaching exhaustion.
The crowd is most confident near the point where risk may actually be increasing.
The ABC Correction: Reality Returns
After optimism reaches its peak, the market begins correcting.
Wave A catches many participants by surprise.
Wave B creates hope that the trend will continue.
Wave C often delivers the strongest emotional pain as reality replaces excitement.
The correction phase reflects a shift from optimism back toward caution.
It is a reminder that markets move in cycles rather than straight lines.
Elliott Wave Is Really About Human Nature
Many traders become obsessed with finding the perfect wave count.
But Elliott Wave Theory was never intended to be a prediction machine.
Its true value lies in understanding crowd behavior.
The theory reminds us that markets are driven by emotions.
Fear and greed create trends.
Confidence creates momentum.
Uncertainty creates corrections.
And these emotional cycles repeat because human nature rarely changes.
Final words:
The greatest strength of Elliott Wave Theory is not its wave labels.
It is the insight it provides into market psychology.
Every impulse wave reflects growing confidence.
Every correction reflects uncertainty and emotional adjustment.
When traders understand the emotions behind the waves instead of simply counting them, charts become easier to interpret.
Because in the end, Elliott Wave Theory is not really about waves.
It is about people.
And understanding people is often the key to understanding markets.
 Education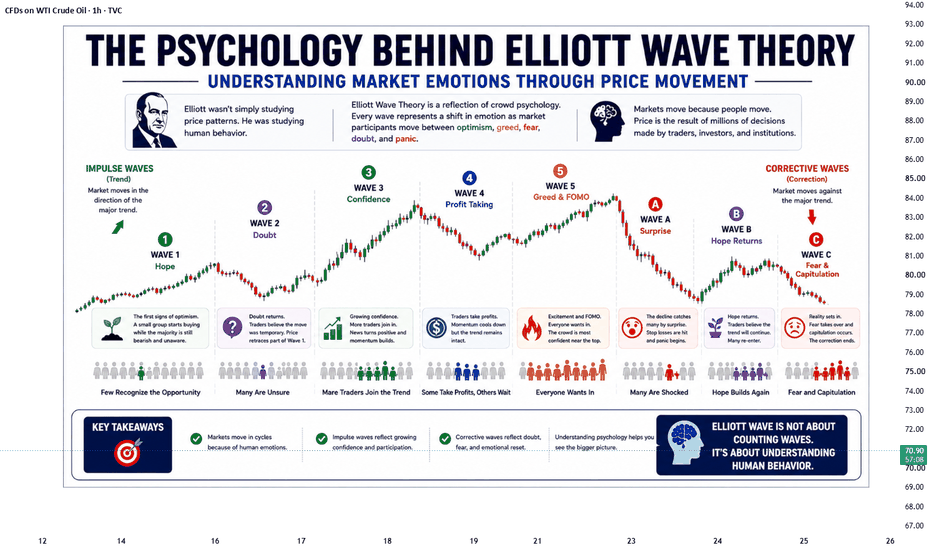
Short 
Gold Is Bouncing, But the Sell Zones Are Still WaitingGold is trying to recover from the lower area, but the chart is still not giving buyers a clean victory yet.
Price is now reacting above the 3,966 support zone, while the short-term structure remains inside a bearish channel.
This is where traders need to be careful.
A bounce from support can look strong.
But the real test always comes at resistance.
THE SIMPLE READ
Gold is still trading under bearish pressure.
The current bounce may continue in the short term, but buyers need to prove strength above the next resistance zones before the structure can look healthier.
For now, I’m watching how price reacts between 3,966 support and 4,038 resistance.
If buyers fail near resistance, sellers may try to take control again.
If buyers break above resistance and hold, the recovery may extend higher.
WHAT I SEE
3,966 is the current support zone.
This is where buyers may try to defend the market and create a short-term bounce.
4,038 is the first sell reaction zone.
If gold reaches this area and slows down, sellers may become active again.
4,095 is the stronger resistance zone.
This level is important because it sits near the key reaction area and the upper part of the bearish structure.
Below support, 3,912 is the next downside target zone.
If 3,966 breaks and price cannot reclaim it, gold may continue searching for deeper liquidity.
THE PLAN
📈 Bullish reaction scenario
If gold holds above 3,966 and shows clear bullish confirmation:
→ Price may recover toward 4,038 first
→ If 4,038 breaks and holds, the next test is 4,095
→ Possible buy idea: only after support confirmation
→ Invalidation: clear breakdown below 3,966
📉 Bearish continuation scenario
If gold rejects from 4,038 or 4,095:
→ Sellers may continue to defend the bearish structure
→ Price may return toward 3,966
→ If 3,966 breaks, the next downside area is 3,912
→ Possible sell idea: after bearish confirmation near resistance
→ Invalidation: clear break and hold above 4,095
⏳ No confirmation = no trade.
💡 Tiara’s Tip:
A support bounce is not always a reversal.
Support shows where buyers may react.
Resistance shows whether buyers are strong enough to continue.
That is why I’m not chasing the bounce too early.
For me, the key question is simple:
Can gold break 4,038, or will sellers use that zone to push price lower again?
YOUR TURN
💬 What do you see on gold now — will buyers push above 4,038, or will sellers reject the bounce?
Drop a 🟢 for recovery or 🔴 for sell reaction below 👇 Long 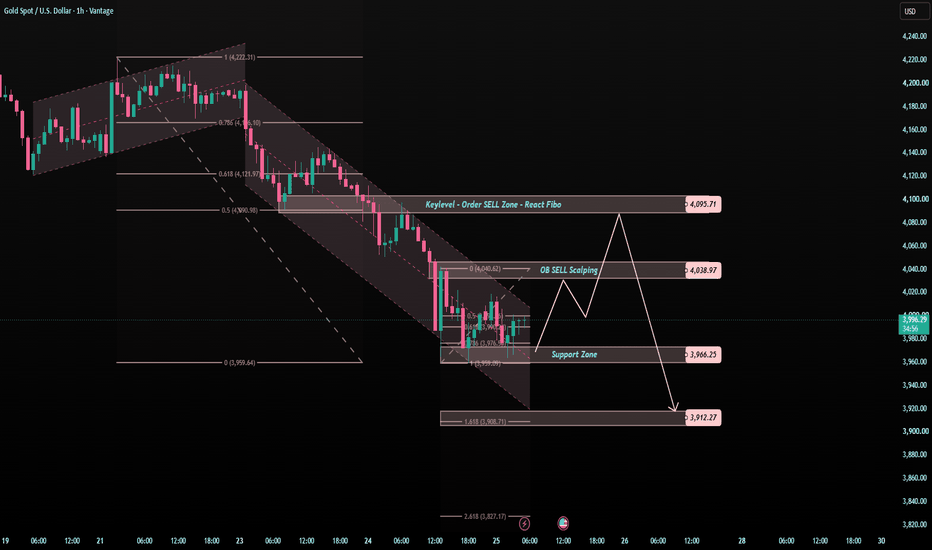
Short 
Short 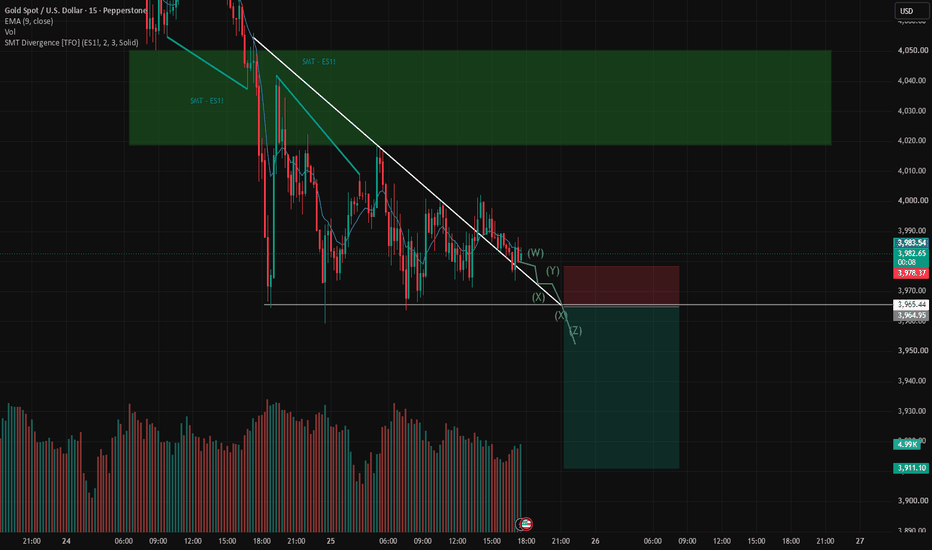
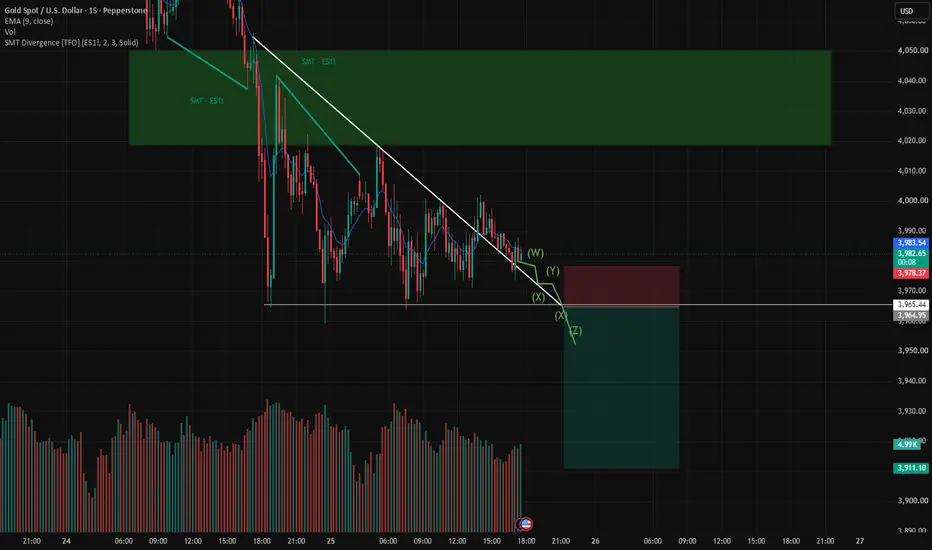
XAU/USD (Gold) – 15-Minute Chart Analysis### Market Structure Overview
On the 15-minute timeframe, XAU/USD is trading within a **descending triangle formation**, characterized by a series of lower highs pressing against a relatively stable support zone. This pattern typically reflects increasing selling pressure and often precedes a bearish breakout if support fails.
The chart shows that price has been unable to sustain rallies above the descending trendline, indicating that sellers remain in control of short-term market direction.
### Technical Observations
* **Descending Resistance:** The blue trendline continues to cap bullish attempts, creating lower highs.
* **Key Support Zone:** Around **3960–3962**, buyers have repeatedly defended this level, but each rebound is becoming weaker.
* **Current Price:** Trading near **3985**, close to the proposed entry zone.
* **RSI (14):** Around **49**, signaling neutral momentum. However, RSI remains below strong bullish territory, supporting the possibility of downside continuation.
### Bearish Trade Scenario
**Entry Zone:** 3984–3988
**Stop Loss:** 4015
**Target 1:** 3960
**Target 2:** 3940
**Final Target:** 3920
A confirmed break below the triangle support could trigger increased selling momentum toward the lower target levels. The risk-to-reward profile remains favorable as long as price stays below the descending resistance line.
### Invalidation Scenario
A sustained move and close above **4000–4015** would invalidate the bearish setup and suggest that buyers are regaining control, potentially leading to a broader upside correction.
### Conclusion
XAU/USD remains under short-term bearish pressure within a descending triangle structure. Unless buyers can break above the descending resistance, the probability favors a downside move toward **3960**, **3940**, and potentially **3920**.
**Tags:**
#XAUUSD #Gold #GoldAnalysis #Forex #TechnicalAnalysis #TradingView #PriceAction #BearishSetup #DescendingTriangle #SellSetup #MarketStructure #RSI #ForexTrading #GoldTrading #DayTrading #SwingTrading #SupportAndResistance #RiskManagement #TradingSignals #FinancialMarkets
Short 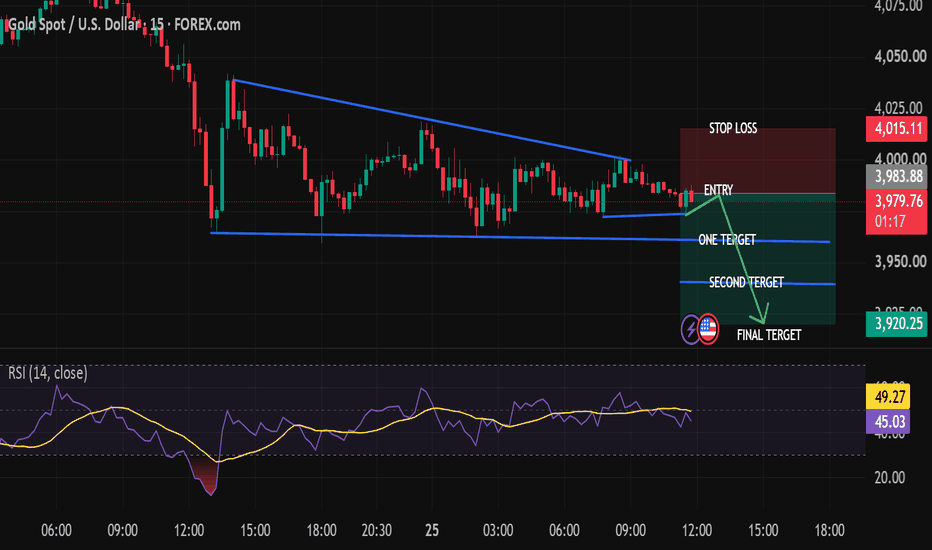
Long 
XAUUSD 1H Analysis: Bearish Structure
Gold remains under bearish pressure after sweeping buy-side liquidity near 4,378 and forming a strong rejection. The subsequent impulsive decline broke market structure around 4,220, confirming a bearish shift in order flow.
Price retraced into the 4,200–4,217 Fibonacci resistance zone (50%–61.8%) but failed to reclaim higher levels, reinforcing seller dominance. This area now acts as a bearish breaker block and remains the key zone to watch for continuation shorts.
The current structure is printing lower highs and lower lows, while price trades beneath the broken ascending trendline. As long as the market remains below 4,217, the path of least resistance favors further downside.
Key Levels
Major Resistance: 4,217 (0.618 Fib)
Secondary Resistance: 4,275–4,278 (Supply / Liquidity Zone)
Current Support: 4,155
Bearish Targets: 4,113 → 4,068
Bearish Outlook
A rejection from the 4,200–4,217 zone could trigger another leg lower toward 4,113, where sell-side liquidity rests beneath recent lows. A break below that level may expose the next demand zone around 4,068.
Invalidation
The bearish scenario weakens if buyers achieve a sustained hourly close above 4,217, with stronger bullish confirmation above 4,278.
Bias: Bearish 📉
Structure: Bearish BOS + Lower High Formation
Targets: 4,113 → 4,068
Invalidation: Above 4,217 / 4,278 Short 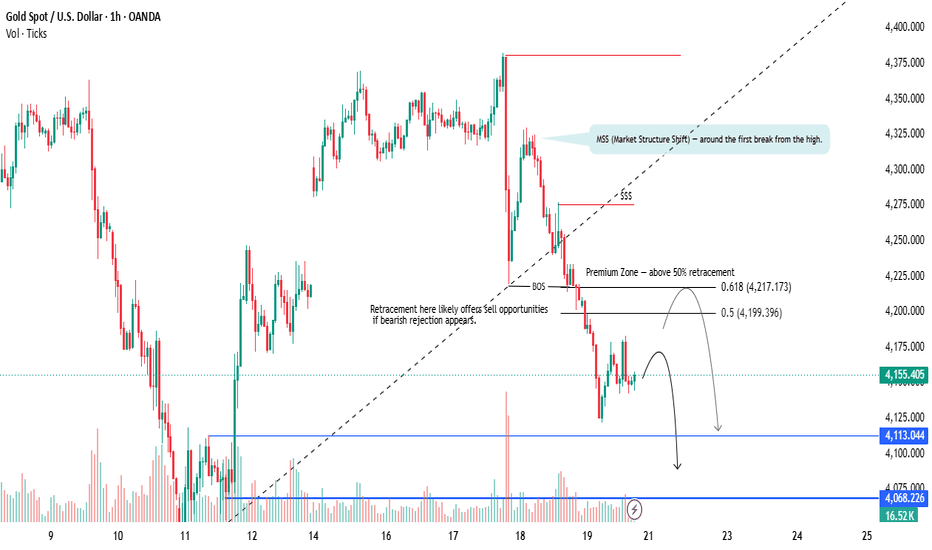
Gold Analysis & Trading Strategy | Based on 4H & 1H Charts📊 4-Hour Trend Analysis
From the 4-hour timeframe, gold remains in a clearly defined bearish structure. The overall price action continues to form a classic downtrend pattern, with the market consistently printing lower highs and lower lows.
The recent decline pushed gold down to the 3950 area, where a minor rebound occurred. However, this rebound is still considered a technical correction following profit-taking in the bearish trend, rather than a true trend reversal.
In addition, the moving average structure confirms the bearish bias, as price continues to trade below MA5, MA10, MA20, and MA200, indicating sustained downside pressure.
Overall, the 4-hour trend remains bearish unless price can reclaim and hold above the 4025–4070 resistance zone.
📊 1-Hour Trend Analysis
On the 1-hour chart, the market is currently in a typical post-decline consolidation phase.
Price is fluctuating within the 3950–4000 range, showing signs of short-term stabilization. However, both support and resistance remain clearly defined, and price action lacks strong directional momentum.
This indicates the market is temporarily balancing after the sell-off, but still remains within a bearish framework.
🔴 Key Resistance Levels
● 4005–4025 (Immediate resistance zone)
● 4070–4090 (Major structural resistance zone)
● 4130+ (Strong bearish control zone)
🟢 Key Support Levels
● 3950 (Current key support level)
● 3920 (Next support zone)
● 3900 (Psychological support level)
📉 Trading Strategy Reference
🔰 Sell Strategy (Sell the Rally)
👉 Sell Zone 1: 4005–4025
👉 Sell Zone 2: 4070–4090
🎯 Targets: 3980 → 3950 → 3920 → 3900
📍 Rationale:
● Overall trend remains bearish on both 4H and 1H
● Previous support has turned into resistance
● Price remains below key moving averages
🔰 Buy Strategy (Short-Term Rebound Only)
👉 Buy Zone 1: 3950–3960
👉 Buy Zone 2: 3920–3900
🎯 Targets: 4000 → 4025
📍 Rationale:
● Price is testing a key support zone
● Market is in an oversold corrective phase
● Potential for a short-term technical rebound
⚠️ Trend Outlook
👉 If gold breaks below 3950 and confirms a daily close below this level, bearish momentum may accelerate toward 3920 → 3900.
👉 If price reclaims and holds above 4025, a short-term rebound toward 4070–4090 may develop. XAUUSD: Ready to go longWhen gold surged above $3,000, I clearly stated that gold would climb to $5,000. Once prices hit above $5,400, I signaled that the peak had formed and short positions could be opened.
Gold has now broken below $4,000, yet the downtrend is far from over. A follow-through plunge to the $3,800–$3,600 range is expected, followed by sideways consolidation and stabilization before the next rally kicks off.
We only need to wait patiently for this bearish leg to conclude and clear reversal signals to emerge; then we can enter long trades to capture the next major uptrend. I will share trading signals promptly.
All analysis and strategies are for reference only. I will keep updating fresh trading plans for everyone, and always stay alert to market trading risks. Long 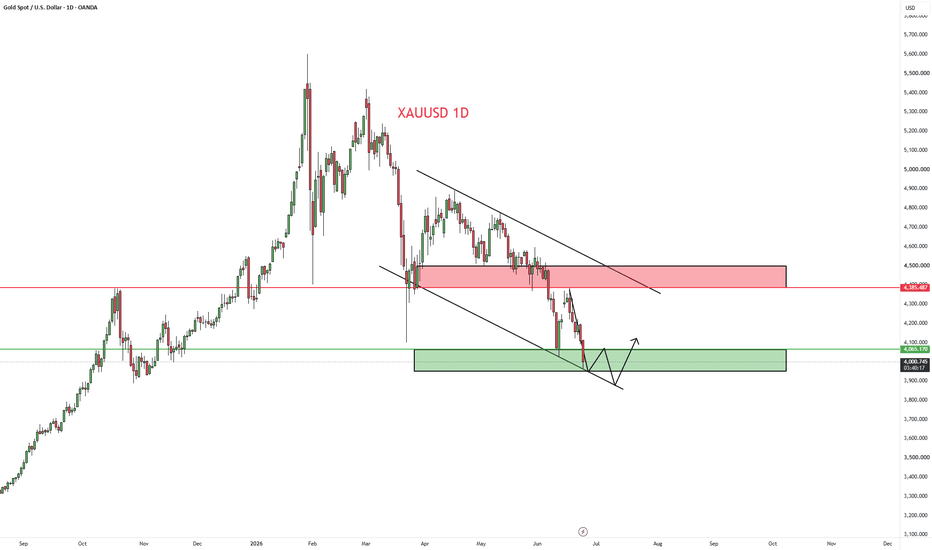
Short 
US GDP volatility — 4,040 FVG mitigation vs. 3,900 macro⚖️ Macro Backdrop: US GDP as the Ultimate Volume Catalyst
Gold markets enter a high-voltage consolidation phase hovering just under the 4,000 psychological barrier as global investors brace for the crucial U.S. GDP data release tonight. The persistent fundamental weight of elevated U.S. 10-Year Treasury yields and strong Dollar Index (DXY) traction continues to heavily cap bullion’s long-term recovery efforts. Institutional order flow is utilizing this pre-news quiet window to engineer strict liquidity traps. Tonight's macroeconomic release will serve as the volume trigger, but the primary smart money directive remains firmly locked into an aggressive premium distribution and markdown cycle.
📉 Technical Narrative: Imbalance Retest Within Aggressive Bearish Order Flow
The structural layout on the M30 chart showcases a textbook institutional distribution framework operating under a heavily dominant bearish trend:
1. Bearish Order Flow Control: XAUUSD maintains a clean structural markdown phase, verified by a definitive series of consecutive lower-timeframe Break of Structure (BOS) points down to the 3,994.630 floating zone.
2. The Premium FVG Ceiling (4,040 - 4,055 Area): Intraday price action is projected to deliver a quick pre-news corrective relief drive up into this unmitigated Fair Value Gap. This temporary bounce acts as a clean buy-side inducement designed to trap early retail breakout traders.
3. Liquidity Target Floor 1 (3,950 — 3,965 Area): Following the FVG premium mitigation, the pre-engineered black ziczac path maps a violent rejection down into this internal demand block to wash out weak long stops.
4. The Ultimate Destination Floor (3,890 — 3,905 Area): The ultimate magnet for this weekly cycle is the Major Sell-Side Liquidity (SSL) Pool resting at the deep HTF discount demand zone below. Smart money requires a complete sweep of this floor to accumulate major long inventory.
🔄 IF-THEN Playbook (Execution Scenarios):
• IF price expands into the 4,040 Premium FVG Ceiling and prints a clear lower-timeframe structural failure (M1/M5 CHoCH Rejection) -> THEN trigger premium short positions targeting the 3,955 intermediate support and the 3,900 ultimate macro bottom.
• IF price invalidates this setup by printing a solid M30 candle close above the 4,060 level -> THEN the immediate bearish expansion path is paused, and we step aside to wait for the GDP data stabilization.
🎯 Trading Metrics Summary:
• Current Floating Price: 3,994.630
• Premium Re-entry Zone: 4,040.000 — 4,055.000 (Waiting for LTF CHoCH)
• Intermediate Take Profit: 3,955.000 Area
• Ultimate Macro Target Floor: 3,890.000 — 3,905.000 (Major SSL Pool)
• Structural Invalidation Point: Solid M30 close above 4,060.000
💡 Trader Question:
Are you attempting to scalp long this pre-news rally up to the 4,040 FVG ceiling, or are you sitting on your hands waiting to short the premium rejection post-GDP? Let me know your playbook in the comments below! Long 
Gold Pre-GDP & PCE Blueprint—Final markdown to $3,800Market Overview
• Macro Driver: The global financial market enters a state of extreme compression ahead of tonight's high-impact US macro data sequence, featuring the Q1 GDP Preliminary report and the critical Core PCE Price Index. With Fed Chairman Kevin Warsh maintaining a highly hawkish "higher-for-longer" baseline, any hot data print will act as a major catalyst to catapult the US Dollar Index (DXY) upward, severely suffocating non-yielding assets like Gold.
• Market Condition: Institutional order flow remains firmly net-bearish. Smart money is actively defending macro supply barriers and using localized internal relief bounces solely as liquidity-engineering traps to accumulate heavy premium short exposure.
Technical Context
• Structure: Mid-Term Bearish Expansion. The 2H timeframe demonstrates a textbook bearish markdown cycle, strictly governed by a dominant descending Trendline. Following consecutive structural breakdowns (BOS) and local Change of Character (CHoCH) shifts, price has successfully mitigated an internal Fair Value Gap (FVG) around $4,040 - $4,060 and is initiating the next impulsive leg down.
• Liquidity & Imbalance: The algorithm is currently drawing price magnetically down to sweep the major Sell-Side Liquidity (SSL) pools resting at the $3,900 and $3,800 institutional demand targets. Retail buyers attempting to catch the falling knife are merely providing the necessary counter-liquidity for the next flush.
Key Zones
• Macro Trendline Resistance / FVG Floor: 4,040.000 - 4,060.000
• Immediate Pivot Price Level: 3,981.555
• Intermediate Support Target: 3,900.000 (Box Array)
• Ultimate Liquidity Pool: 3,800.000 (Major Demand Box)
Trading Plan (IF–THEN)
• IF price delivers a choppy intraday correction to test the current local pivot or the FVG zone at 4,040 before the high-impact news AND validates lower-timeframe bearish displacement (M15 order block rejection) -> THEN execute Short positions targeting the first support box at 3,900, with an extended expansion target down to the macro floor at 3,800.
• IF price completely invalidates the descending trendline by securing a strong, decisive 2H candle close above 4,060 -> THEN the immediate bearish continuation narrative is temporarily paused, shifting the local bias into a deeper corrective distribution phase.
MMFLOW View
• Bias: Corrective Bearish Bias. Trading against this heavy institutional markdown momentum is an uncalculated risk. Our mathematical edge heavily favors capitalizing on premium pullbacks or breakdown confirmations, targeting the massive unmitigated $3,800 liquidity pool as the ultimate target.
Are you shorting the pre-news consolidation toward $3,900, or do you think a dovish PCE surprise will trigger a massive short-squeeze above the trendline?
Drop your thoughts in the comments below! Like, Follow, and check out my Profile to lock into our real-time community tracking updates.  Long
Long
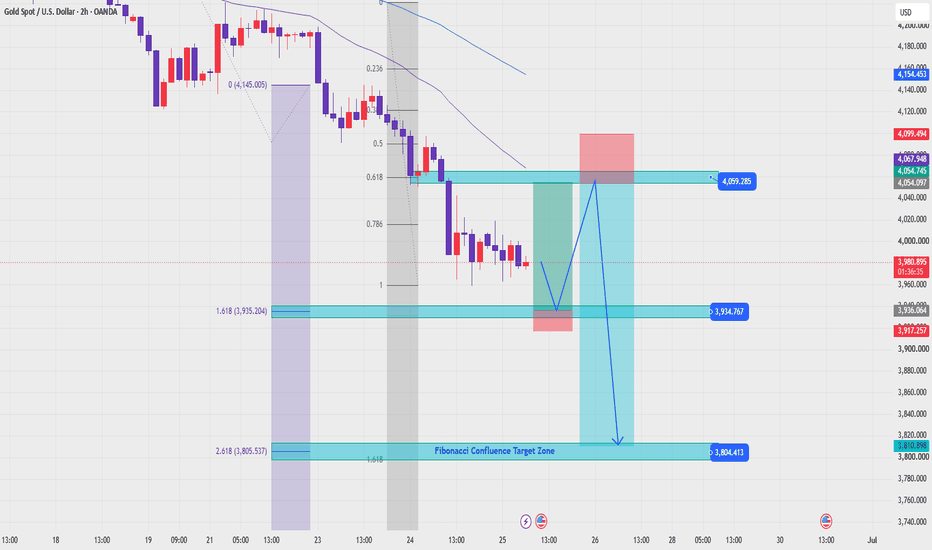
XAUUSD — EMA Bearish Trend, Fibonacci Confluence Target in Focus
Fundamental Analysis
Gold remains under pressure as price continues to trade below the main EMA structure. Traders are still watching USD momentum, Treasury yields, and upcoming U.S. macro data.
For now, the technical structure still favours sellers while recovery attempts remain weak below EMA resistance.
Technical Analysis
On the 2H chart, XAUUSD is trading below EMA 34, EMA 89, and EMA 200. This confirms that the short-term trend remains bearish, with the EMA structure acting as dynamic resistance above price.
Price is currently around 3,983 after a strong bearish continuation move. The market has already broken below the previous support area and is now moving toward the lower Fibonacci liquidity zones.
The key value sell zone is around 4,054 - 4,068. This area aligns with the Fibonacci retracement level, previous structure, and EMA resistance. If gold pulls back into this zone and fails to break higher, sellers may continue to defend the trend.
Below current price, the first important target is around 3,936 - 3,934, which aligns with the Fibonacci 1.618 area. If bearish momentum continues, the deeper target is the Fibonacci confluence zone around 3,810 - 3,804.
Important Key Levels
Current price area: 3,983
Main sell value zone: 4,054 - 4,068
EMA resistance area: 4,054 - 4,099
Short-term invalidation: above 4,099
First Fibonacci target: 3,936 - 3,934
Deeper bearish target: 3,917
Fibonacci confluence target zone: 3,810 - 3,804
Trading Scenario
Main Sell Scenario
Entry: 4,054 - 4,068
Stop Loss: 4,099
Take Profit 1: 3,936
Take Profit 2: 3,917
Take Profit 3: 3,810 - 3,804
Sell Condition
The preferred setup is to wait for gold to pull back into the 4,054 - 4,068 Fibonacci and EMA value zone. This area is important because it aligns with the bearish EMA structure and the previous reaction zone.
A sell setup becomes more valid if price forms bearish rejection from this zone, such as a long upper wick, bearish engulfing candle, failed breakout, or lower high below the EMA range.
If price rejects from the sell zone and breaks back below 3,983, the bearish continuation view becomes stronger. The next downside focus would be 3,936 - 3,934, followed by 3,917 and the Fibonacci confluence target zone around 3,810 - 3,804.
Entry Conditions
Wait for price to retest 4,054 - 4,068.
Look for bearish rejection before entering sell.
Do not sell directly at the low without a pullback.
A break below 3,936 confirms stronger downside pressure.
If price breaks and holds above 4,099, the sell setup is invalid.
Overall, the main view remains bearish while XAUUSD trades below EMA 34, EMA 89, and EMA 200. The preferred plan is to wait for a pullback into the Fibonacci and EMA value zone, then look for sell confirmation toward 3,936, 3,917, and the Fibonacci confluence target around 3,810 - 3,804.
Do you share the same bearish view on gold, or are you waiting for a cleaner retest of the EMA value zone first?
Short