Long
Long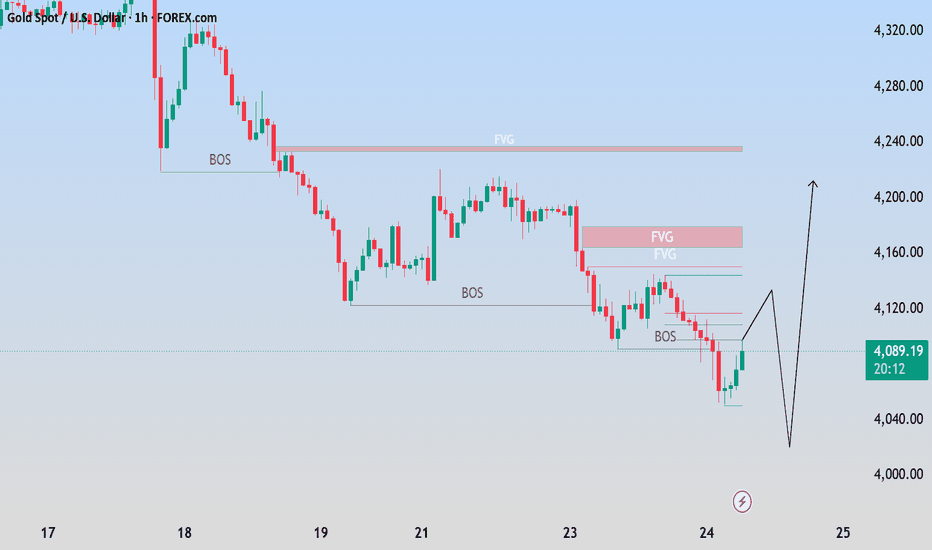
 Long
Long
XAUUSD – Gold Is Bouncing, But The Downtrend Still Holds XAUUSD – Gold Is Bouncing, But The Downtrend Still Holds
Gold is bouncing — but the trend hasn’t changed.
Price is showing a modest recovery from the key support zone, currently trading around 4,081 after reacting from the lower boundary of the range. This suggests buyers are stepping in, but the broader H2 structure remains locked inside a well-defined descending channel.
Until gold can break above resistance and escape this channel, the current move should be treated as a short-term rebound rather than a confirmed reversal.
FUNDAMENTAL ANALYSIS
Gold continues to react to movements in the U.S. dollar, Treasury yields, and overall market sentiment. The recent bounce may be driven by short-term profit-taking after the previous decline, rather than a shift in macro direction.
At this stage, price behavior around key technical levels is more important than trying to predict fundamentals.
TECHNICAL ANALYSIS – SMC + MARKET STRUCTURE
From an SMC perspective, gold is still forming a sequence of lower highs and lower lows within the descending channel. This confirms that sellers remain in control of the broader structure.
The support zone at 4,023 – 4,095 is currently acting as a defensive area for buyers. As long as price holds above this zone, a short-term push toward 4,146 is possible.
However, the key decision point lies ahead. If price reaches the 4,095 – 4,146 resistance zone and shows rejection, sellers are likely to re-enter and continue the downtrend. If support fails, downside targets remain at 3,995 and 3,893.
This is a classic reaction zone: bounce potential exists, but the dominant trend is still bearish.
KEY PRICE ZONES TO WATCH
Current price area: 4,081
Key support zone: 4,023 – 4,095
Short-term reaction level: 4,095
Nearest resistance: 4,146
SMA 200 resistance: 4,293
Bearish channel resistance: 4,095 – 4,146
First downside target: 3,995
Main bearish target: 3,893
Invalidation area for bearish view: Above 4,146
TRADING SCENARIOS
Buy Scenario – Short-Term Bounce
If gold continues to hold above the 4,023 – 4,095 support zone, a short-term long setup becomes valid.
Buy Zone: 4,023 – 4,095
Entry Condition: Bullish rejection, liquidity sweep, or lower-timeframe bullish CHoCH from support
Stop Loss: Below 4,023 or below the nearest swing low
Take Profit:
TP1: 4,095
TP2: 4,146
Sell Scenario – Trend Continuation (Priority)
If price rebounds into 4,095 – 4,146 and shows weakness, this becomes the preferred sell setup within the descending channel.
Sell Zone: 4,095 – 4,146
Entry Condition: Bearish rejection, failed breakout, lower-timeframe bearish CHoCH, or strong bearish displacement
Stop Loss: Above 4,146 or above the nearest swing high
Take Profit:
TP1: 4,023
TP2: 3,995
TP3: 3,893
Alternative Sell Scenario
If gold breaks below 4,023 with strong momentum, the bounce scenario weakens significantly.
Sell Condition: Wait for a clean break below 4,023, followed by a retest and bearish confirmation
Target: 3,995 – 3,893
MY VIEW ON GOLD
Gold is attempting to recover, but the bigger picture hasn’t changed.
The current move looks like a technical bounce from support rather than a structural reversal. As long as price remains below 4,146 and inside the descending channel, sellers still hold the advantage.
The most important area to watch is 4,095 – 4,146. This zone will determine whether the market continues lower or begins to shift.
If rejection appears here, the sell setup becomes clear again. If buyers break through with strength, the recovery could extend further.
For now, gold is rising — but not yet reversing.
Do you think gold will break above 4,146, or will sellers defend the channel and push price back toward 4,023?
Short 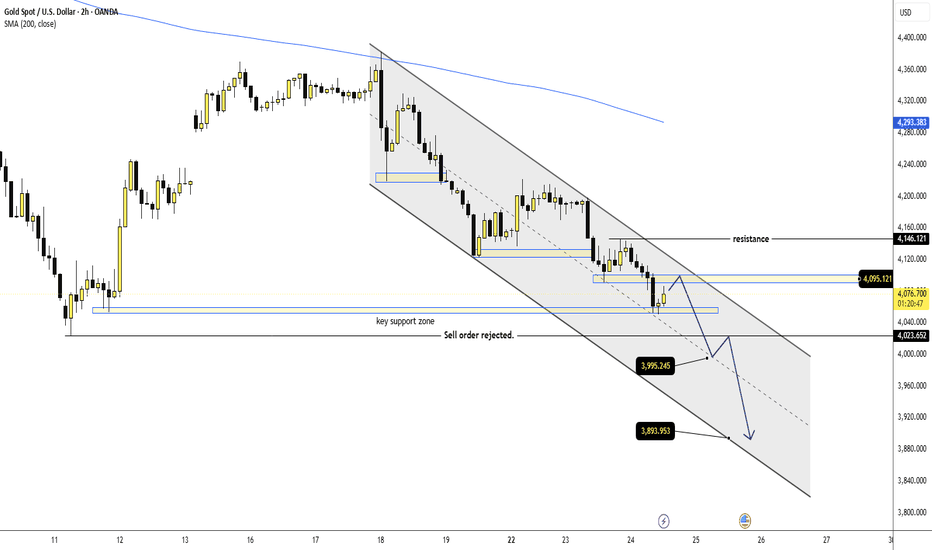
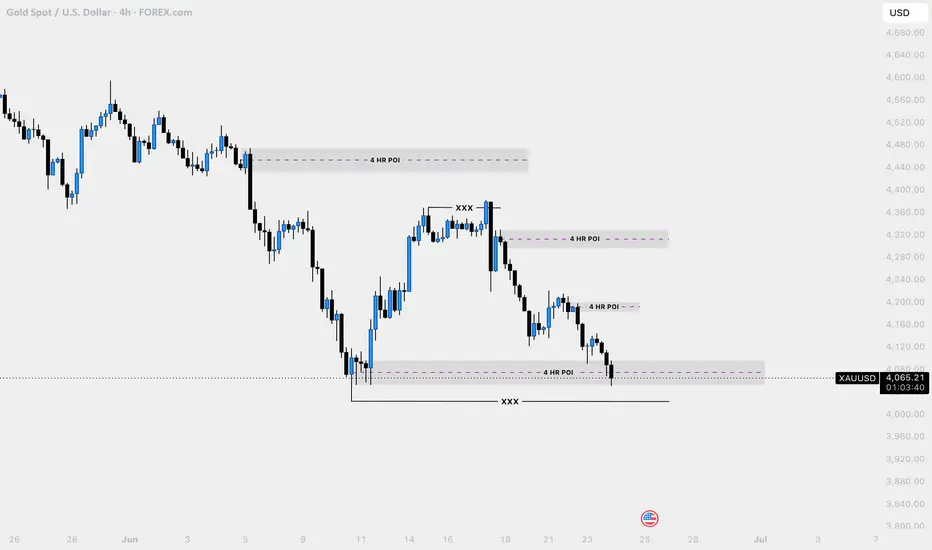
Gold Plays Out to the Dollar: 4H Demand Triggered, What’s Next?The Macro Shift: Connecting Yesterday's Relief to Today's Trend
Fed Hawkishness & Opportunity Cost (Gold Bias: Bearish)
Aggressive speculation around a potential rate hike by December continues to supercharge the US Dollar. With interest rates staying higher for longer, big funds are heavily rotating out of non-yielding gold and directly into cash and yield-bearing assets.
Geopolitical Premium Evaporating (Gold Bias: Bearish)
The immediate safe-haven fear keeping gold artificially high is rapidly leaving the market. Thanks to the unexpected 60-day preliminary ceasefire roadmap between the US and Iran, big institutions are pulling their money out of defensive assets like gold and moving it straight back into stocks, leaving a major vacuum of buyers.
📉 Technical Convergence & Your Blueprint
The Perfect 4H POI Tap & 520-Pip Bounce (Gold Bias: Retrospective Bullish Reaction)
As posted in yesterday's update, we anticipated a notable reaction out of our designated 4-hour POI. The market respected this level to the dollar—tapping exactly at $4,091 and exploding into a fierce short-term relief rally up to $4,143, yielding an incredible 520-pip move for those tracking the order flow.
The Failed Deep Retracement ($4,183) (Gold Bias: Aggressively Bearish)
We were originally tracking and hunting for a much deeper pullback into the premium 4-hour POI supply zone up at $4,183 to establish fresh short positions. However, the order flow clearly demonstrates that gold is not in the mood to give deep breathing room. Selling pressure is relentless, and price has already gravity-pulled right back down into our immediate 4-hour point of interest.
The Ultimate Target ($4,023) (Gold Bias: Structural Continuation Bearish)
With the shallow retracement getting immediately choked out, our broader view is completely locked into a bearish bias. The path of least resistance points straight down. The next major technical milestone is the heavy sell-side liquidity resting cleanly below the $4,023 major swing low. Expect sellers to aggressively hunt this level next.
⚠️ Execution & Risk Note
The broader structural narrative is completely bearish, but do not just sell blindly. Chasing a market expanding downward is a surefire way to get caught in a squeeze. Proper execution requires patience: manage your internal retracements cleanly on lower timeframes and let premium pricing come to you. Risk management is entirely in your hands.
Disclaimer: Educational purposes only. No tips or financial advice. EMA Downtrend, Waiting for Fibonacci Sell EntryFundamental Analysis
Gold remains under bearish pressure as price continues to trade below the main EMA structure. Traders are still watching USD momentum, Treasury yields, and upcoming U.S. macro data.
For now, the technical structure still favours sellers while recovery attempts remain weak below the EMA resistance zone.
Technical Analysis
On the 1H chart, XAUUSD is trading below EMA 34, EMA 89, and EMA 200. The EMA structure is still pointing downward, confirming that the main trend remains bearish.
Price recently created a doji candle near the lower area around 4,060 - 4,070, showing short-term hesitation after the sell-off. However, this doji is not enough to confirm a bullish reversal while price remains below the EMA trend.
The key sell entry zone is around 4,109 - 4,117. This area aligns with the Fibonacci retracement zone, broken structure, and EMA resistance pressure. If price pulls back into this zone and rejects, the bearish continuation setup becomes cleaner.
The main downside target is around 3,989, which aligns with the Fibonacci extension area and lower liquidity zone on the chart.
Important Key Levels
Current price area: 4,064
Fibonacci sell entry zone: 4,109 - 4,117
EMA resistance area: 4,123 - 4,170
Short-term resistance: 4,086
Bearish continuation level: 4,073 - 4,064
Main Fibonacci target: 3,989
Invalidation area: above 4,146
Trading Scenario
Main Sell Scenario
Entry: 4,109 - 4,117
Stop Loss: 4,146
Take Profit 1: 4,086
Take Profit 2: 4,034
Take Profit 3: 3,989
Sell Condition
The preferred setup is to wait for gold to pull back into the 4,109 - 4,117 Fibonacci sell entry zone. This area is important because it aligns with the EMA downtrend and the previous broken structure.
A sell setup becomes more valid if price forms bearish rejection from this zone, such as a long upper wick, bearish engulfing candle, failed breakout, or lower high below the EMA range.
If price rejects from the sell zone and breaks below 4,064 again, the bearish continuation view becomes stronger. The next downside focus would be 4,034, followed by the Fibonacci extension target around 3,989.
Entry Conditions
Wait for price to retest 4,109 - 4,117.
Look for bearish rejection before entering sell.
A break below 4,064 confirms stronger downside pressure.
If price breaks and holds above 4,146, the sell setup is invalid.
Overall, the main view remains bearish while XAUUSD trades below EMA 34, EMA 89, and EMA 200. The preferred plan is to wait for a pullback into the Fibonacci sell entry zone, then look for sell confirmation toward 4,034 and 3,989.
Do you share the same bearish view on gold, or are you waiting for a cleaner rejection from the Fibonacci sell zone? Short 
XAUUSD — Bearish Structure Holds Below EMA Resistance
Fundamental Analysis
Gold remains under short-term bearish pressure as price continues to trade below the main EMA structure. Traders are still watching USD momentum, Treasury yields, and upcoming U.S. macro data.
For now, the recovery attempts remain weak while price fails to reclaim the value range above.
Technical Analysis
On the 2H chart, XAUUSD is still trading below EMA 34, EMA 89, and EMA 200. This shows that the bearish structure remains active, with the EMA zone acting as dynamic resistance.
Price recently failed around the value range near 4,200 - 4,220 and then dropped back below short-term support. This rejection confirms that buyers are still not strong enough to reverse the trend.
The key sell reaction zone is around 4,150 - 4,169. This area aligns with the broken short-term structure, Fibonacci reaction level, and the current bearish continuation zone shown on the chart.
If price retests this zone and fails to reclaim it, sellers may continue pushing gold toward the lower Fibonacci and liquidity areas. The next important support is around 4,100, followed by the deeper convergence zone near 4,064 - 4,034.
Important Key Levels
Current price area: 4,139
Sell reaction zone: 4,150 - 4,169
Value range resistance: 4,200 - 4,220
EMA resistance area: 4,201 - 4,241
Short-term support: 4,100 - 4,105
Fibonacci liquidity zone: 4,064 - 4,067
Main bearish target: 4,034
Invalidation area: above 4,201
Trading Scenario
Main Sell Scenario
Entry: 4,150 - 4,169
Stop Loss: 4,201
Take Profit 1: 4,100
Take Profit 2: 4,064
Take Profit 3: 4,034
Sell Condition
The preferred setup is to wait for gold to retest the 4,150 - 4,169 sell reaction zone. This area is important because it aligns with the broken structure and Fibonacci reaction level.
A sell setup becomes more valid if price forms bearish rejection from this zone, such as a long upper wick, bearish engulfing candle, failed breakout, or lower high below the EMA structure.
If price rejects from the sell zone and breaks below 4,100, the bearish continuation view becomes stronger. The next downside focus would be 4,064 - 4,067, followed by the main target around 4,034.
Entry Conditions
Wait for price to retest 4,150 - 4,169.
Look for bearish rejection before entering sell.
A break below 4,100 confirms stronger downside pressure.
If price breaks and holds above 4,201, the sell setup is invalid.
Overall, the main view remains bearish while XAUUSD trades below EMA 34, EMA 89, EMA 200, and the previous value range. The preferred plan is to wait for a retest of 4,150 - 4,169, then look for sell confirmation toward 4,100, 4,064, and 4,034.
Do you share the same bearish view on gold, or are you waiting for a cleaner rejection from the sell reaction zone?
Short 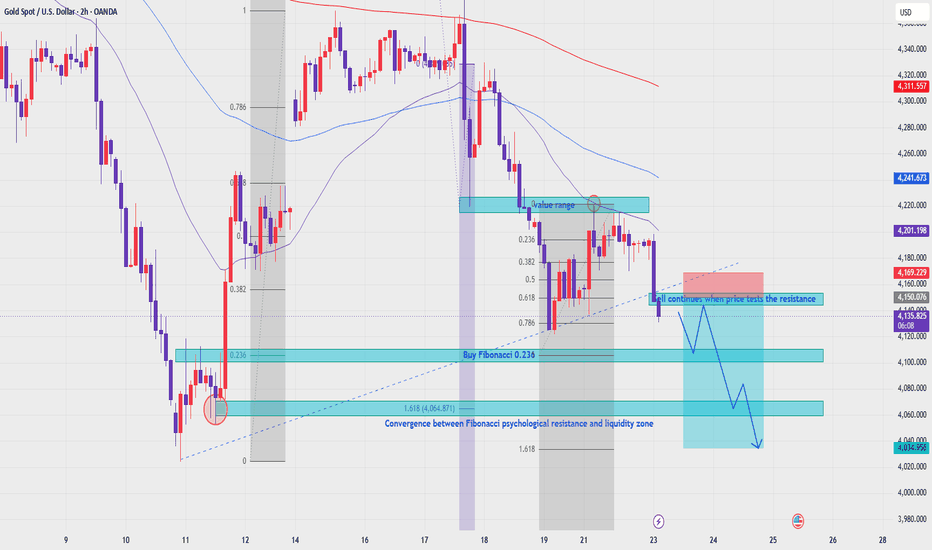
XAUUSD: The Floor Is Cracking, Sellers Still Control the Move XAUUSD: The Floor Is Cracking, Sellers Still Control the Move
Market Context
Gold remains under short-term pressure as the market continues to respect the bearish structure. Recent price action shows that buyers are still weak and unable to create a strong recovery.
At the same time, gold is still influenced by USD strength, Fed expectations, and overall risk sentiment. As long as price cannot reclaim key resistance with conviction, any upward movement should be treated as a corrective pullback rather than a true reversal.
Technical Structure
Gold is currently trading around 4,062 after losing the 4,079 level, confirming that sellers are still in control of the short-term trend.
From an SMC perspective, price is now pressing into the weak low near 4,050. When price repeatedly tests the same low without strong bullish rejection, that level becomes vulnerable and more likely to break.
The 4,079 - 4,090 zone is now acting as the first reaction area above. If price retests this zone and fails to break higher, selling pressure may quickly return.
If the weak low at 4,050 is broken, the next downside target is around 4,020, where price may find temporary support.
Key Levels
Current Price: 4,062
Weak Low: 4,050
Reaction Zone: 4,079 - 4,090
Downside Target: 4,020
Bullish Confirmation: Above 4,090
Trading Plan
Sell Scenario 1: Breakout Continuation
Entry: Below 4,050 after confirmed breakdown and retest
Stop Loss: Above 4,079
Take Profit 1: 4,020
Take Profit 2: 4,000
Take Profit 3: 3,980
Conditions:
Price breaks below the 4,050 weak low
Retest of the broken level fails
Bearish momentum continues after breakdown
Price remains below the 4,079 - 4,090 zone
Avoid chasing if price drops too far without a retest
Sell Scenario 2: Rejection From Resistance
Entry: 4,079 - 4,090 after bearish confirmation
Stop Loss: Above 4,110
Take Profit 1: 4,050
Take Profit 2: 4,020
Take Profit 3: 4,000
Conditions:
Price retests the 4,079 - 4,090 zone
Fails to break above and shows bearish rejection
Sellers regain control from resistance
Buy Scenario
Entry: Above 4,090 after breakout and retest
Stop Loss: Below 4,050
Take Profit 1: 4,120
Take Profit 2: 4,150
Take Profit 3: 4,170
Conditions:
Price breaks above 4,090
Retest holds successfully
Clear bullish CHOCH appears
Overall Bias
Gold is currently sitting on a fragile support level. Sellers remain in control as long as price stays below the 4,079 - 4,090 zone.
A confirmed break below 4,050 could open the path toward 4,020 and lower levels. For now, the best approach is to wait for confirmation instead of entering trades in the middle of the range.
What do you think — can buyers defend 4,050, or will gold continue lower toward 4,020?
Short 
Let's analyze XAUUSD on the 4-hour timeframe.Hello Traders, welcome back to DISCIPLE-FX.
Let's analyze XAUUSD on the 4-hour timeframe.
Currently, Gold remains under bearish pressure as the market continues to form lower highs and lower lows. EMA 7 is trading below EMA 15, confirming that sellers still have short-term control.
Right now, price is trading near 4060 and is sitting inside a sideways consolidation zone. This is not an ideal location for fresh entries because the market lacks clear direction.
The most important area to watch is the flip zone between 4110 and 4140. This zone previously acted as support and is now behaving as resistance. If price retests this area and gets rejected, sellers could push the market toward 4000 and potentially 3900, where sell-side liquidity is resting.
For buyers, I want to see a strong break and close above the flip zone, followed by a bullish break of structure. Only then would I consider targets toward 4200, 4280, and possibly 4400.
At the moment, patience is the key. The market is inside a no-trade zone, and waiting for confirmation is the safest approach.
Remember, capital preservation comes first. Let the market show its hand before taking a position.
This is DISCIPLE-FX. Trade with discipline, manage your risk, and I'll see you in the next analysis.
Overall Bias: 🔴 Bearish below 4140 | 🟢 Bullish only above 4140 with confirmation. XAU- Intraday Corrective Bounce After Sell-Side Liquidity Sweep
Gold is trading around $4,064 after sweeping sell-side liquidity and reacting from the lower area. The short-term trend is still under pressure, but after a strong drop, price may build a corrective bounce today before the next bigger direction is confirmed.
From an SMC perspective, gold has taken downside liquidity first, then started to react. This gives room for a recovery move back into the nearest liquidity and OB zones above. The key area to watch first is $4,100–$4,110, where buy-side liquidity is sitting. If price breaks above this zone, the next upside draw is the OB zone around $4,130–$4,140, followed by the FVG area near $4,160–$4,175.
The main idea today is to wait for a clean pullback or confirmation before buying. I do not want to chase the first reaction candle after a liquidity sweep.
Buy setup 1
Condition:
Gold holds above the sell-side liquidity sweep area and creates bullish MSS / CHOCH on lower timeframe.
Entry: $4,055–$4,070
SL: below $4,040
TP1: $4,100
TP2: $4,130
TP3: $4,160–$4,175
Buy setup 2
Condition:
If gold breaks above $4,100–$4,110 and retests this zone as support, bullish continuation remains valid.
Entry: $4,100–$4,110 after breakout retest
SL: below $4,080
TP1: $4,130–$4,140
TP2: $4,160–$4,175
TP3: $4,195–$4,205
Sell setup
Condition:
Selling is not the first priority during the corrective bounce. A sell setup is only valid if gold reaches $4,160–$4,175 or $4,195–$4,205 and shows clear bearish rejection with MSS / CHOCH.
Entry: $4,160–$4,175 after rejection
SL: above $4,200
TP1: $4,130
TP2: $4,100
TP3: $4,064
Key levels
Current price area: $4,064
Sell-side liquidity sweep: $4,045–$4,055
Buy-side liquidity: $4,100–$4,110
OB zone: $4,130–$4,140
FVG target: $4,160–$4,175
Higher OB reaction zone: $4,195–$4,205
Bullish invalidation: clean 1H close below $4,040
My current view for today is that gold may recover first after sweeping sell-side liquidity. The move is a corrective bounce, not a full bullish reversal yet. The best Prime Gold plan is to wait for structure confirmation, then follow the recovery toward the liquidity and FVG zones above.
No confirmation, no trade.
Long 
MASON XAUUSD – Gold Breaks Trendline, Sell Continuation In Focus
XAUUSD is trading around 4,140 after a strong bearish move. Price has broken below the short-term rising trendline and remains below the Ichimoku cloud, showing that sellers are still controlling the structure.
The main view is sell continuation, especially if price retests the broken trendline or previous support zones.
Technical View
Gold has broken the rising trendline that previously supported the recovery wave. This is an important signal because the market is no longer respecting the short-term bullish structure.
Price Action is showing lower highs after the rejection from the 4,200 area. The latest breakdown below the trendline confirms that buying momentum is weak, while sellers are pressing price toward deeper liquidity.
Ichimoku also supports the bearish view. Price is trading below the cloud, and the cloud above price is now acting as dynamic resistance. As long as gold stays below the cloud, recovery attempts should be treated as pullbacks, not a confirmed reversal.
The Fibonacci zones are important now. Price is reacting near the 1.618 extension area, but if this level cannot hold, gold may continue lower toward the 2.618 liquidity zone and the 3.618 crucial support area.
Key Zones
Current price: 4,140
Sell entry 1: 4,145–4,160
Sell entry 2: 4,170–4,185
Short-term resistance: 4,200–4,220
Fibonacci 1.618 area: 4,125–4,135
Liquidity level: 4,070–4,080
Crucial support: 4,020–4,030
Invalidation: above 4,200
Trading Plan
Sell Priority: 4,145–4,160
Condition: wait for bearish rejection, failed recovery above the broken trendline, or price staying below the Ichimoku cloud.
SL: above 4,200
TP1: 4,125–4,135
TP2: 4,070–4,080
TP3: 4,020–4,030
Second Sell Setup
Sell Zone: 4,170–4,185
Condition: only consider this zone if gold pulls back deeper and rejects from the previous support area.
SL: above 4,220
TP1: 4,125–4,135
TP2: 4,070–4,080
TP3: 4,020–4,030
Alternative Scenario
If gold breaks directly below 4,125, wait for a retest of this zone as resistance before looking for continuation toward 4,070 and 4,020.
Buy View
Buy is not the priority while price remains below the broken trendline and Ichimoku cloud. A short-term bounce may appear near Fibonacci support, but it needs clear bullish confirmation before considering any recovery setup.
Final View
Overall, gold is under bearish pressure after breaking the trendline. As long as price stays below 4,170–4,185 and the Ichimoku cloud, sell continuation remains the cleaner view.
Will gold retest the sell zone first, or drop directly toward the Fibonacci liquidity levels?
Short 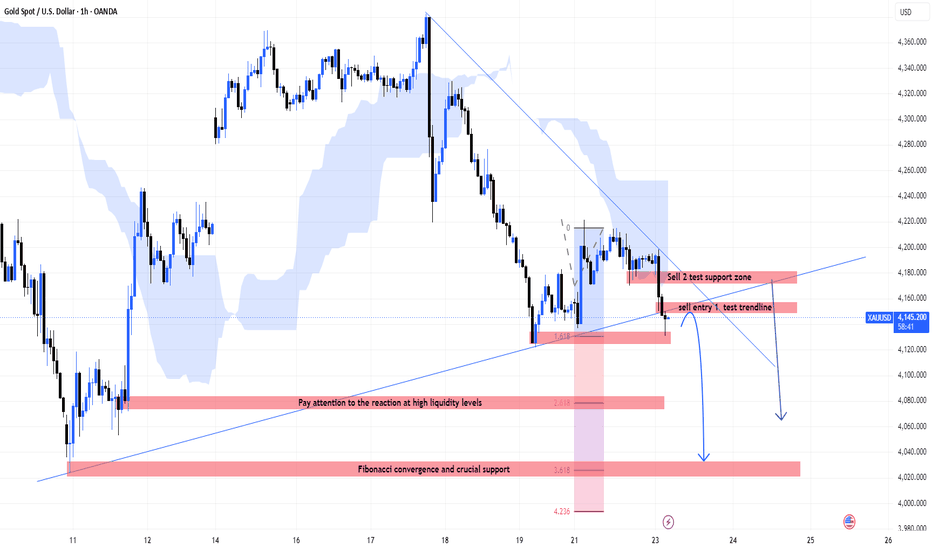
 Short
Short
XAUUSD: Wave 5 targets medium-term support.Gold is still moving inside the final bearish wave 5 structure after losing the short-term recovery channel. From Kelly’s view, the market remains under pressure, and the latest breakdown suggests sellers are still controlling the next directional move.
The key idea is simple: gold has broken support, and the cleaner sell continuation may come when price retests the broken zone.
⟡ Market structure
Price previously tried to recover inside a small rising channel, but that structure has now failed. Gold broke below the channel support and is trading back near the FVG area, showing that bullish momentum has weakened.
The broken support around 4,120–4,140 now becomes the main retest zone. If price returns to this area and sellers defend it, the wave 5 continuation scenario remains active.
The downside target remains the medium-term support zone near 4,031, where the chart marks the Elliott Wave end area.
➤ Key levels
◌ 4,120–4,140: broken support and sell retest zone
◌ 4,112: current reaction area
◌ 4,071: first downside support
◌ 4,031: medium-term support and Elliott Wave end zone
◌ Above 4,141: area where the immediate sell setup weakens
⌁ Elliott Wave view
From an Elliott Wave perspective, gold appears to be developing the final part of wave 5 after completing the earlier 1–2–3–4 sequence.
Wave 4 formed as a short recovery channel, but the break below that channel suggests wave 5 has started. If the wave count remains valid, price may continue moving lower towards the 4,071 area first, then 4,031 as the final medium-term support target.
A retest of 4,120–4,140 would fit well as a sell continuation structure before the final downside leg expands.
▸ Trading scenario
Preferred scenario: wait for price to retest the broken support zone and show bearish confirmation.
Sell retest zone: 4,120–4,140
Stop loss: above 4,141 or above the confirmed rejection high
Take profit 1: 4,071
Take profit 2: 4,031
Take profit 3: 4,000 if selling pressure expands
Alternative scenario: if gold breaks back above 4,141 and holds with strength, the immediate wave 5 sell setup loses quality and the chart may need a short-term reassessment.
⌁ Kelly’s view
For Kelly, this is a sell-the-retest structure. The market already broke the recovery channel, so the better plan is not to chase the low, but to wait for a clean reaction from the broken support area.
If sellers defend 4,120–4,140, wave 5 may continue towards the medium-term support zone.
Gold is still under downside pressure. The next important reaction may come from the retest before the final wave 5 target is reached.
Share your view below. Short 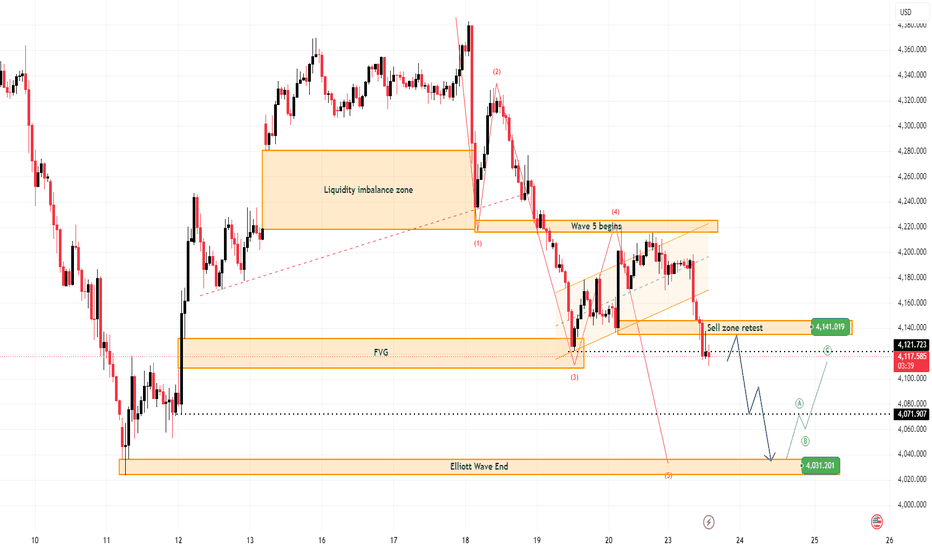
Gold below supply — liquidity sweep to 3,922?Market Overview
• Macro Driver: The US Dollar Index (DXY) consolidates firmly near its recent local highs as macro participants digest yesterday's cautious commentary from Fed Governor Christopher Waller. With the Fed's "higher-for-longer" monetary policy backed by structural inflation variables, Treasury yields remain anchored at elevated peaks. Furthermore, localized diplomatic progress regarding the Strait of Hormuz has triggered a sharp cooling of safe-haven premium arrays, forcing institutional capital to rotate out of Gold and accelerate immediate liquidation waves.
• Market Condition: Institutional order flow remains locked in a high-velocity markdown continuation phase. Large-scale smart money volume has cleanly breached short-term consolidation boundaries, converting old accumulation arrays into heavily protected supply ceilings.
Technical Context
• Structure: Acute Bearish Markdown Leg. The H1 timeframe indicates a flawless sequence of consecutive Break of Structure (BOS) market shifts. Price delivery is capped perfectly under dynamic descending supply, proving that sellers retain absolute algorithmic control and leaving zero room for weak retail buyers.
• Liquidity & Imbalance: The sharp post-FOMC descent has left multiple unmitigated Fair Value Gaps (FVGs) and premium supply blocks above. Currently, price is consolidating within a tight bearish flag, engineering minor buy-side liquidity (BSL) just to serve as fuel for a deeper structural flush into deep historical discount demand pools.
Key Zones
• Upper Premium Supply Ceiling (Major H1 FVG): 4,155.000
• Immediate Intermediate Supply (Broken Support / FVG Box): 4,070.000
• Current Market Pivot Handle: 4,028.163
• Near-Term Support / Sweep Target: 3,965.000
• Ultimate Macro Demand Floor (Major Target Box): 3,922.000
Trading Plan (IF–THEN)
• IF price delivers a minor corrective relief pop to mitigate the immediate intermediate supply near 4,070.000 AND validates lower-timeframe (M5/M15) bearish displacement -> THEN look to execute Short positions targeting the 3,965.000 sweep handle, expanding aggressively directly down to the Ultimate Macro Demand Floor at 3,922.000.
• IF price invalidates this dominant expansion vector by printing a strong, decisive H1 candle close completely above the 4,070.000 supply array -> THEN the immediate markdown momentum is temporarily paused, opening the door for an internal range consolidation.
MMFLOW View
• Bias: Heavily Bearish Continuation Bias. Chasing shorts at the absolute bottom of this current consolidation handle carries poor risk-to-reward metrics. Our mathematical edge heavily favors adopting a strict "Sell-the-rally" execution matrix, waiting for engineered liquidity pullbacks into internal supply arrays before riding the markdown leg down to the macro floor.
---
Are you looking to short the corrective relief pop toward the 4,070 FVG array, or do you expect the market to flush Gold straight to 3,922 without a breather? Drop your thoughts in the comments below! Remember to like, follow, and visit my profile to catch the real-time tracking of this setup. Gold Analysis & Trading Strategy | June 23-24🌐Hello traders! I’m Jack Blackwell, with 15 years of experience in analysis and trading in the futures and forex markets. Below are my technical analysis views based on the current XAUUSD (4H and 1H timeframes) chart structure.
✅ 4-Hour Trend Analysis
From the 4-hour chart, gold has temporarily stabilized around the 4090 area after a prolonged decline, but the overall structure remains bearish. The price is still trading below the MA20, and the moving average system remains in a bearish alignment, indicating that the medium-term downtrend has not yet changed. Although MACD bearish momentum has weakened and the market is showing signs of a recovery, the current move is still viewed as a technical rebound following the recent decline. Unless the price can reclaim and hold above the 4170–4180 zone, the overall strategy remains focused on selling rallies.
✅ 1-Hour Trend Analysis
On the 1-hour chart, gold has entered a consolidation phase after rebounding from the 4090 low and is currently trading around the 4120 area. Short-term moving averages have gradually flattened, while MACD bearish momentum has weakened significantly, suggesting that selling pressure is easing. However, bullish momentum remains insufficient to support a sustained upward move. As a result, the market is likely to continue fluctuating within the 4090–4140 range while waiting for fresh news or capital inflows to drive the next directional move. In the short term, traders should closely monitor a breakout above the 4140–4145 resistance zone or below the 4090 support level.
🔴 Key Resistance Levels
● 4136–4145 (Short-term resistance zone)
● 4172–4183 (4-hour MA20 and midline resistance zone)
● 4229–4254 (Previous major resistance zone)
● 4267–4313 (Medium-term strong resistance zone)
🟢 Key Support Levels
● 4010–4090 (Current core support zone)
● 4061 (Key support level on the 4-hour chart)
● 4024–4000 (Previous swing-low support zone)
● Around 3980 (Extended downside target if 4000 is broken)
📈 Trading Strategy Reference
🔰 Short Position Strategy (Sell the Rally)
👉 Sell Zone 1: 4136–4145
👉 Sell Zone 2: 4170–4185
🎯 Targets: 4099 → 4090 → 4061
📍 Rationale:
• The overall 4-hour structure remains bearish.
• The MA20 continues to act as resistance.
🔰 Long Position Strategy (Buy the Dip)
👉 Buy Zone 1: 4090–4080
👉 Buy Zone 2: 4065–4045
🎯 Targets: 4136 → 4145 → 4180
📍 Rationale:
• A potential short-term double-bottom pattern is forming near 4090.
• Technical support exists near the lower Bollinger Band.
• Oversold conditions may trigger a technical rebound.
⚠️ Trend Outlook
👉 If the price breaks above and holds firmly above 4145, the short-term rebound could extend further toward the 4170–4183 area.
👉 If the price falls below 4090 again, it would signal the end of the rebound and suggest that bears have regained control of the market, opening the door toward 4061 → 4024 → 4000.
🔔 Gold market conditions change rapidly, and seizing opportunities is essential!
If you feel uncertain or confused about the current market direction, you're always welcome to discuss the market with me. I can provide real-time trading signals, professional strategy support, and in-depth market analysis to help you make more informed trading decisions.
We are committed to helping you improve your trading efficiency, navigate market fluctuations with greater confidence, and achieve more stable and consistent profits over the long term. Long 
Long 
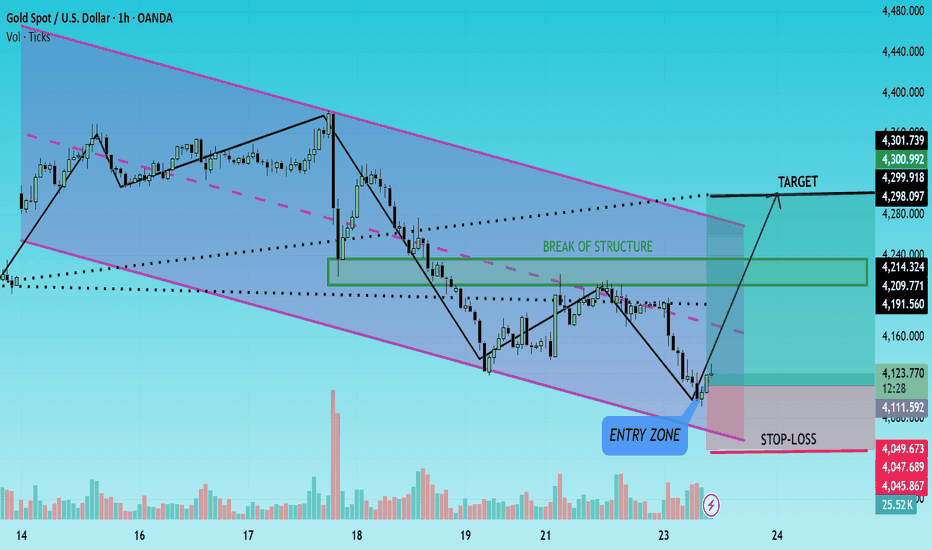
XAUUSD (Gold) 1H Chart AnalysisGold is currently trading within a well-defined descending channel, where price recently tapped the lower boundary and showed a strong bullish reaction. The chart highlights a potential reversal scenario after liquidity was swept below recent lows.
🔹 Key Observations:
Price respected the lower channel support and formed a sharp rejection.
A potential higher low has developed near the highlighted Entry Zone.
The market structure remains bearish overall, but buyers are attempting to regain control.
The green zone around 4,214 – 4,236 represents a critical Break of Structure (BOS) area.
A successful break and close above this resistance zone could confirm a bullish shift in momentum.
🎯 Bullish Scenario:
Entry: Around the highlighted demand/support zone.
Confirmation: Hourly close above the BOS zone.
Target: 4,300, aligning with the upper resistance trendline and projected bullish path.
Stop Loss: Below 4,048, beneath the recent swing low and channel support.
⚠️ Risk Management:
As long as price remains below the BOS zone, sellers still hold short-term control. Traders should wait for confirmation before aggressively positioning long.
Trading Idea: Buy the dip from support and target a move toward 4,300 after a confirmed break of structure.
#XAUUSD #Gold #GoldAnalysis #PriceAction #TechnicalAnalysis #Forex #TradingView #SmartMoneyConcepts #BreakOfStructure #BullishSetup #TradingSignals #MarketStructure Long