# **XAU/USD (Gold) Technical Analysis – Bullish Retest Opportuni### **Market Overview**
Gold remains in a **strong bullish market structure**, despite the latest corrective decline. The recent impulsive rally established a series of **higher highs and higher lows**, confirming that buyers are still controlling the broader trend.
After reaching a swing high near **4,160**, price has entered a healthy pullback, which appears to be targeting a previously broken resistance zone that is now expected to act as **new support**.
---
## **Market Structure**
* ✅ Overall trend remains **bullish**.
* ✅ Previous resistance around **4,055–4,062** has been broken convincingly.
* ✅ The current decline looks corrective rather than a bearish reversal.
* ✅ As long as price holds above the highlighted support zone, the bullish structure remains intact.
---
## **Key Support Zone**
**Support:** **4,055 – 4,062**
This area is technically significant because it combines:
* Previous breakout resistance
* Fresh demand zone
* Potential liquidity area
* Expected buy-on-retest level
A successful rejection from this zone would indicate that buyers are defending the breakout.
---
## **Resistance Levels**
Immediate resistance:
* **4,100**
* **4,120**
* **4,140**
* Major swing high near **4,160**
A break above these levels would confirm continuation of the primary uptrend.
---
## **Bullish Trade Setup**
**Entry:**
* Wait for price to retrace into the **4,055–4,062 support zone**.
* Look for bullish confirmation such as:
* Bullish engulfing candle
* Pin bar rejection
* Strong buying momentum
* Higher low formation
**Stop Loss:**
* Below **4,050** or below the recent swing low for additional protection.
**Take Profit Targets:**
* **TP1:** 4,095
* **TP2:** 4,120
* **TP3:** 4,140
* **Final TP:** 4,160+
---
## **Technical Outlook**
The correction currently appears to be a **retracement within an established uptrend**, not a change in market direction. Pullbacks into former resistance zones are common during strong bullish trends and often provide higher-probability buying opportunities.
A confirmed bullish reaction from support could trigger another impulsive leg higher, with buyers targeting the recent highs.
However, if price closes decisively below the highlighted support zone, the bullish scenario would weaken, increasing the likelihood of a deeper correction toward lower support levels.
---
## **Trading Bias**
**Bias:** **Bullish**
**Strategy:** **Buy the retest of the 4,055–4,062 support zone after bullish confirmation.**
A disciplined approach—waiting for price action confirmation rather than buying immediately—offers a more favorable risk-to-reward setup while trading in the direction of the prevailing trend.
 Long
Long
XAUUSD — Buy the Liquidity PullbackFundamental Analysis
Gold has pulled back from its recent two-week high as higher crude oil prices, stronger US Treasury yields, and renewed expectations of further Federal Reserve tightening continue to cap the upside. Ongoing tensions in the Middle East may still support safe-haven demand, but the resilience of the US Dollar is likely to keep short-term volatility elevated.
Technical Analysis
On the 1-hour chart, XAUUSD is trading around 4,125 after facing rejection from the 4,157–4,165 resistance zone. The overall market structure remains bullish, supported by consecutive Break of Structure (BOS) formations and a series of higher highs.
A deeper retracement towards the 4,062–4,070 region would allow price to retest the key Fibonacci support along with the previous breakout structure. If buyers defend this area with strong bullish confirmation, gold could recover towards 4,100, revisit 4,157–4,165, and potentially continue its rally towards the 4,220–4,228 target zone.
Important Key Levels
Current Price: 4,125.29
Main Buy Zone: 4,062–4,070
Short-term Support: 4,080–4,100
Short-term Resistance: 4,157–4,165
Liquidity Zone: 4,157–4,165
Main Target: 4,220–4,228
Invalidation: Below 4,045
Trading Scenario
Main Buy Setup
Entry: 4,062–4,070
Stop Loss: 4,045
Take Profit 1: 4,100
Take Profit 2: 4,157–4,165
Take Profit 3: 4,220–4,228
Buy Conditions
Wait for the price to retrace into the main buy zone and look for clear bullish confirmation before entering. Signals such as a long lower wick, a bullish engulfing candle, a failed breakdown, or a 1-hour candle closing back above 4,070 would indicate renewed buying interest. If the price breaks below 4,045 and sustains there, the bullish outlook will be invalidated.
Overall Outlook
The 1-hour trend remains bullish, although the current price is trading between the key support and resistance levels. Rather than chasing the market, the preferred strategy is to wait patiently for a pullback into 4,062–4,070 and seek confirmation before targeting the next bullish expansion towards 4,220–4,228.
Do you think gold will revisit the main buy zone before beginning its next bullish move? Long 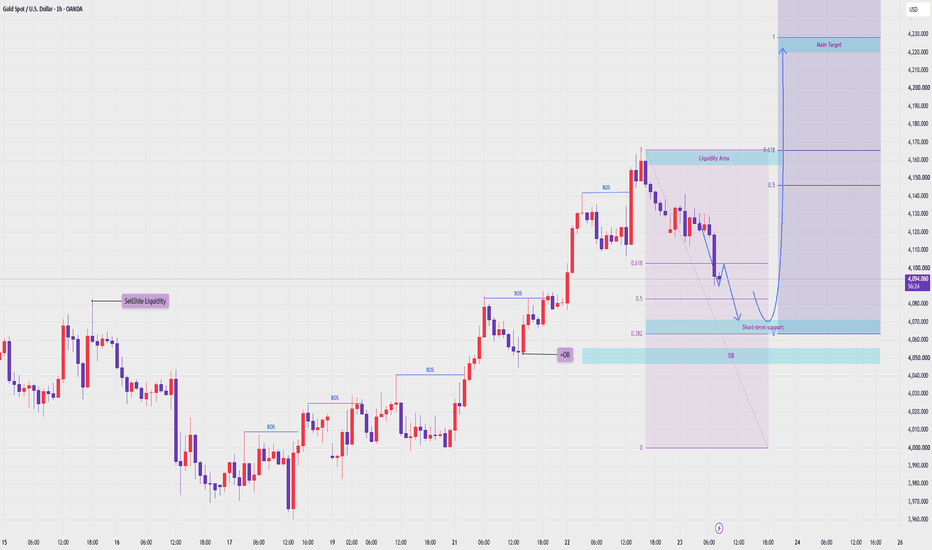
Brian XAUUSD – Gold retreats from two-week highBRIAN XAUUSD – GOLD PULLS BACK FROM TWO-WEEK HIGH, BUT VALUE STILL HOLDS
Gold is extending its pullback from the two-week high around 4,166, even while the US dollar remains under pressure. That tells me this move is not only about USD weakness. It is also about profit-taking after a strong recovery from the lower value base.
From a macro view, risk around possible Japanese intervention is keeping dollar traders cautious. At the same time, stronger sentiment from US tech earnings and AI infrastructure spending is supporting risk appetite in Asia, which can reduce demand for the safe-haven dollar.
But the chart is still the main guide here. Gold has already moved fast from the lower POC reclaim area into the upper liquidity zone. Now price is cooling down, and the next real test is whether buyers defend value on the pullback.
Technical structure
On the H1 chart, gold rejected from the profit-taking zone near 4,130 - 4,140 after failing to extend cleanly above the two-week high area.
The current pullback is still normal as long as price holds above the key intraday value structure. The zone I am watching is the Buy scalping level around 4,097.988. This is where buyers may try to defend the next reaction.
If this area holds, gold can rotate back towards 4,130 and possibly retest the upper liquidity area. If it fails, price may dip deeper into the 4,075 region before rebuilding.
Important zones
Profit-Taking Zone: 4,130 - 4,140
Current resistance where sellers started to react.
Buy scalping: 4,097.988
Main short-term buy reaction level.
Upper trendline support: 4,075 - 4,080
Deeper support if the first buy zone fails.
POC Reclaim / Buyer Reload Zone: 4,005 - 4,015
Major lower value support if gold loses the recovery structure.
Trading scenario
Buy scalping from 4,097.988
Entry:
Look for buy positions only if price pulls back into 4,097.988 and shows clear bullish rejection.
Stop Loss:
Below the local pullback low or below the next support structure.
Take Profit:
TP1: 4,120
TP2: 4,130 - 4,140
TP3: Trail only if gold reclaims the profit-taking zone with strength
This setup is based on a controlled pullback into value after gold rejected from the upper liquidity area. It is not a blind buy. The reaction must be clear.
Final view
Gold is pulling back from a two-week high, but the bullish recovery structure has not fully broken yet.
The key is whether buyers defend 4,097.988. If they do, the market can attempt another rotation back towards 4,130 - 4,140.
If this level fails, I will not force the buy. Gold may need to test deeper value around 4,075 before the next reaction appears.
For now, the plan is simple: do not chase the high, wait for value, and trade the reaction.
Is this only profit-taking before another push higher, or the start of a deeper correction? Short 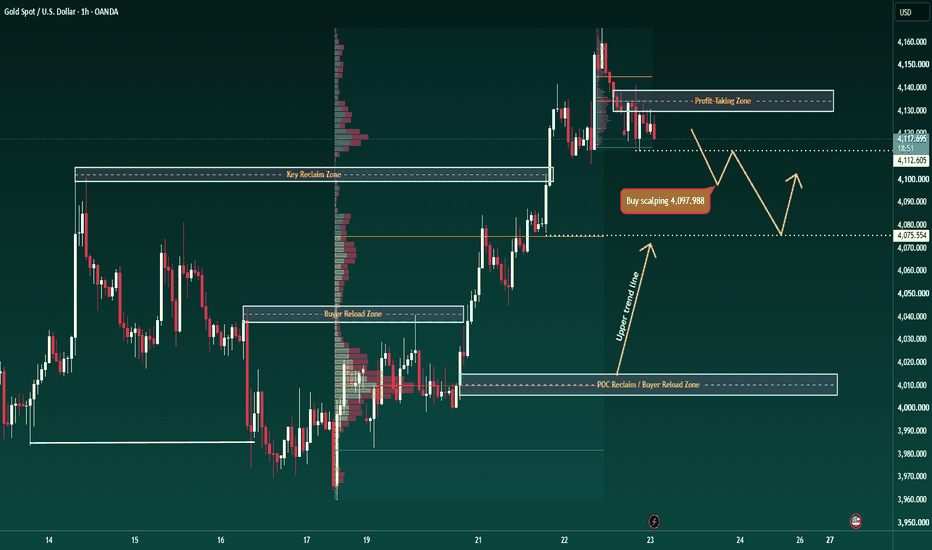
XAUUSD – Gold Is At A Crossroad After Four Days Of Recovery XAUUSD – Gold Is At A Crossroad After Four Days Of Recovery
Gold is slowing down after a strong four-day recovery.
Price is currently trading around 4,121 after reacting near the resistance area around 4,141 – 4,166. The market is no longer moving straight up, but buyers have not lost control yet.
This is an important point on the H1 chart. Gold is now testing whether the recent pullback is only a healthy retest of the Buy Order FVG zone, or the beginning of a deeper correction.
FUNDAMENTAL ANALYSIS
Gold cooled down as higher oil prices brought inflation concerns back into focus. Rising geopolitical tension in the Middle East may keep the market volatile, especially when energy prices move sharply.
The U.S. dollar is still not fully strong, but inflation risk can make traders cautious about the Fed outlook. With RSI around the neutral zone and the market waiting for clearer direction, gold may need more confirmation before extending the next move.
For now, the chart is at a decision point.
TECHNICAL ANALYSIS – SMC + FIBONACCI
From an SMC perspective, gold has already broken the previous descending trendline and created a strong bullish recovery from the lower area. This shows that buyers were active and the short-term structure improved.
However, after reaching the upper resistance near 4,166, price started to pull back. This does not automatically mean bearish reversal. It may simply be a retest of the Buy Order FVG zone.
The key area is 4,102 – 4,121. This is the Buy Order FVG zone on the chart. If gold holds this zone and forms a bullish reaction, buyers may attempt another push toward 4,141 and 4,166.
Above that, the bigger upside target is around 4,202 – 4,209, where the Fibonacci 2.618 target resistance aligns with previous resistance. This is the area where the next strong reaction may appear.
If gold breaks below 4,102, the recovery structure becomes weaker and price may revisit the strong support around 4,045.
KEY PRICE ZONES
Current price: 4,121
Buy Order FVG zone: 4,102 – 4,121
Short-term support: 4,102
Nearest resistance: 4,141
Recent high resistance: 4,166
Target resistance: 4,202 – 4,209
Strong support: 4,045
Bullish structure valid: Above 4,102
Invalidation for recovery view: Below 4,045
TRADING SCENARIOS
Buy Scenario
Buy Zone: 4,102 – 4,121
Entry: Bullish reaction, FVG retest, liquidity sweep, or lower-timeframe CHoCH
SL: Below 4,102 or below the nearest swing low
TP1: 4,141
TP2: 4,166
TP3: 4,202 – 4,209
Breakout Buy
Condition: Break and hold above 4,166
Target: 4,202 – 4,209
Sell Scenario
Sell is not the priority while gold holds above the Buy Order FVG zone.
Sell Zone: 4,166 or 4,202 – 4,209
Entry: Bearish rejection, failed breakout, or lower-timeframe bearish CHoCH
TP1: 4,121
TP2: 4,102
TP3: 4,045
Invalidation: If price breaks and holds above 4,209, the sell reaction idea becomes weaker.
MY VIEW
Gold is at a clean decision zone.
The recovery from last week was strong, but today’s pullback shows that buyers need to defend the 4,102 – 4,121 FVG zone. If this area holds, the bullish path toward 4,166 and 4,209 remains open.
If the FVG fails, gold may return to 4,045 before choosing the next larger direction.
For now, gold is not weak yet — but buyers must protect this zone.
Do you think gold will defend the 4,102 – 4,121 FVG and continue toward 4,209?
Long 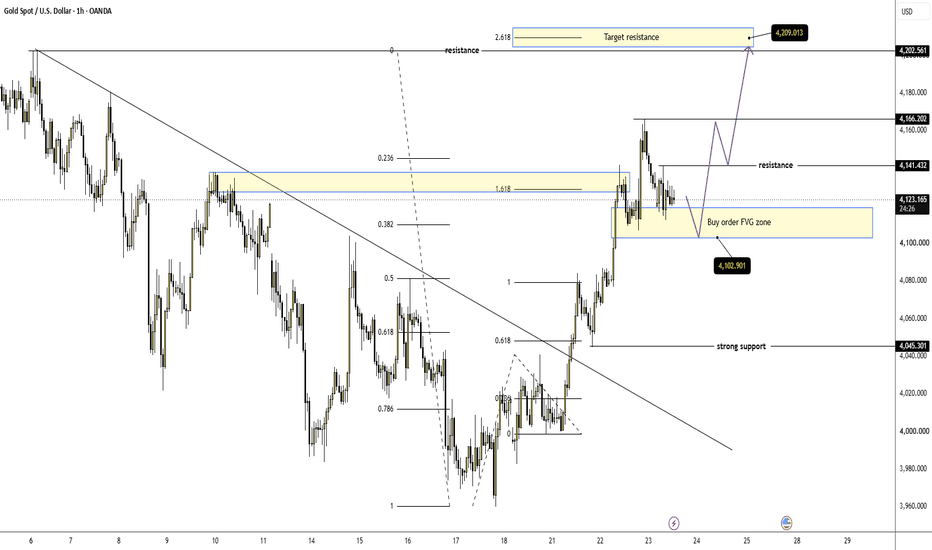
Reliance Nears Multi-Month BreakoutHighlights
* Reliance Industries has regained momentum after a prolonged consolidation phase, supported by strength across its retail, digital, and O2C businesses. The stock has been steadily attracting institutional interest and is now trading near a crucial technical resistance.
* The stock is currently trading near the **₹1,620–₹1,640** resistance zone. A decisive close above this range could confirm a fresh breakout and open the door for an advance towards **₹1,700–₹1,760** in the near term.
* On the downside, **₹1,550–₹1,570** serves as immediate support, while the **₹1,500** level remains a strong medium-term demand zone. Holding above these levels would keep the bullish outlook intact.
* Momentum indicators such as RSI and MACD have turned constructive, while the stock continues to trade above its key short- and medium-term moving averages, indicating improving trend strength.
* Reliance has formed a higher-low pattern on the daily chart after several months of range-bound movement, suggesting that buyers are gradually regaining control. Trading volumes have also picked up during recent up moves, indicating accumulation.
* Expectations surrounding the upcoming IPOs and value unlocking opportunities in the retail and telecom businesses, coupled with continued investments in new energy initiatives, continue to provide a favorable fundamental backdrop for the stock.
Takeaway
Reliance is displaying encouraging signs of a medium-term trend reversal after an extended consolidation phase. A sustained move above **₹1,640** could accelerate buying momentum and push the stock towards the **₹1,700–₹1,760** zone. As long as Reliance holds above the **₹1,550–₹1,570** support range, the technical bias remains positive, making short-term pullbacks potential buying opportunities rather than indications of a trend reversal.
Long 
Brian XAUUSD – Gold breaks down channel.BRIAN XAUUSD – GOLD BREAKS THE DOWN CHANNEL, BUT VALUE STILL DECIDES
Gold is attracting stronger follow-through buying as optimism around US-Iran diplomacy improves short-term sentiment. Price has broken out of the previous descending channel and is now trading above the reclaimed value structure.
However, the macro picture is not one-sided. Higher oil prices are bringing inflation risk back into focus, which keeps Fed rate expectations alive. At the same time, Middle East tension still supports safe-haven demand for the US dollar. That means gold can recover, but the move still needs clean value acceptance.
Technical structure
On the H1 chart, gold has broken above the bearish channel and reclaimed the POC area. This is the first strong sign that sellers have lost control of the immediate structure.
Price is now holding above the POC Reclaim Zone around 4,065 - 4,075. As long as this zone holds, the recovery structure remains valid.
The Buyzone around 4,095 is the nearest support if price pulls back. A reaction from this area can give buyers another chance to push towards the Final Liquidity Target around 4,165 - 4,170.
Below that, the Bulls Reload Base around 4,030 - 4,035 is the deeper support if gold needs a larger pullback.
Important zones
Bulls Reload Base: 4,030 - 4,035
Deeper support if the market pulls back hard.
POC Reclaim Zone: 4,065 - 4,075
Main reclaimed value zone and key support.
Buyzone: 4,095
Short-term buy reaction area.
Final Liquidity Target: 4,165 - 4,170
Main upside target if buyers keep control.
Lowest bottom area: 3,959
Major invalidation reference if the recovery fails.
Trading scenario
Buy reaction from Buyzone 4,095
Entry:
Look for buy positions only if price pulls back into 4,095 and shows clear bullish rejection.
Stop Loss:
Below the Buyzone or below the local pullback low.
Take Profit:
TP1: 4,130
TP2: 4,165 - 4,170
TP3: Trail only if price accepts above the final liquidity zone
This setup follows the breakout from the bearish channel and uses the reclaimed Volume Profile structure as support.
Final view
Gold is showing a stronger recovery after breaking the down channel, but this is still not a market to chase blindly.
The key is whether price can hold above the POC Reclaim Zone and defend the Buyzone around 4,095. If buyers hold this structure, the next target is 4,165 - 4,170.
If gold loses the reclaimed value zone, the breakout becomes weaker and price may rotate back towards 4,030.
For now, the bullish structure is alive, but the trade still needs confirmation.
Breakout is only the first step. Acceptance is what matters. Long 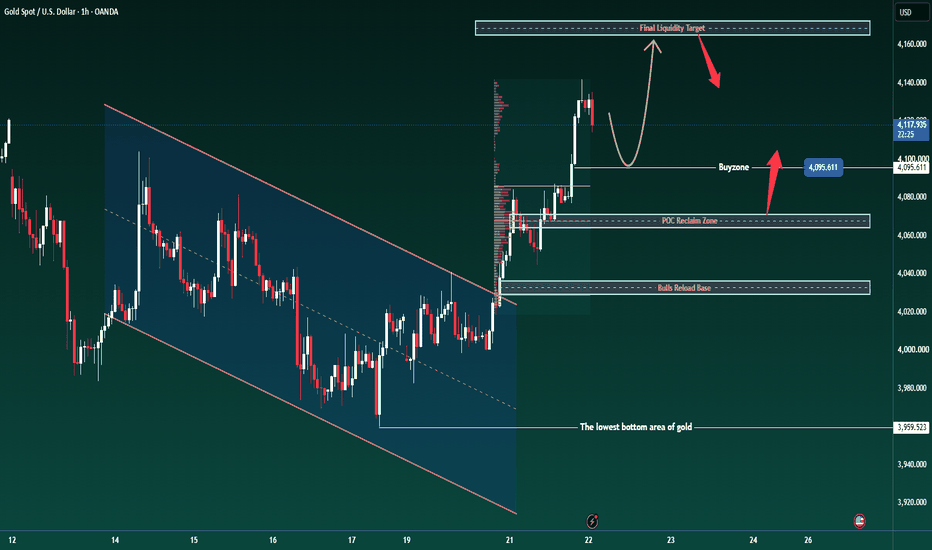
Long 
XAUUSD: Bulls Hold the Trend, But 4,147 Decides XAUUSD: Bulls Hold the Trend, But 4,147 Decides
Market Context
Gold is cooling after a four-day recovery as higher oil prices from Middle East tensions bring inflation concerns back into focus. This can make the market more cautious about Fed policy and limit gold’s upside momentum.
At the same time, the US Dollar is not fully strong either, as traders remain alert to possible USD/JPY selling pressure and intervention risk. That keeps gold in a tricky position: not fully bearish, but not strong enough to chase at the high.
Key point: gold is still inside a short-term bullish structure, but buyers must defend the pullback zones if they want continuation.
Technical Structure
Gold is trading around 4,127 and reacting inside the Current Reaction Zone after pulling back from the weak high near 4,165.
The short-term structure remains upward, supported by the recent bullish channel and previous BOS signals. However, momentum is slowing near the upper area, and RSI hovering around 50 shows that the market is still at a decision point.
The first key level is 4,147. If buyers reclaim this level, gold may retest the weak high and extend higher.
If the current reaction zone fails, price may pull back toward 4,050 - 4,060. This is the Pullback Buy Zone and the first area where buyers may reload.
Below that, 4,000 - 4,010 is the Main Support Zone. As long as gold holds above the demand structure, the broader short-term bullish trend is not broken.
Key Levels
Current Price: 4,127
Weak High: 4,147 - 4,165
Current Reaction Zone: 4,100 - 4,130
Pullback Buy Zone: 4,050 - 4,060
Main Support Zone: 4,000 - 4,010
Deep Demand Zone: 3,960 - 3,990
Bullish Continuation: Above 4,147
Bearish Risk: Below 4,050
Trading Plan
Buy Pullback
Entry: 4,050 - 4,060
SL: Below 4,000
TP: 4,100 / 4,127 / 4,147
Condition: Price must pull back into the buy zone and show bullish confirmation. Buyers need to defend the channel structure and form a clear reaction before entry.
Buy Breakout
Entry: Above 4,147 after breakout and retest
SL: Below 4,100
TP: 4,165 / 4,180 / 4,200
Condition: Price must reclaim 4,147 with strength, hold the retest, and continue forming higher lows. Avoid chasing the first breakout candle without confirmation.
Sell Reaction
Entry: 4,147 - 4,165
SL: Above 4,180
TP: 4,127 / 4,100 / 4,060
Condition: Price reaches the weak high zone but fails to continue higher. Bearish rejection from this area could trigger a corrective pullback toward the buy zone.
Breakdown Sell
Entry: Below 4,050 after confirmed breakdown
SL: Above 4,100
TP: 4,010 / 4,000 / 3,980
Condition: Price loses the Pullback Buy Zone, retest fails, and bearish momentum returns. This would increase the risk of a deeper correction toward the Main Support Zone.
Overall Bias
Gold remains short-term bullish, but the market is no longer clean enough to chase.
Above 4,147, buyers can extend the recovery toward 4,165 and 4,200. Below 4,050, the bullish structure weakens and price may return toward 4,000 - 4,010.
Best approach: wait for either a clean breakout above 4,147 or a controlled pullback into 4,050 - 4,060.
Will buyers reclaim 4,147, or will gold need one deeper pullback before the next move?
Short 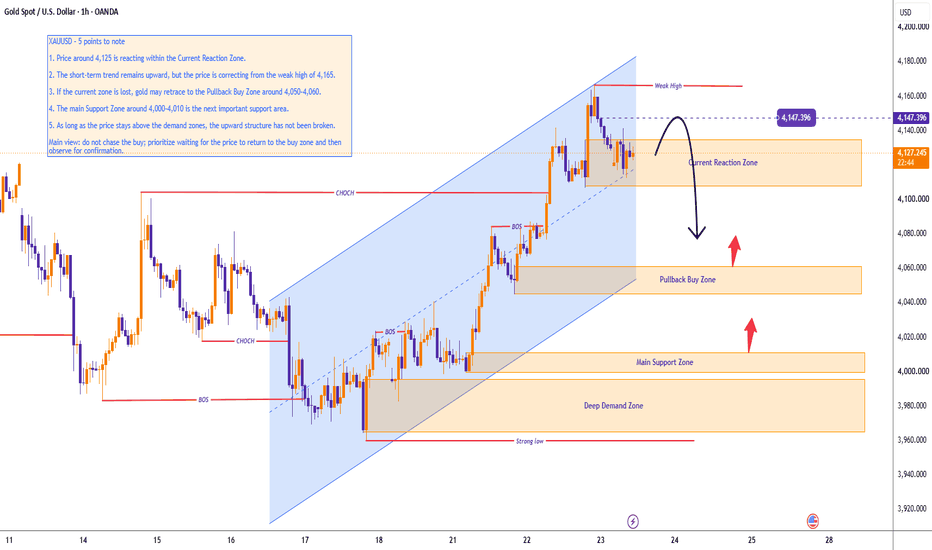
XAUUSD 4103 golden zone — 4043 is calling XAUUSD 4103 golden zone — 4043 is calling
That rejection from 4,160 looks heavy now.
Gold had the four-day recovery, pushed hard, grabbed higher liquidity, then started rolling over right back into the Golden zone around 4,103 - 4,092. That zone is the whole fight.
And yeah, buyers are not dead yet.
But this is not the place I want to chase longs. Price already expanded from the 3,968 base into 4,160. Big move. Fast move. Now momentum is cooling, RSI hanging around the middle, and the daily setup is flirting with that bearish cross idea.
Macro is mixed but still not clean for gold. Oil is keeping inflation fear alive. Middle East tension still messy. USD may be soft short-term, but if Fed rate expectations stay alive, gold upside can get capped fast.
Main bias is bearish pullback while price stays below 4,134 - 4,160.
The Golden zone around 4,103 - 4,092 can give a bounce, sure. But if that bounce fails under 4,123 - 4,134, I’m looking for sellers to press again. Below 4,092, the next draw is 4,043. That’s the real downside liquidity.
Trading scenario:
Sell idea only if gold rejects 4,123 - 4,134 or breaks below 4,092 with clean pressure.
Entry zone: 4,123 - 4,134 after rejection
Alternative entry: below 4,092 after breakdown confirmation
Stop loss: above 4,160
TP1: 4,092
TP2: 4,043
TP3: 4,025
No rejection, no sell. No breakdown, no chase.
If gold closes strong back above 4,160, this bearish pullback idea is cooked. Then buyers can keep hunting higher.
For now, I’m reading this as liquidity taken first, pullback next.
You think 4,092 holds, or does gold flush to 4,043?
Short 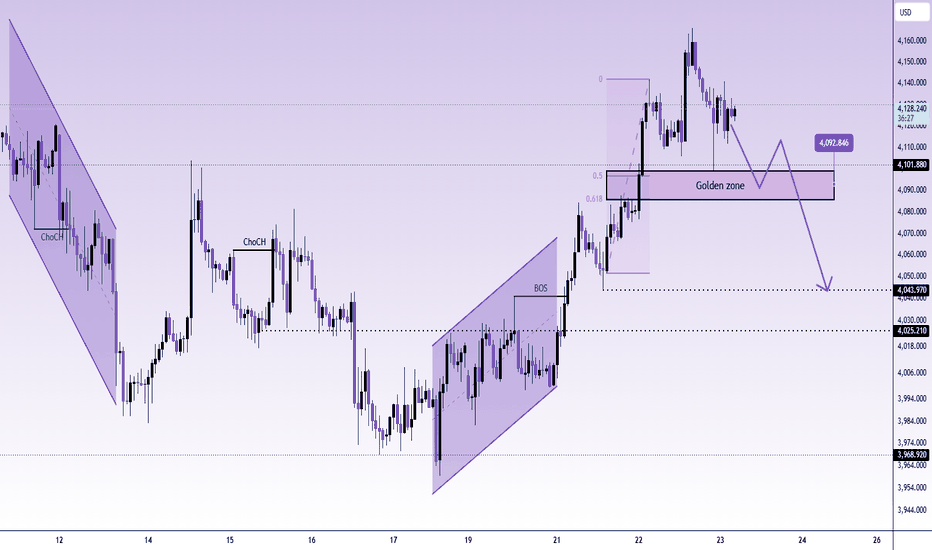
Gold Analysis & Trading Strategy | July 22-23✅ 4-Hour Trend Analysis
From the 4-hour timeframe, gold has successfully broken above the previous descending trendline, and the price has remained above the MA5, MA10, and MA20. The moving average structure has clearly shifted into a bullish alignment, indicating that the medium- to short-term trend has changed from sideways-to-bearish into sideways-to-bullish.
The current 4-hour chart shows a pullback after the recent rally, indicating strong selling pressure around the 4160 area. However, as long as the price holds above the 4110–4100 zone, the overall bullish structure remains intact.
✅ 1-Hour Trend Analysis
From the 1-hour timeframe, gold has completed a trend reversal and entered an upward phase. However, the price is currently trading near the upper Bollinger Band, and a candle with a long upper shadow has appeared at higher levels, indicating that although bullish momentum remains, profit-taking pressure has emerged above 4160, creating a short-term pullback risk.
If the price holds the 4135–4110 area, the bullish trend remains valid. If 4110 is broken, gold may further retrace toward the 4095–4080 area.
🔴 Key Resistance Levels
● 4160–4175: Short-term resistance area
● 4190–4200: Previous high resistance area
● Around 4230: Potential upside target area
🟢 Key Support Levels
● 4125–4110: Short-term support area
● 4095–4080: Important support area
● 4055–4050: Core support area for the 4-hour trend
✅ Trading Strategy Reference
🔰 Buy-on-Pullback Strategy
👉 Buy Zone 1: 4125–4110
👉 Buy Zone 2: 4095–4080
🎯 Targets: 4160 → 4195 → 4200 → 4230
🔰 Short-Term Sell Strategy at Higher Levels
👉 Sell Zone 1: 4160–4170
👉 Sell Zone 2: 4195–4200
🎯 Targets: 4135 → 4110 → 4095
🔔 If you find my analysis helpful, please like, share, and stay tuned for future updates. Your support is my motivation to continue sharing professional insights. Wishing everyone smooth trading and steady profits!  Long
Long
Long 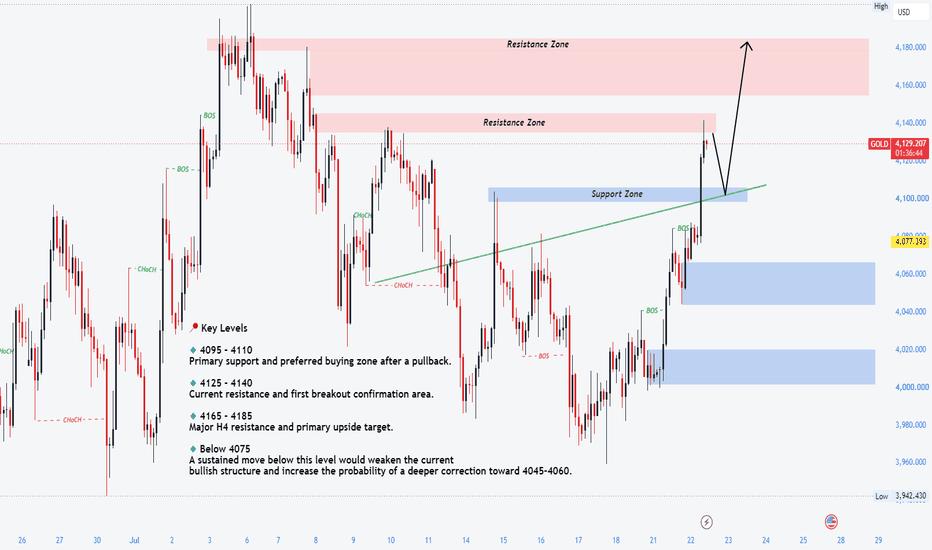
ALL TARGETS COMPLETE## XAUUSD (H4) Detailed Technical Study 📊
> **Note:** This analysis is based solely on the chart you've shared. Since I don't have the full TradingView data or future candles, this is a technical interpretation rather than a prediction.
---
# 1. Overall Market Structure
### Long-Term Bias: **Bullish** 🟢
The chart clearly shows that buyers have regained control.
Sequence observed:
* Previous consolidation
* Strong impulsive bullish candle
* Break of previous swing highs
* Market Structure Break (BOS)
* Continuation buying
The market is no longer making lower highs.
Instead it has transitioned into:
```
Higher Low
↓
Higher High
↓
Break of Structure
↓
Continuation
```
This is the first indication that institutions are accumulating rather than distributing.
---
# 2. Liquidity Analysis
Your indicator identifies liquidity sweeps.
### Sell-side liquidity
Price spent several sessions ranging.
During that range sellers became trapped.
Then price aggressively expanded upward.
That means:
✔ Sell-side liquidity has already been consumed.
---
### Buy-side liquidity
Above current price there are several equal highs.
Those highs are magnets.
Liquidity likely exists around
```
4148
4152
4155
4160+
```
That explains why momentum accelerated into this region.
---
# 3. Market Structure (SMC)
Your chart is already marking BOS/CHOCH.
Current sequence appears:
```
Accumulation
↓
Liquidity Sweep
↓
CHOCH
↓
BOS
↓
Impulse
↓
Continuation
```
This is textbook Smart Money Concepts.
Nothing currently suggests bearish control.
---
# 4. Fibonacci Study
Your Fibonacci appears drawn from the recent swing.
Important observations:
Price has already reclaimed:
* 0.236
* 0.382
and is trading above them.
That means buyers have accepted higher prices.
Healthy bullish trends usually remain above the 0.382 level.
Failure below 0.618 would weaken the trend.
---
# 5. VWAP Analysis
Your session VWAP is beneath price.
Price is trading above:
* VWAP
* Dynamic bands
This means:
Institutional average price is below current market price.
Buyers are willing to pay premium.
Very bullish.
---
# 6. Moving Average Analysis
Several moving averages are visible.
Current relationship:
Price
↑
Fast MA
↑
Slow MA
This alignment confirms trend continuation.
No bearish crossover exists.
---
# 7. Candle Structure
Recent candles show:
Large bullish bodies
Small upper wicks
Little rejection
Strong closes
This indicates:
Real buying
Not merely short covering.
---
# 8. Volume Analysis
The chart shows approximately:
95K volume
Green volume expansion
Price rising alongside volume is healthy.
If price rises while volume falls, momentum weakens.
Currently:
Price ↑
Volume ↑
Bullish confirmation.
---
# 9. Resistance Analysis
Current resistance:
```
4148–4152
```
Above that:
```
4155
4160
4170
```
Those are likely liquidity pools.
Expect:
* profit taking
* stop hunting
* volatility
---
# 10. Support Analysis
Nearest support:
```
4140
```
Next:
```
4135
```
Major support:
```
4120
```
Below that the bullish structure begins weakening.
---
# 11. Trend Strength
Trend strength currently scores very high.
Reasons:
✅ BOS confirmed
✅ Above VWAP
✅ Above moving averages
✅ Bullish candle expansion
✅ Volume confirmation
✅ Liquidity already swept
Everything is aligned.
---
# 12. Risk Areas
Things that could invalidate the bullish move:
### Scenario 1
Strong rejection near
4152–4160
followed by
Large bearish engulfing candle.
---
### Scenario 2
Break back below
4135
That would indicate:
Failed breakout.
---
### Scenario 3
CHOCH downward.
Until that happens:
Bullish trend remains valid.
---
# 13. Trade Management
From the chart:
Your positions are approximately:
```
3991
3997
4008
4017
```
Current market:
```
4149
```
All trades are deeply profitable.
Combined floating profit is roughly **$194k**, and your account equity is around **$275k**. Margin level appears healthy (>2800%), indicating no immediate margin pressure.
At this stage, the focus should shift from **finding an entry** to **protecting gains**. Consider trailing stops beneath successive higher lows or beneath the latest bullish structure to lock in profits while leaving room for further upside.
---
# 14. Smart Money Outlook
Institutional flow appears to be:
```
Range
↓
Collect liquidity
↓
Break structure
↓
Reprice higher
↓
Attack buy-side liquidity
↓
Continue expansion
```
This sequence is characteristic of Smart Money Concepts.
---
# 15. Probability Matrix
| Scenario | Probability |
| ---------------------------------- | ----------: |
| Continuation toward 4155–4165 | **70%** |
| Pullback to 4140 then continuation | **20%** |
| Immediate bearish reversal | **10%** |
These are qualitative estimates based on the visible chart structure, not statistical forecasts.
---
# Overall Assessment
### Market Structure: ⭐⭐⭐⭐⭐ (5/5)
Clear bullish BOS with higher highs.
### Liquidity: ⭐⭐⭐⭐⭐ (5/5)
Sell-side liquidity taken; buy-side liquidity remains above.
### Trend: ⭐⭐⭐⭐⭐ (5/5)
Strong directional momentum.
### Volume: ⭐⭐⭐⭐☆ (4.5/5)
Supports the breakout.
### Institutional Bias: ⭐⭐⭐⭐⭐ (5/5)
Appears bullish based on structure and price behavior.
## Final Conclusion
The chart shows a **high-conviction bullish trend** driven by a liquidity sweep, confirmed BOS, price acceptance above VWAP and moving averages, and strong impulsive candles. Until there is a **bearish CHOCH**, a decisive loss of the recent breakout zone, or a significant rejection from overhead liquidity, the technical evidence favors continuation rather than reversal.
The key question over the next several candles is **not whether the trend is bullish—it is whether buyers have enough momentum to absorb selling around the 4,150–4,160 liquidity zone and continue the expansion toward higher targets.**
Long 
 Short
Short
XAUUSD 4H - Momentum Shift from Strong SupportGold has delivered a clean reaction from the 3,960 strong support zone, forming higher lows and reclaiming short-term resistance. Buyers are stepping back in, and momentum is beginning to favor the upside.
🟢 Bullish Scenario:
A sustained break and close above 4,110 confirms bullish momentum, opening the path toward 4,200. If buyers remain in control, the next major target sits around 4,350, where higher-timeframe resistance awaits.
🔴 Bearish Scenario:
Failure to hold above 4,080–4,110 could trigger a pullback toward 4,000. A decisive break below 3,960 would invalidate the bullish structure and shift momentum back to the sellers.
📊 Why This Setup Stands Out:
• Strong reaction from a major demand zone
• Higher lows signal growing buying pressure
• Resistance levels are clearly defined for breakout confirmation
• Risk-to-reward improves after a confirmed close above resistance
⚠️ Smart Money Perspective:
Markets often test resistance before making the real move. Watch for a breakout followed by a successful retest—this usually offers a higher-probability entry than chasing the initial candle.
⏳ Trading Plan:
Patience is key. Let the market confirm the breakout above resistance before looking for continuation toward the higher targets.
🔥 Bottom Line:
The bulls have defended the most important support on the chart. As long as 3,960 remains intact, the path of least resistance is higher, with 4,200 and 4,350 as the next key objectives.
The trend is changing… now it's all about confirmation. 📈 #XAUUSD #Gold #TradingView #PriceAction #SmartMoney #Forex #BullishBreakout XAUUSD: ABC Pullback Could Trigger Next Bullish WaveGold is still holding a constructive bullish structure after the strong recovery from the lower base. From Kelly’s view, the market has already created an impulsive move higher, and the current pullback may simply be an ABC correction before price attempts another upside continuation.
The key idea is simple: gold may correct first, but the bullish structure remains active while price holds above the trendline and the main buy zone.
⟡ Market structure
The chart shows gold recovering strongly from the 3,960 area, then building higher lows along the rising trendline. Price pushed into the 4,130–4,140 region before slowing down, which is normal after a strong bullish leg.
Gold is now trading around 4,118, close to the short-term support area. The first reaction zone sits around 4,100–4,105, where a small buy scalping setup may appear.
The more important zone is the 4,068–4,075 area. This is marked as the possible end of the ABC correction. If buyers defend this zone, gold may start a new upward wave towards the upper trendline and the 4,150–4,160 target area.
➤ Key levels
◌ 4,100–4,105: buy scalping zone and short-term reaction area
◌ 4,068–4,075: main buy zone and possible ABC completion
◌ 4,118–4,123: current price reaction area
◌ 4,130–4,140: nearest resistance zone
◌ 4,150–4,160: upside target and trendline target area
◌ Below 4,068: area where the bullish setup starts to weaken
⌁ Elliott Wave view
From an Elliott Wave perspective, gold appears to have completed a short bullish wave sequence from the lower base. After that, the current movement may be forming an ABC correction.
Wave A is the first pullback from the recent high.
Wave B may form a small rebound around the 4,100 zone.
Wave C may complete around 4,068–4,075 if price continues to correct deeper.
If wave C ends inside this buy zone and a bullish confirmation candle appears, gold may begin the next continuation phase. The next target would be 4,130–4,140 first, then 4,150–4,160 if momentum expands.
▸ Trading scenario
Preferred scenario: wait for gold to complete the ABC correction around the buy zone before looking for continuation.
Entry zone: 4,068–4,075 if bullish confirmation appears
Scalping entry zone: 4,100–4,105 only if price reacts strongly
Stop loss: below the confirmed wave C low or below 4,060
Take profit 1: 4,130–4,140
Take profit 2: 4,150–4,160
Take profit 3: higher trendline area if bullish momentum continues
Alternative scenario: if gold breaks below 4,068 with strong bearish pressure, the ABC bullish setup weakens. In that case, price may need to form a deeper base before the next recovery becomes reliable.
⌁ Kelly’s view
For Kelly, this is a bullish continuation structure, but the market needs a healthy correction before the next strong move. Buying directly after a strong push is not the cleanest plan.
The better setup is to wait for gold to pull back into support, then watch whether buyers defend the ABC completion zone.
Gold is correcting inside a bullish structure.
If the buy zone holds, the next upside wave may continue towards 4,150–4,160.
Share your view below. Long 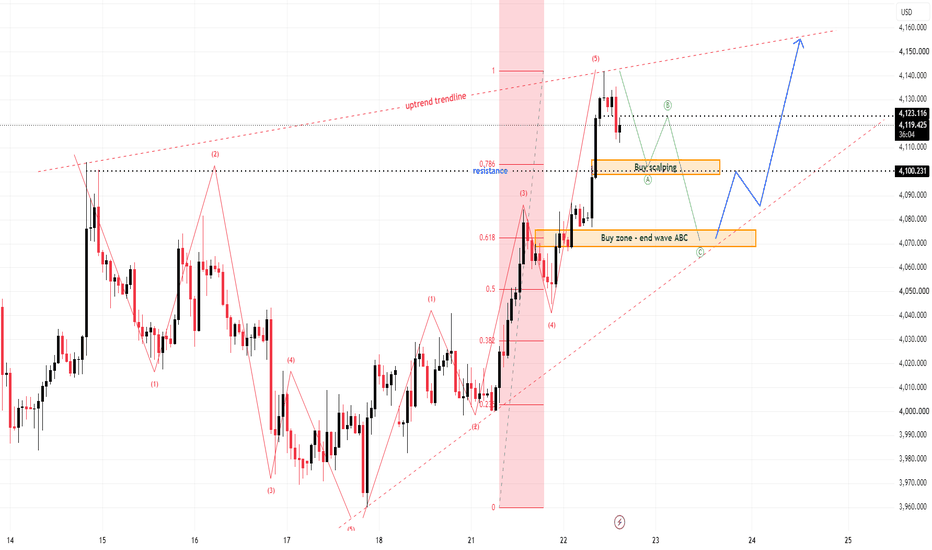
Short 
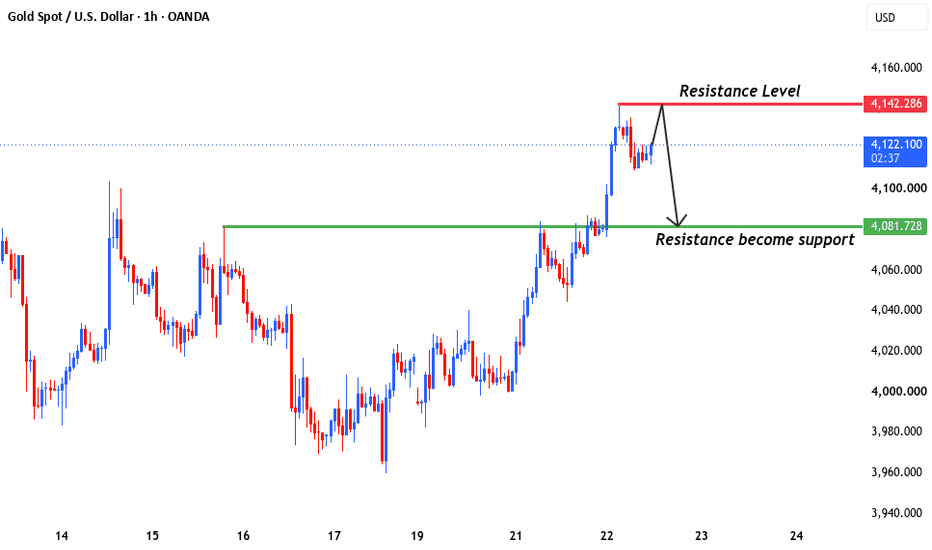
XAUUSD – Breakout Retest in FocusGold has extended its bullish momentum after breaking above the previous resistance zone around 4,082, confirming a stronger short-term market structure on the 1-hour timeframe.
Price is now approaching the 4,142 resistance level, where buyers may face fresh selling pressure. If price is rejected from this area, a pullback toward the 4,082 zone could develop. Since this level previously acted as resistance, market participants may watch whether it now provides support during any retracement.
A sustained move above 4,142 would indicate continued bullish strength and could open the way for further upside. On the other hand, a failure to hold above 4,082 may weaken the current momentum and increase the likelihood of a deeper correction.
Key Levels
🔴 Resistance: 4,142
🟢 Potential Support: 4,082
This analysis is based on price action and technical structure only. It is shared for educational purposes and does not constitute financial advice. Long