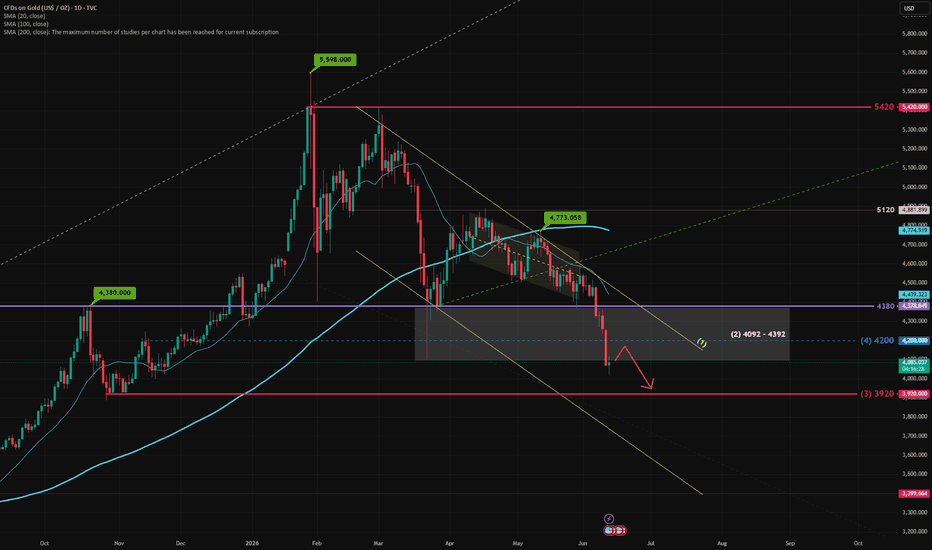
Long
Long

Short 
XAUUSD (Gold) 2H Analysis – Bullish Recovery Structure FormingGold is showing signs of a bullish recovery after completing a strong corrective decline. The recent price action has formed a rounded bottom structure, indicating that selling pressure is fading while buyers gradually regain control.
The blue descending trendline has been broken, signaling a potential shift in market sentiment from bearish to bullish. Since the breakout, price has established a series of higher lows and is consolidating beneath the 4,220 resistance zone.
A cup-shaped recovery pattern appears to be developing, with the current pullback acting as a potential handle formation. If buyers maintain momentum and push above the recent swing highs, XAUUSD could trigger a bullish continuation move toward the 4,240–4,260 region. Cup-and-handle structures are commonly viewed as bullish continuation or reversal setups when confirmed by a breakout above resistance.
Key Levels:
Resistance: 4,220 – 4,240
Support: 4,180 – 4,080
Bullish Target: 4,260+
Invalidation: Sustained move below 4,080
Trading Outlook:
As long as price remains above the rounded-bottom support area, the short-term bias remains bullish. Traders may watch for a confirmed breakout above resistance for additional upside confirmation, while failure to hold higher lows could delay the recovery scenario.
This analysis is based on price action and chart structure and is not financial advice.
#XAUUSD #Gold #TradingView #PriceAction #TechnicalAnalysis #Forex #Bullish #CupAndHandle #GoldTrading #MarketAnalysis #TradingSetup #ChartAnalysis Long 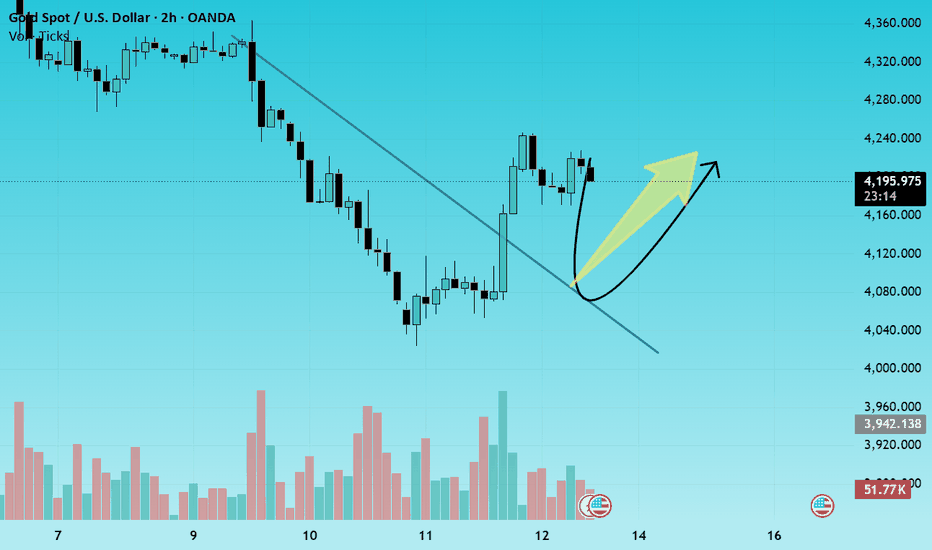
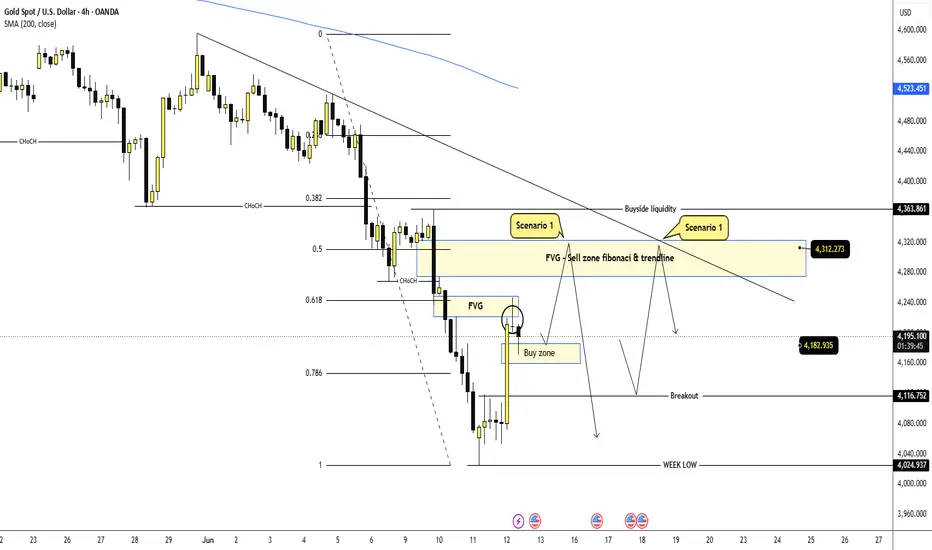
Gold May Recover Into Fibonacci 0.5 Before Sellers React Again
Gold is showing a short-term recovery after sweeping the weekly low area around 4,024. However, the broader H4 structure is still trading under the descending trendline and below the SMA 200, which means the current upside move should be treated as a corrective pullback unless price can break the higher resistance zone clearly.
FUNDAMENTAL ANALYSIS
Gold is still reacting strongly to the U.S. dollar, Treasury yields and upcoming U.S. data. The current rebound looks more like a technical recovery after sweeping lower liquidity, while the broader market has not confirmed a full bullish shift yet.
For now, I prefer using fundamentals as background only and focusing more on price reaction around the key Fibonacci, FVG and trendline zones.
TECHNICAL ANALYSIS – SMC + FIBONACCI
From an SMC perspective, gold has swept the lower liquidity near the weekly low around 4,024 and created a strong rebound. This reaction shows that buyers are active in the lower zone, but price is now approaching a more important decision area above.
The current buy zone around 4,160 – 4,182 is holding as short-term support. As long as price stays above this zone, gold may continue its corrective move toward the FVG and Fibonacci 0.5 area around 4,280 – 4,312.
This upper area is very important because it combines several technical factors: Fibonacci 0.5 retracement, FVG, previous liquidity, and the descending trendline. If price reaches this zone and starts to reject, it may become the main sell reaction area.
The bigger trend is still bearish while gold remains below the trendline and below the 4,363 buyside liquidity. A clean break above the sell zone would weaken the bearish view, but if sellers defend the Fibonacci area, gold may continue lower again toward 4,182, 4,116 and possibly back to the weekly low.
KEY PRICE ZONES TO WATCH
Current price area: 4,194
Short-term support / Buy zone: 4,160 – 4,182
Breakout level: 4,116
Fibonacci 0.5 / FVG sell zone: 4,280 – 4,312
Trendline reaction area: 4,280 – 4,312
Major buyside liquidity: 4,363
Nearest downside target: 4,182
Secondary downside target: 4,116
Weekly low: 4,024
Invalidation area for sell view: Above 4,312 – 4,363
TRADING SCENARIOS
Buy Scenario – Short-Term Recovery View
If gold holds above the 4,160 – 4,182 buy zone, I will watch for a short-term recovery toward the Fibonacci 0.5 area.
Buy Zone: 4,160 – 4,182
Entry Condition: Bullish rejection, liquidity sweep, or lower-timeframe CHoCH.
Stop Loss: Below 4,160 or below the nearest swing low.
Take Profit:
TP1: 4,240
TP2: 4,280
TP3: 4,312
Sell Scenario – Priority Reaction View
If gold reaches 4,280 – 4,312 and shows rejection, I will watch for a sell reaction from the Fibonacci 0.5, FVG and trendline confluence.
Sell Zone: 4,280 – 4,312
Entry Condition: Bearish rejection, failed breakout, or lower-timeframe CHoCH.
Stop Loss: Above 4,312 or above the nearest swing high.
Take Profit:
TP1: 4,182
TP2: 4,116
TP3: 4,024
Alternative Scenario
If gold breaks below 4,160 – 4,182 with strong momentum, the recovery idea becomes weaker and sellers may return earlier.
Sell Condition: Wait for a clean break and retest below the buy zone.
Target: 4,116 – 4,024
MY VIEW ON GOLD
My current view is that gold may continue its short-term recovery first, with the main upside area sitting around 4,280 – 4,312. This is the zone where I will watch sellers carefully because it combines Fibonacci 0.5, FVG and the descending trendline.
The cleaner plan is not to chase price in the middle. I prefer watching two reactions on the smaller timeframe: first, whether buyers can hold 4,160 – 4,182 for a move higher; second, whether sellers appear strongly around 4,280 – 4,312.
Overall, gold can still recover in the short term, but the main structure remains bearish unless price breaks above the trendline and holds above the sell zone.
Do you think gold will reach the 4,280 – 4,312 Fibonacci zone before sellers react again?
Long 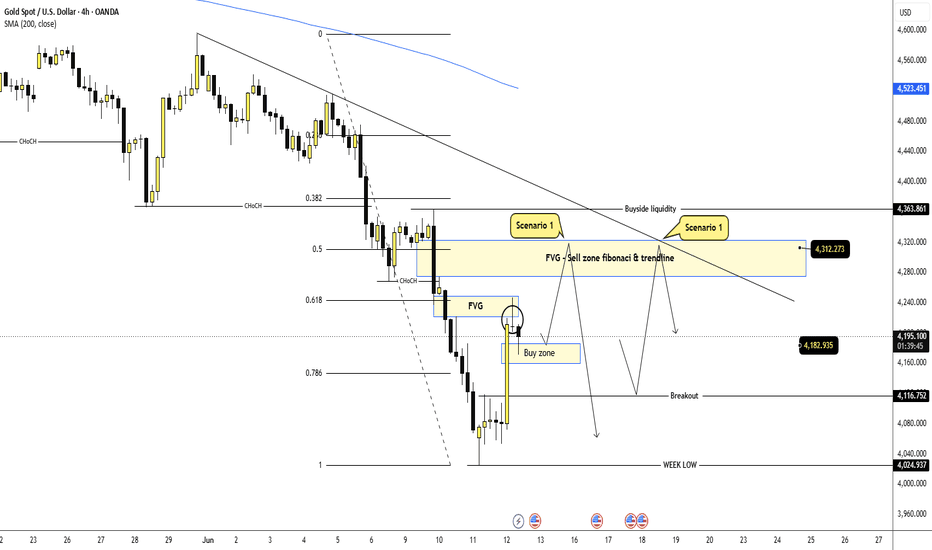
GOLD TESTS H4 423X: RECOVERY OR BEARISH?Gold continues to recover from the extreme selling pressure seen earlier this week after finding temporary support around the 1.618 Fibonacci extension zone. The rebound has been supported by softer inflation expectations, a weaker USD, and some short-covering activity following the aggressive decline that started after Non-Farm Payrolls.
However, from a broader macro perspective, very little has actually changed.
The market is still pricing a relatively resilient U.S. economy despite recent inflation data cooling slightly. Fed rate-cut expectations have improved marginally, but not enough to trigger a meaningful return of safe-haven flows into gold. At the same time, geopolitical concerns and energy markets have stabilized compared to previous weeks, reducing one of the major drivers behind gold's earlier rally.
This explains why the current recovery looks more technical than fundamental.
From a market structure perspective, gold has now reached one of the most important decision zones on the H4 timeframe. Price is testing the confluence of the broken descending trendline, Fibonacci 0.5 – 0.618 retracement, and a previously identified Demand zone. This area represents a major liquidity pocket where the market will likely decide whether the current recovery can extend further or if sellers regain control.
PRIMARY SCENARIO
The broader structure remains bearish.
Gold may continue pushing slightly higher into the Demand + Fibonacci 0.5 – 0.618 zone, sweeping liquidity above recent highs. However, if sellers successfully defend this confluence area, the recovery is likely to stall and the larger downtrend could resume.
In that case, attention returns to the lower Supply + Fibonacci zones, with the market potentially revisiting the recent lows and extending toward deeper liquidity areas below.
ALTERNATIVE SCENARIO
If buyers manage to reclaim the broken trendline and establish acceptance above the 0.618 Fibonacci level, gold could extend its recovery into the higher Demand and FVG zones overhead.
Even so, the market would still need to break multiple liquidity levels before a meaningful trend reversal could be considered.
SHORT-TERM BIAS
Bullish recovery into major resistance and liquidity zones.
LONG-TERM BIAS
Bearish while price remains below the broader descending structure and major overhead liquidity.
At this stage, the market is not confirming a new uptrend. Instead, it is testing a critical decision area where both technical structure and macro sentiment are about to collide.
LucasGrayTrading 🚀📉 Short 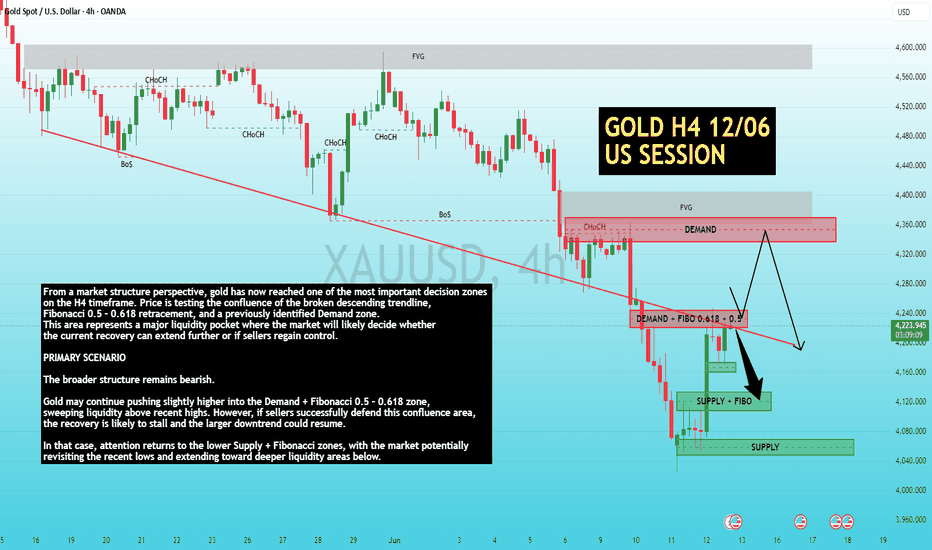
XAUUSD: Wave 2 at Key Decision ZoneGold is currently moving inside a wave 2 structure after the strong recovery from the lower liquidity area. From Kelly’s view, the market is now sitting in a sensitive accumulation zone, where the next confirmation will decide whether buyers continue the recovery or sellers regain control.
The key point is clear: bullish confirmation comes above 4,245, while bearish confirmation comes below 4,170.
⟡ Market structure
Price reacted strongly from the previous lower base and pushed into the upper area before starting to correct. The current pullback is now holding around the 4,170–4,180 accumulation zone, which makes this area important for the next directional move.
As long as gold holds above 4,170, the wave 2 correction can still remain valid. If buyers defend this zone and price later breaks above 4,245, the recovery structure may continue into the next bullish wave.
However, if price loses 4,170 with a clear confirmation candle, the wave 2 structure weakens and the market may rotate lower towards the buy liquidity area below.
➤ Key levels
◌ 4,170–4,180: accumulation and current decision zone
◌ 4,245: bullish confirmation level
◌ 4,204: key resistance before confirmation
◌ 4,135–4,145: buy-side liquidity reaction area
◌ 4,118: lower confirmation zone for uptrend recovery
◌ 4,053: deeper sell confirmation level if weakness expands
⌁ Elliott Wave view
From an Elliott Wave perspective, gold appears to be developing wave 2 after the initial recovery move.
Wave 1 created the first bullish impulse from the lower range. The current move can be read as wave 2 correction, where price is testing whether buyers can hold the structure before wave 3 develops.
If gold confirms above 4,245, the bullish wave count gains quality, and wave 3 may begin with stronger upside momentum.
If gold breaks below 4,170, the wave 2 structure loses strength, and the market may need to search for lower liquidity before rebuilding another recovery base.
▸ Trading scenario
Preferred scenario: wait for price to confirm above 4,245 before expecting bullish continuation.
Entry zone: after a confirmation candle above 4,245
Stop loss: below the confirmed higher low or below 4,170
Take profit 1: 4,280
Take profit 2: 4,298
Take profit 3: 4,350 if wave 3 expands strongly
Alternative scenario: if gold closes below 4,170 with clear momentum, the bullish wave 2 setup weakens. In that case, price may rotate lower towards 4,135–4,145 first, then 4,118 or 4,053 if selling pressure expands.
⌁ Kelly’s view
For Kelly, this is a confirmation-based wave 2 setup. The reaction around 4,170–4,180 is important, but the market still needs to prove strength above 4,245 before the bullish continuation becomes cleaner.
Gold is holding the decision zone now.
Above 4,245, the recovery can continue. Below 4,170, the structure turns fragile again.
Share your view below. Short 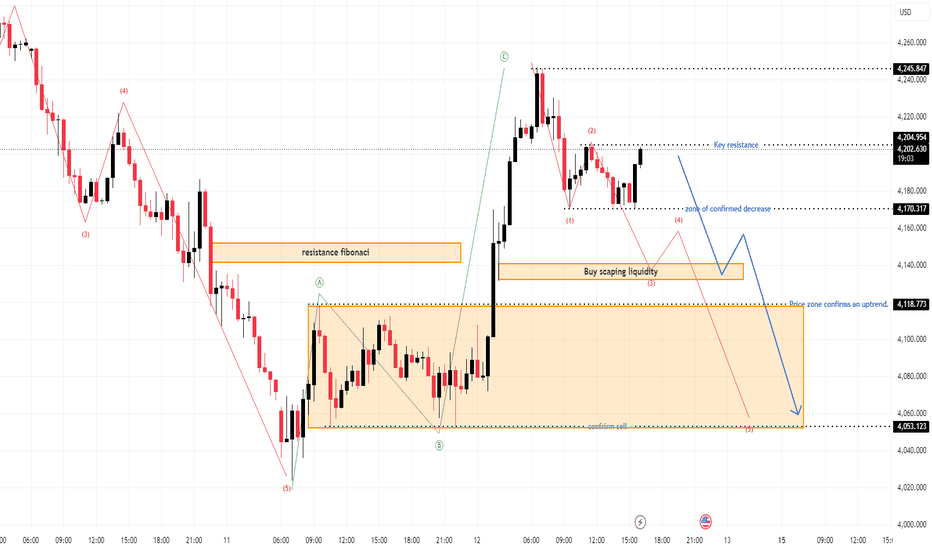
Long 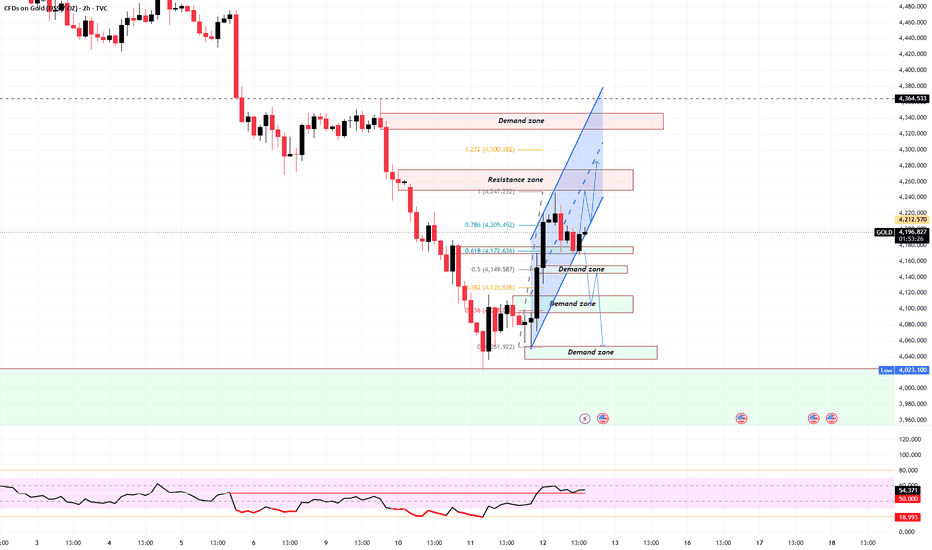
THE BIGGEST GOLD TRAP OF THE WEEK HASN'T HAPPENED YET!As per our last analysis, after the breakdown below $4100, we were expecting a reversal — and we got a very strong confirmation of that yesterday.
Gold delivered an excellent one-sided “rocket” move during the late New York session, just a few hours before the market closed. This move trapped a majority of sellers who had entered positions at lower levels. Their stop losses were hit aggressively, which created a sharp stop-loss hunt rally.
At the same time, the minimum target I mentioned around $4173 was also cleanly broken, confirming strong upside momentum. Overall, it was a very impressive bullish move.
But the real question is:
Has gold changed its direction, or is it still bearish?
Let’s break it down.
There’s no doubt that we saw a proper liquidity sweep and reversal yesterday. Honestly, this move was expected. For the past few weeks, gold has been consistently bearish, and when a major support like $4100 breaks, it naturally attracts panic sellers.
Many traders jumped into selling positions randomly — and this is exactly the kind of liquidity the market needed. To trap those sellers, the market makers pushed price strongly upward.
Current Market Psychology
Right now, the situation is very interesting.
Most traders will hesitate to buy because the recent fall in gold was very strong and the overall trend has been bearish for weeks.
So naturally, the majority of the crowd will still prefer selling, expecting further downside.
But here’s the key insight:
Since a major liquidity sweep has already happened, continuous downside from here becomes less likely.
Instead, the market’s focus now will likely be trapping remaining sellers at lower levels and trapping fresh intraday sellers.
Important Comparison
We saw a similar strong upside move around May 28, but back then, gold couldn’t sustain because bearish pressure was very strong. Eventually, the market continued downward.
Because of that past behavior, many traders will again expect the same outcome — more downside.
But this time, the outcome may be different.
This time, sellers below $4400 could get trapped and the market may push higher before deciding the next major direction.
Today’s Intraday Plan
For today, my plan is very clear.
I will prefer waiting patiently or taking small scalps because after such a strong move, the market usually doesn’t continue in one direction immediately.
What I Expect Now
Right now, traders who missed yesterday’s rally will see today’s retracement as a buying opportunity.
At the same time, sellers are also getting opportunities due to the formation of a lower low structure in the short term.
Because of this mixed behavior, the market is creating confusion on both sides.
Key Level to Watch: $4208
As long as gold does not give a strong breakout above $4208, I expect a zigzag selling move.
Sellers will keep entering, buyers who are entering early will keep getting trapped, and their stop losses will be hit repeatedly.
Eventually, buyers may lose confidence and believe that the trend is still bearish.
And that’s exactly when the market could again deliver a strong liquidity hunt move on the upside.
Upside Potential
There is still room for gold to move toward $4278.
As mentioned in my previous analysis, many sellers’ stop losses are still pending below $4420, and the market may target those levels.
Key Buying Zone
I am watching $4132–$4146 as a critical zone.
From this area, I expect a strong buying reaction with the potential for a move toward $4200+.
If gold gives a strong breakout above $4208, then I will directly target $4278.
Final Thoughts
Weekly volume is strong.
In such conditions, it’s better to aim for bigger targets.
Be patient, wait for confirmation, execute with confidence, manage risk properly, and hold trades with conviction.
That’s my complete plan for today.
I hope this detailed psychological and technical breakdown helps you understand the market better and prepares you for trading.
Good luck for the last trading day of the week — hope you close it in profit.
Also, I’d like to know your view — what’s your market analysis? Share it in the comments.
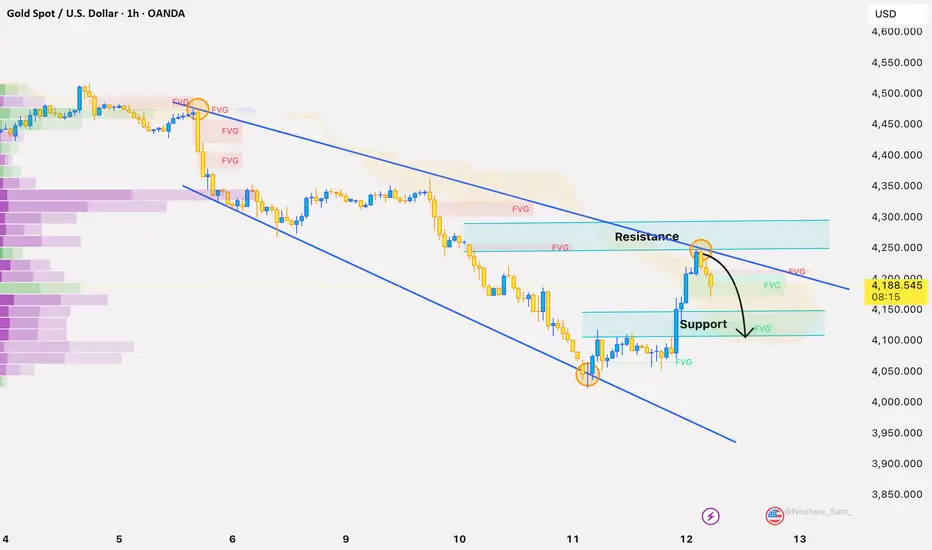
XAUUSD — Sell Below EMA Trend From Liquidity Resistance
Fundamental Analysis
Gold remains under pressure as the market continues to watch USD strength, Treasury yields, and upcoming U.S. data. The current structure still favours sellers while price trades below the main EMA resistance.
For now, any recovery should be treated as a technical pullback unless gold can reclaim the key resistance zone with strong confirmation.
Technical Analysis
On the 1H chart, XAUUSD is still trading below EMA 34, EMA 89, and EMA 200. This shows that the short-term trend remains bearish, with the EMA structure acting as dynamic resistance above price.
Price is also moving inside a descending channel. After the previous bullish reaction from the lower area, gold is now slowing below the EMA zone again, which means sellers may still control the structure.
The key sell area is around 4,249 - 4,283. This zone is important because it combines the previous key support zone, liquidity resistance, and the upper reaction area below EMA pressure. If price retests this area and rejects, the bearish continuation setup becomes cleaner.
Below current price, the next liquidity zone is around 4,055 - 4,065. If sellers break this area, the next downside target may extend toward 4,024 and then 3,953.
Important Key Levels
Current price area: 4,178
Main sell zone: 4,249 - 4,283
Key support turned resistance: 4,249 - 4,283
EMA resistance area: 4,205 - 4,300
Nearest liquidity target: 4,055 - 4,065
Key downside level: 4,024
Extended bearish target: 3,953
Invalidation area: above 4,300
Trading Scenario
Main Sell Scenario
Entry: 4,249 - 4,283
Stop Loss: 4,300
Take Profit 1: 4,055
Take Profit 2: 4,024
Take Profit 3: 3,953
Sell Condition
The preferred setup is to wait for gold to retest the 4,249 - 4,283 resistance zone. This is the main liquidity sell area on the chart and also aligns with the broken support structure.
A sell setup becomes more valid if price forms bearish rejection from this zone, such as a long upper wick, bearish engulfing candle, failed breakout, or lower high below the EMA structure.
If price rejects from the sell zone and breaks below 4,159 - 4,150, the bearish continuation view becomes stronger. The next downside focus would be 4,055 - 4,065, followed by 4,024 and 3,953.
Entry Conditions
Wait for price to retest 4,249 - 4,283.
Look for bearish rejection before entering sell.
Do not sell directly at the lows without a pullback.
If price breaks and holds above 4,300, the sell setup is invalid.
Overall, the main view remains bearish while XAUUSD trades below the EMA structure and inside the descending channel. The preferred plan is to wait for price to retest the 4,249 - 4,283 liquidity resistance zone, then look for sell confirmation toward 4,055, 4,024, and 3,953.
Do you share the same bearish view on gold, or are you waiting for a cleaner retest of the sell zone first?
Short 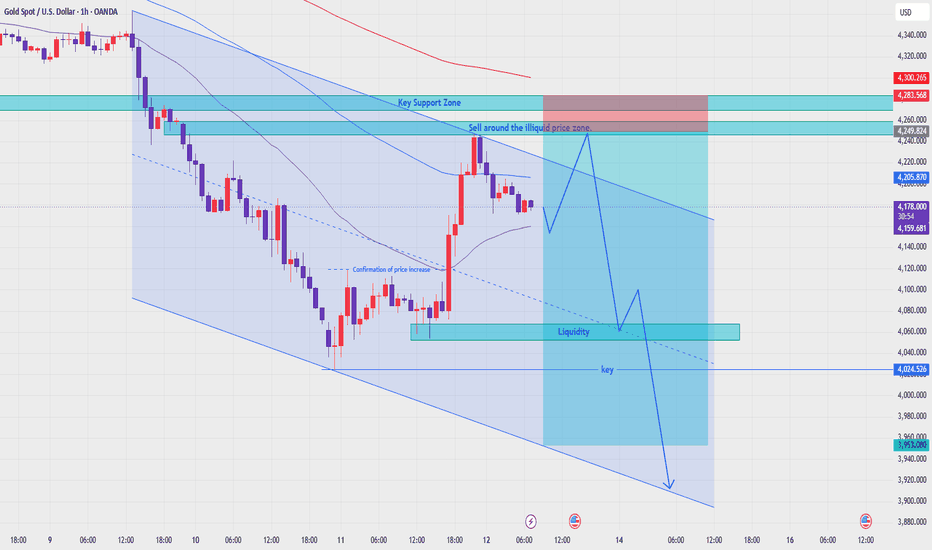
XAUUSD — Doji Reversal From Psychological Buy Zone
Fundamental Analysis
Gold remains sensitive after a strong bearish move into lower liquidity. The market is still watching USD strength, Treasury yields, and upcoming U.S. data, which may create volatility around the current support zone.
For now, the broader pressure is still bearish, but the reaction from the psychological buying zone shows that a short-term recovery may develop if buyers confirm control.
Technical Analysis
On the 6H chart, XAUUSD is still moving inside a descending channel, with EMA 34, EMA 89, and EMA 200 above price. This means the main trend has not fully turned bullish yet.
However, price has reached the 4,090 - 4,110 psychological buying zone and formed a doji-style reversal candle. This shows seller hesitation and may support a corrective bounce.
If buyers defend this zone, gold may recover toward 4,200 first, then 4,270 - 4,320, where the accumulation zone and descending trendline are located. This area will be important for the next reaction.
Important Key Levels
Current price area: 4,107
Psychological buying zone: 4,090 - 4,110
Doji reversal area: 4,090 - 4,110
Invalidation below: 4,047
Nearest recovery level: 4,200 - 4,220
Accumulation zone: 4,270 - 4,320
Trendline reaction zone: 4,270 - 4,320
EMA reaction area: 4,323 - 4,450
Higher EMA resistance: 4,566
Trading Scenario
Main Buy Scenario
Entry: 4,090 - 4,110
Stop Loss: 4,047
Take Profit 1: 4,200
Take Profit 2: 4,270
Take Profit 3: 4,320
Buy Condition
The preferred setup is to wait for gold to hold the 4,090 - 4,110 psychological buying zone. The doji candle near this area is an early sign that bearish momentum may be slowing down.
A buy setup becomes more valid if price confirms the doji reversal with bullish follow-through, such as a strong bullish candle close, higher low formation, or a reclaim above 4,120 - 4,140.
If this confirmation appears, the recovery move may target 4,200 first, then 4,270 - 4,320.
Alternative Sell Scenario
Entry: 4,270 - 4,320
Stop Loss: 4,360
Take Profit 1: 4,200
Take Profit 2: 4,110
Take Profit 3: 4,047
Sell Condition
This is not the main immediate view, but it should be monitored. If gold recovers into the accumulation zone and fails to break above the descending trendline, sellers may react again.
A sell setup becomes more valid if price forms bearish rejection from 4,270 - 4,320, such as a long upper wick, bearish engulfing candle, failed breakout, or lower high below the EMA structure.
Entry Conditions
Wait for bullish confirmation after the doji candle.
A reclaim above 4,120 - 4,140 would strengthen the buy setup.
If price breaks below 4,047, the recovery setup is invalid.
Watch for rejection if price reaches 4,270 - 4,320.
Always manage risk because gold can sweep liquidity before reversing.
Overall, the current view is that gold may attempt a corrective recovery after forming a doji reversal candle near the psychological buying zone. If buyers defend 4,090 - 4,110, XAUUSD may recover toward 4,200 first, then 4,270 - 4,320 where the accumulation zone and trendline reaction area are located.
Do you share the same view that gold may recover from this psychological buying zone, or are you waiting for stronger confirmation above 4,140?
Long 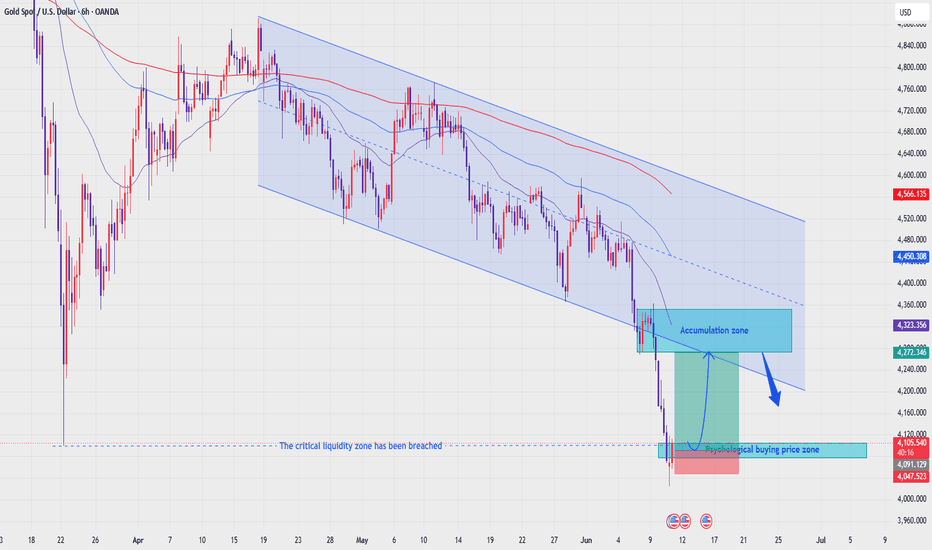
XAUUSD - Bullish Recovery Confirmed, Buy Setup Remains Priority
Gold is trading around $4,180 after a strong bullish displacement from the weekly low near $4,024. Price has created a clear CHoCH and reclaimed short-term structure, showing that buyers are starting to control the intraday move.
From an SMC perspective, gold swept sell-side liquidity first, then reacted strongly from the lower OB and pushed through the previous structure. The current pullback is normal after the strong move up, and the key area to watch is the FVG buy zone around $4,115–$4,135.
As long as gold holds above this FVG zone, the bullish continuation scenario remains valid. The next upside target is the IFVG area around $4,180–$4,200, followed by the higher OB zone around $4,330–$4,350.
Buy setup
Condition:
Gold must pull back into the $4,115–$4,135 FVG buy zone and show bullish rejection. Entry is only valid after lower-timeframe MSS / CHOCH confirms buyers are stepping back in.
Entry: $4,115–$4,135
SL: below $4,085
TP1: $4,180
TP2: $4,220
TP3: $4,330–$4,350
Continuation buy setup
Condition:
If gold holds above $4,180 and breaks back above $4,220 with bullish displacement, a continuation setup can be considered after retest.
Entry: $4,180–$4,200 after breakout retest
SL: below $4,155
TP1: $4,220
TP2: $4,280
TP3: $4,330–$4,350
Sell setup
Condition:
A sell setup is only valid if gold fails to hold above $4,115 and breaks below the FVG zone with bearish displacement.
Entry: below $4,110 after bearish retest
SL: above $4,140
TP1: $4,080
TP2: $4,045
TP3: $4,024
Key levels
Current price area: $4,180
Main buy FVG zone: $4,115–$4,135
Lower OB support: $4,075–$4,095
Week low: $4,024
Short-term resistance: $4,220
Main upside target: $4,330–$4,350
Bullish invalidation: clean 1H close below $4,085
My current view is bullish while gold holds above the FVG buy zone. The best Prime Gold plan is to wait for price to return into a clean liquidity area, confirm rejection, then follow the next upside move.
No confirmation, no trade.
Long 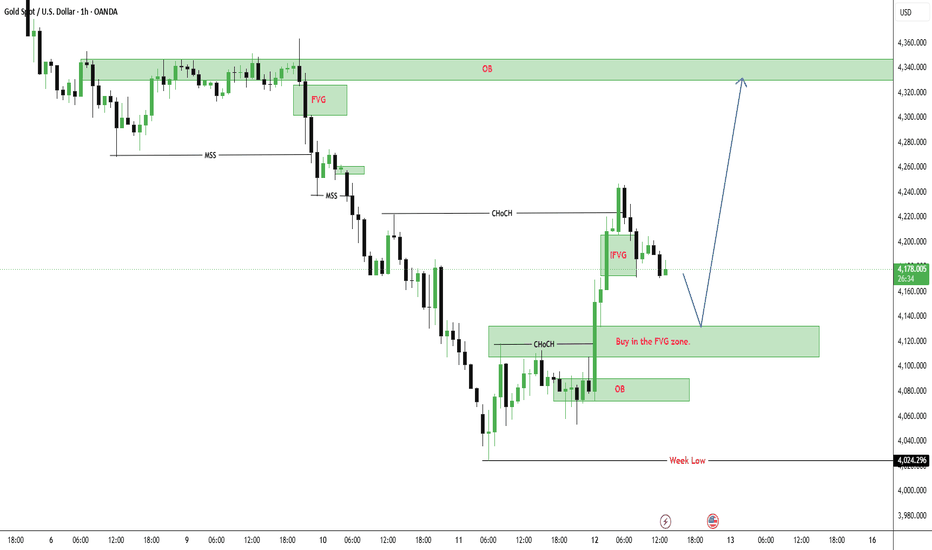
Long 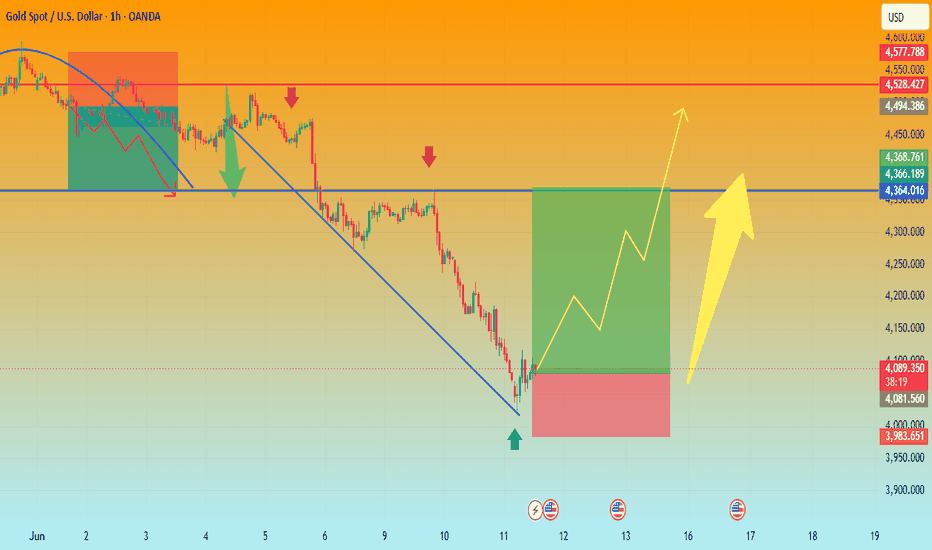
XAUUSD (Gold Spot / U.S. Dollar) 1-Hour Chart: Bullish Reversal This is a 1-hour (1h) interval chart for Gold Spot / U.S. Dollar (XAUUSD) sourced from TradingView via OANDA. The chart illustrates a projected bullish reversal strategy following a distinct bearish descent, utilizing a harmonic or "Cup and Handle" style curved trajectory to forecast a massive upside rally.
Key Technical Elements & Price Levels
Current Price: The market is currently trading at 4,086.450, showing a slight minor intraday decline of -0.19% (-7.905).
The Bearish Phase (Left Side): Following a period of consolidation around the 4,337 level (marked by the red arrow and yellow horizontal box), the price broke downward sharply through June 10th and 11th. This downward channel is highlighted by a light-blue descending parallel channel with Fibonacci/coefficient text (0.8816...).
The Curve (The "Cup" Bottom): A prominent black curved line traces a rounded bottom, suggesting that the bearish momentum is exhausting around the 4,012 - 4,040 zone, setting up a structural floor.
The Long Setup (Green/Red Risk-Reward Box):
Entry Zone: Positioned right at the current price floor near 4,086 - 4,102, marked by a small yellow support rectangle.
Stop Loss (SL): Placed just below the recent swing low at 4,012.524 (red risk zone).
Take Profit (TP): Targeted at a major historical structural high of 4,503.389 (green reward zone).
Market Forecast
The analyst has outlined a zigzagging bullish path (green and black arrowed lines) expecting the price to bounce hard off the current support level. The massive green arrow on the right heavily emphasizes a strong Bullish Outlook, anticipating that the asset will break back past the 4,300 resistance levels to march toward the 4,500+ milestone over the coming trading sessions (June 12th–16th). Long 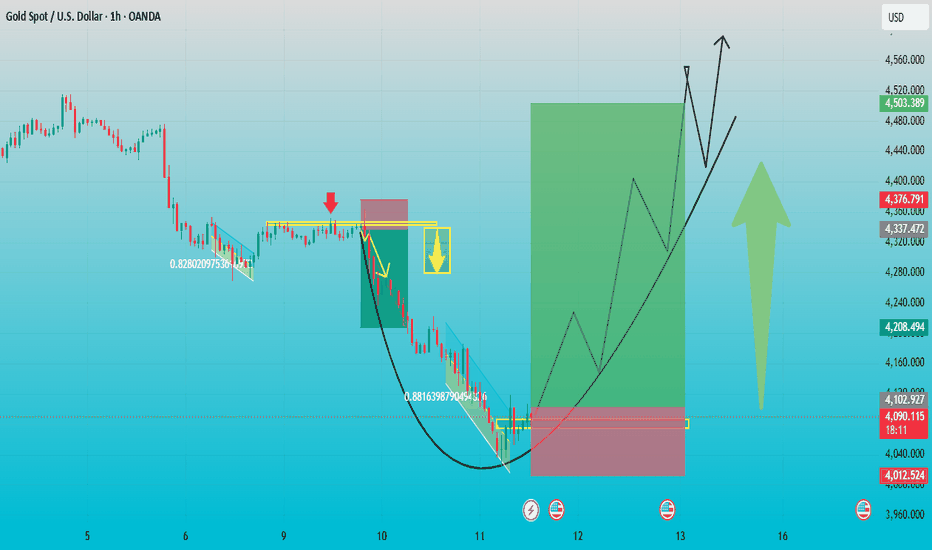
Short 
Has gold bottomed at 40XX, or another selloff ahead?Gold entered a technical recovery phase after yesterday’s CPI release. However, the key point is that inflation data came in largely in line with market expectations and failed to deliver a meaningful surprise. As a result, the report was not strong enough to change broader market sentiment or trigger a significant shift in capital flows.
Instead of rushing back into safe-haven assets, investors remain in a wait-and-see mode, looking for clearer signals regarding U.S. economic growth and the Federal Reserve's policy path. This lack of conviction has become one of the main reasons behind gold's persistent decline over the past several sessions.
With safe-haven demand fading and liquidity gradually drying up, gold has continued to lose support and slide lower, particularly after the bearish confirmation triggered by last week's Non-Farm Payrolls report. The market eventually reached the 1.618 Fibonacci Extension zone, where buyers finally stepped in and created a temporary bottom.
Although gold has recovered nearly 1,000 points from this area, the rebound remains relatively weak compared to the scale of the previous selloff. So far, the move appears to be driven more by short-covering and technical buying than by genuine institutional accumulation. The broader market narrative remains unchanged: capital is not aggressively returning to gold.
Attention now turns to today's PPI and Unemployment Claims data. While these releases may create short-term volatility, they are unlikely to alter the dominant trend unless they significantly reshape expectations regarding Fed policy and economic growth.
PRIMARY SCENARIO
Gold continues to recover from the Supply + Fibonacci 1.618 zone, seeking liquidity at the overhead Demand + Fibonacci resistance areas.
If sellers successfully defend these zones, the broader bearish trend is likely to resume. The market could then continue toward the next major liquidity targets around 400x–392x, where larger support and liquidity pools remain.
ALTERNATIVE SCENARIO
If PPI comes in significantly weaker than expected and unemployment claims rise sharply, gold could extend its recovery into higher demand zones. However, any bullish move should still be viewed as corrective until price can reclaim major resistance levels and invalidate the current bearish structure.
SHORT-TERM BIAS
Bullish recovery toward overhead resistance and liquidity zones.
LONG-TERM BIAS
Still bearish while price remains below key liquidity areas and fails to reclaim the broader descending structure. Current rallies should be viewed as corrective moves within a larger downtrend until proven otherwise.
LucasGrayTrading 🚀📉 Short 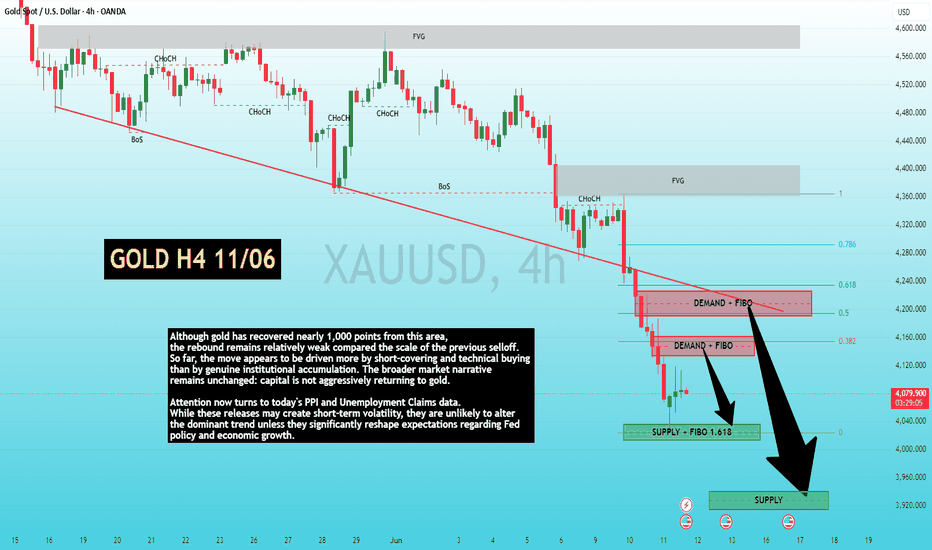
Gold Rally Faces First Major Test Near $4,220Gold has bounced strongly from recent lows, but traders remain cautious as the broader trend still favours sellers. Markets continue to monitor US inflation figures and Federal Reserve commentary for clues about future interest-rate policy.
The rebound has been impressive in terms of speed, yet the inability to push beyond the $4,220 area suggests that sellers are still active at higher prices. This makes the current move look more like short covering than a genuine trend change.
From a trading perspective, the key question is whether buyers can hold gains above $4,200 or if the market will roll over once again.
Trade Setup:
Sell Zone: $4,210 – $4,220
Stop Loss: $4,285
Take Profit 1: $4,100
Take Profit 2: $4,050
Take Profit 3: $4,000
Unless gold reclaims the $4,220–4,300 region, rallies may continue to attract selling interest. Short 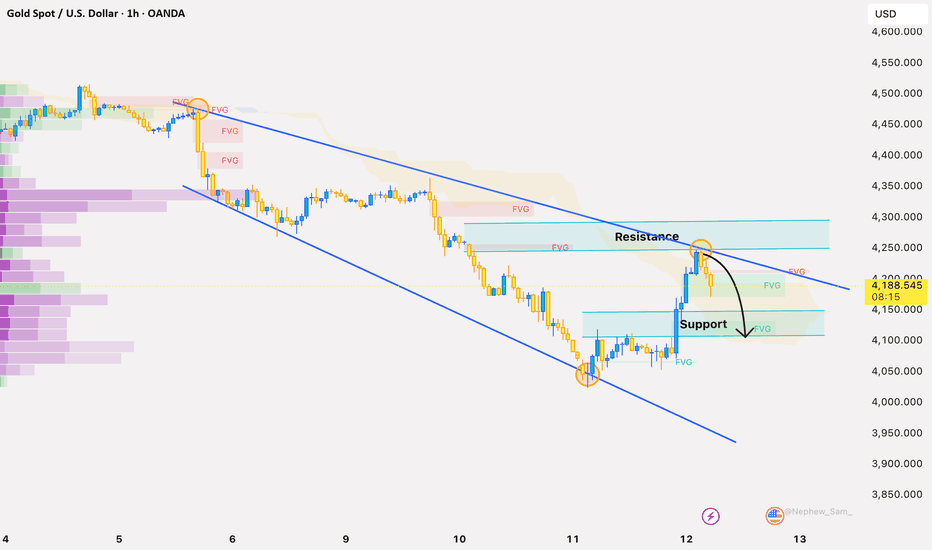
xau/usdXAU/USD remains under strong bearish pressure on the 15-minute timeframe after a sharp rejection from the 4219 resistance area. The chart shows sellers firmly in control, pushing gold lower through multiple support levels and creating a sequence of lower highs and lower lows. The recent bearish impulse drove price into the key support zone around 4170–4182, where buyers have started to show some interest.
Currently, gold is trading near 4182, attempting to stabilize after the aggressive sell-off. The support level at 4170.85 is crucial; a sustained hold above this area could trigger a corrective rebound toward 4190 and potentially 4219, which remains the nearest major resistance level. However, any recovery is likely to face selling pressure unless buyers reclaim higher ground.
If price breaks decisively below 4170, the next downside objective could be the broader demand zone near 4158–4160, highlighted on the chart. Overall, the short-term outlook remains bearish, with traders watching support behavior closely for signs of either continuation or reversal. Long 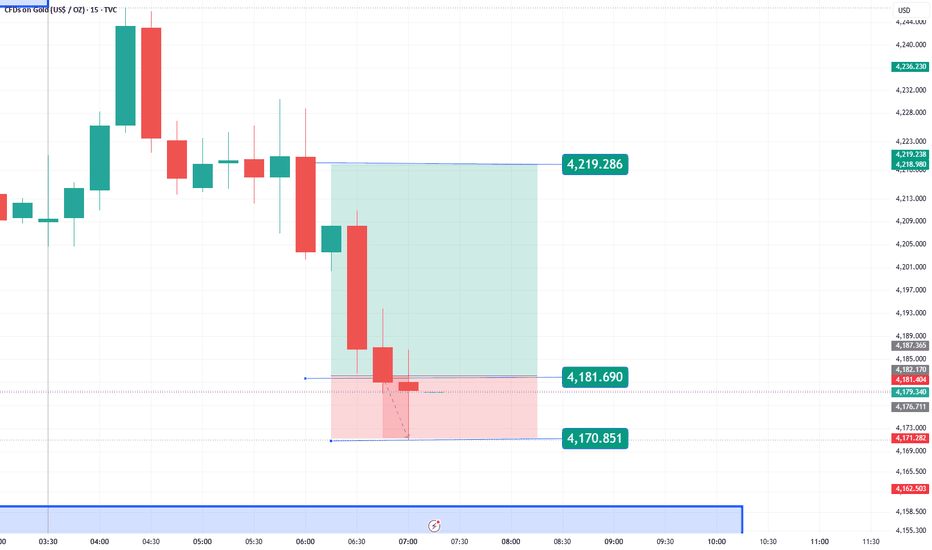
XAUUSD | Key Reversal Zones for Today — First Touch = 80 PipsGold is currently trading at 4,206, sitting between
key supply and demand zones mapped by my indicator.
📍 Current Price: 4,206
📊 Timeframe: 15 Minutes
⚠️ DISCLAIMER
This is purely technical analysis for educational
purposes only. This is NOT financial advice.
Always do your own research before making
any trading decisions.
━━━━━━━━━━━━━━━━━━━━━
🔴 SELLING ZONES
━━━━━━━━━━━━━━━━━━━━━
🔴 Selling Zone 1 — 4,072 to 4,080
Closest resistance above current price.
Expect sellers to step in strongly on any bounce here.
🎯 First Touch Target: 80 Pips
🔴 Selling Zone 2 — 4,099 to 4,109
Strong supply area.
Heavy rejection expected if price reaches here.
🎯 First Touch Target: 80 Pips
━━━━━━━━━━━━━━━━━━━━━
🟢 BUYING ZONES
━━━━━━━━━━━━━━━━━━━━━
🟢 Buying Zone 1 — 4,036 to 4,045
First demand area below current price.
Expect buyers to step in strongly here.
🎯 First Touch Target: 80 Pips
🟢 Buying Zone 2 — 4,009 to 4,018
Deeper support zone.
High probability bounce if Zone 1 fails.
🎯 First Touch Target: 80 Pips
━━━━━━━━━━━━━━━━━━━━━
💡 HOW THE INDICATOR WORKS
━━━━━━━━━━━━━━━━━━━━━
On the first touch of any zone — buy or sell —
the first target is always 80 pips from entry.
Zones are automatically detected by my indicator
using price structure and historical reaction levels.
━━━━━━━━━━━━━━━━━━━━━
Follow my profile for daily XAUUSD zone updates 📊
⚠️ This is technical analysis only.
Not financial advice. Trade at your own risk. 🙏 XAUUSD | Bearish Structure Remains IntactGold has confirmed a clear CHOCH (Change of Character), shifting market structure from bullish to bearish. Since then, price has been printing lower highs and lower lows, suggesting sellers remain in control. CHOCH is commonly used by SMC traders as an early sign of a potential trend reversal, while FVGs often act as areas where price may retrace before continuing in the prevailing direction.
🔍 Key Levels to Watch:
• Weekly Demand Zone: 4,000 – 4,080
• Fibonacci Retracement Zone:
50% = 4,380
61.8% = 4,430
My preferred scenario is a short-term reaction from the weekly demand area, followed by a retracement into the 50%-61.8% premium zone. If sellers defend this area, it could provide a high-probability continuation setup toward lower targets.
🎯 Bearish Targets:
• 4,100
• 4,000
• 3,900
⚠️ Invalidation:
A sustained move and acceptance above 4,430 would weaken the bearish outlook and increase the probability of a deeper recovery.
As long as price remains below the Fibonacci resistance zone, rallies look corrective rather than impulsive.
What is your bias on Gold this week? Short 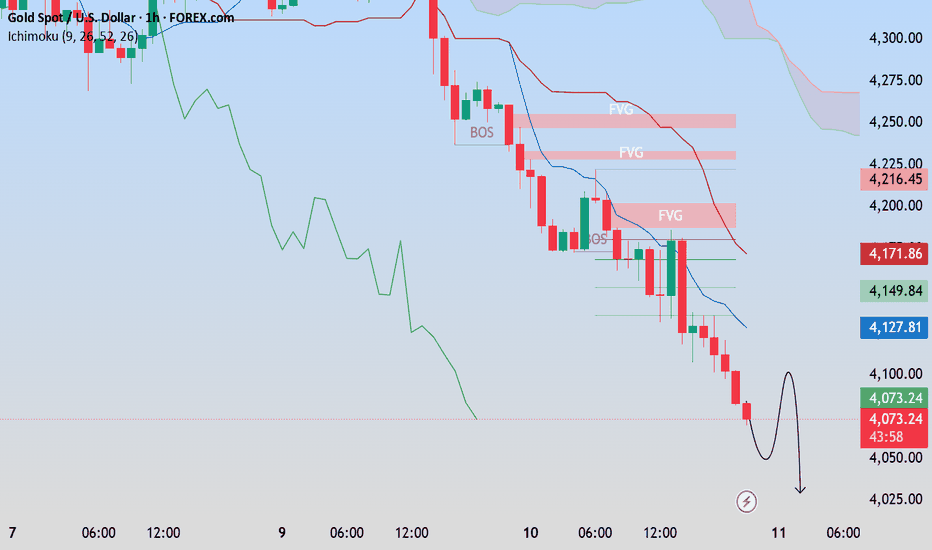
Short