Short
Short
Short 
Bitcoin Bybit chart analysis MARCH 9
Hello
It's a Bitcoin Guide.
If you "follow"
You can receive real-time movement paths and comment notifications on major sections.
If my analysis was helpful,
Please click the booster button at the bottom.
This is the Bitcoin 30-minute chart.
No Nasdaq indicators released.
The New Gap retracement has been completed.
Today, there are many important points from a medium-term perspective.
*When the red finger moves,
Long position strategy before and after the purple finger touches.
1. After touching the first section of the purple finger (autonomous shorting)
$67,151.6 long position switching / stop loss if the purple support line is broken.
2. $70,042.1 long position first target -> Top, second target.
If the price fails to touch the first section at the top and immediately falls,
$66,095.9 long position entry point in the second section / stop loss if the green support line is broken.
- After breaking out of the second section, the bottom -> the maximum is $64,408.
$64,408 is a level that should not be broken in a medium-term uptrend. If it touches, please watch to see if it holds until the end of the month.
- A breakout of the orange resistance line is considered a true rebound.
Please use my analysis to this point for reference only.
I hope you operate safely, with a principled trading strategy and stop-loss orders essential.
Thank you. Long 
Bitcoin Retesting Trendline Support – Potential Bullish Reversal1️⃣ Uptrend Structure
The green diagonal zone shows a clear ascending trendline.
Price has respected this trendline multiple times (green circles mark the bounces).
Each touch created higher lows, confirming a healthy uptrend.
This means buyers are consistently stepping in at higher prices.
2️⃣ Breakout Behavior
On the left side of the chart there are two clear breakout structures.
Price consolidated, broke resistance, and continued upward.
This indicates strong bullish momentum earlier in the trend.
3️⃣ Current Market Position
Right now Bitcoin is:
Trading around $70.8K
Sitting exactly at the trendline resistance / previous structure
Approaching the marked reversal area (~$70K)
This zone is critical because it is:
Previous resistance
Trendline interaction
Psychological level $70K
4️⃣ Two Possible Scenarios
🟢 Bullish Scenario (Higher Probability if $70K Holds)
If price holds above the trendline and $70K support:
Targets could be:
$71,800
$72,500
$73,000 – $73,500
This aligns with the blue projected move on your chart.
🔴 Short-Term Pullback Scenario
If price rejects the reversal zone:
Possible retrace levels:
$69,800
$69,200
$68,500 (trendline retest)
A pullback to the trendline would still keep the overall uptrend intact.
5️⃣ Key Levels to Watch
Level Importance
$70,000 Major support / reversal zone
$71,000 Immediate resistance
$72,000 Momentum confirmation
$73,000+ Bullish expansion target
✅ Overall Bias:
Bullish continuation while price stays above the trendline (~$69.5K–$70K).
💡 Trading Insight:
The best setups usually occur when price retests the trendline and prints a bullish confirmation candle (engulfing / strong close). Long 
Short 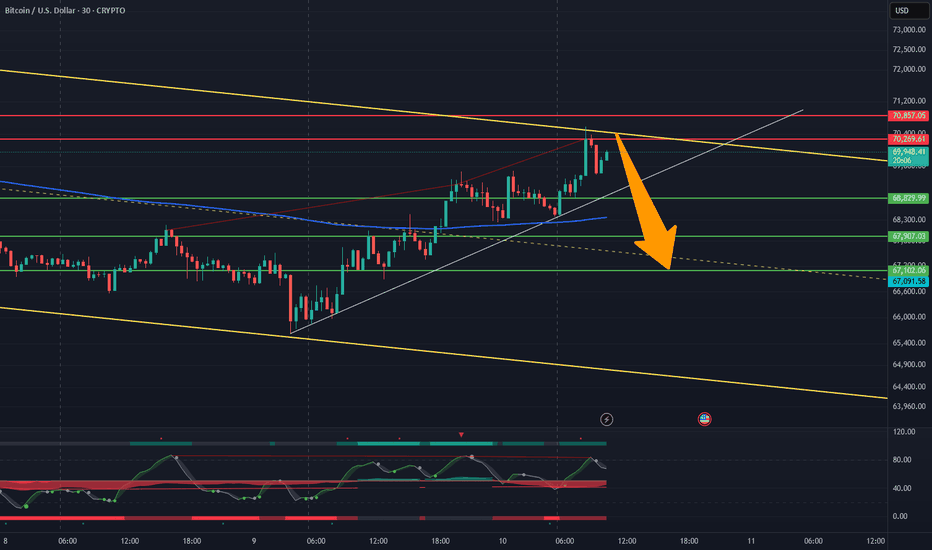
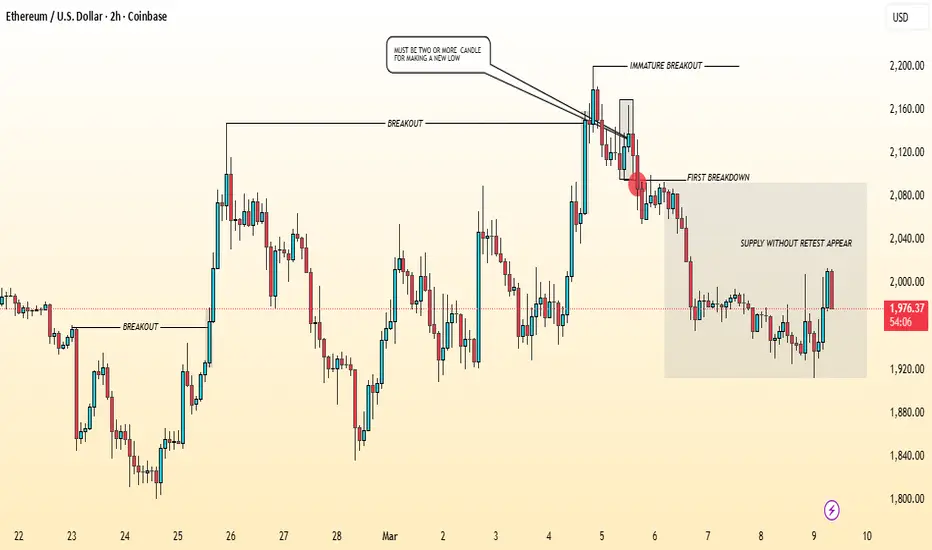
Ethereum Outlook: Key Levels to Watch Amid Ongoing VolatilityThe cryptocurrency market continues to experience persistent volatility, and Ethereum remains closely tied to the broader four-year crypto market cycle. After recently dropping to its lowest level since May 2025, Ethereum is attempting to stabilize, but the market structure still shows signs of weakness.
Over the past week, Ethereum has seen short-term buying interest, yet the price remains below the critical resistance zone at $2,100–$2,200. As long as Ethereum trades under this range, bearish pressure may remain dominant, leaving the market vulnerable to additional downside movement.
On the support side, Ethereum recently tested an important support band between $1,650–$1,750. This area represents a major technical checkpoint. If the market manages to hold above this zone, it could help establish a potential long-term bottom, which historically has created attractive accumulation areas during previous market cycles.
However, a deeper move toward $1,350–$1,400 would represent a stronger capitulation phase, where heavy selling often clears weaker hands from the market. Such a scenario could ultimately create a healthier foundation for a longer-term recovery.
For the bullish case, a sustained breakout above $2,600–$2,800 would be a significant technical signal, suggesting that the market may have already formed a major bottom and could be transitioning toward a new recovery phase.
Key Levels to Watch
Resistance: $2,100 – $2,200
Major breakout confirmation: $2,600 – $2,800
Primary support: $1,650 – $1,750
Potential capitulation zone: $1,350 – $1,400 BNB trade delivered roughly a 4–5% move in a short timeCRYPTOCAP:BNB Update
Yesterday I pointed out the 614–615 horizontal support, the same level where we previously caught a strong bounce. When price returned to this zone again, it created another high-probability long opportunity, and we took it.
The reaction came exactly as expected.
From the entry around the support region, CRYPTOCAP:BNB pushed up toward 640, delivering roughly a 4–5% move in a short time. This confirms again how powerful well-tested horizontal levels can be when buyers step in.
This is why I always say — when the structure is clear, the market usually respects it.
Current plan:
• Move Stoploss to entry or lock it around 620
• Protect the profits first
• Let the remaining position run if momentum continues
Taking profit is important, but securing profit is even more important. Smart trading is not just about catching moves — it’s about protecting the gains once the market gives them.
If momentum continues above the current zone, the next upside area still sits around 650–665, which previously acted as supply.
For now, the trade already delivered a solid move from the support reaction.
If you followed the setup, you know how clean the entry was.
Stick to the plan. Protect the gains. Let the market do the rest.
And if you enjoy these setups, don’t forget to like, comment, and share with your crypto mates. 🚀  Long
Long
Education

$LUNC is forming an inverse head and shoulders on the 1H chart CRYPTOCAP:LUNC is forming an inverse head and shoulders on the 1H chart, which could mean a short-term bounce after the recent drop. Price is now trading around 0.0000419, sitting just below the neckline resistance near 0.0000425.
The market has already printed the left shoulder, head, and right shoulder, and price is now consolidating right under the neckline. This area is important because it decides whether the pattern confirms or fails.
If buyers manage to break and hold above 0.0000425, the inverse H&S pattern activates. That move could push price toward 0.0000435–0.0000450, where the next liquidity and resistance zones sit.
However, the breakout must be clean. Weak wicks above the neckline without follow-through often lead to another rejection.
If price fails to reclaim 0.0000425, LUNC may continue ranging or retest the 0.0000410–0.0000400 support zone, where the head previously formed.
Key levels to watch
Neckline resistance: 0.0000425
Breakout targets: 0.0000435 → 0.0000450
Support zone: 0.0000410–0.0000400
For now, price is in a decision zone right below the neckline, and the next breakout will likely determine the short-term direction.
➖➖➖➖➖
Follow Crypto Sat 🟨  Long
Long
$TRUMP is forming a double-bottom structure on the 1H chart$TRUMP is forming a double-bottom structure on the 1H chart, reacting from the 2.93–2.96 support zone. After a downtrend, the market printed Bottom 1 and now Bottom 2 at the same level, indicating buyers are defending this region.
Price is hovering near 2.96, showing early signs of stabilization after the second bottom. This area is acting as a short-term demand zone, where sellers previously pushed the price lower but buyers stepped in quickly.
If this double-bottom support holds, we could see a short-term reaction bounce toward 3.02–3.05, which is the first minor resistance. A stronger push may extend toward 3.08–3.12, where previous rejection occurred.
However, confirmation is still needed. If 2.93 support breaks, the structure fails and price could continue the downside toward 2.88–2.85, where the next liquidity pocket likely sits.
Key levels to watch:
Support: 2.93–2.96
Bounce targets: 3.02 → 3.08 → 3.12
For now, this zone is a reaction area, and the next few candles will decide whether this double-bottom leads to a bounce or further downside continuation.
➖➖➖➖➖
Follow Crypto Sat 🟨  Long
Long
Bitcoin Bybit chart analysis MARCH 6Hello
It's a Bitcoin Guide.
If you "follow"
You can receive real-time movement paths and comment notifications on major sections.
If my analysis was helpful,
Please click the booster button at the bottom.
This is Bitcoin's 30-minute chart.
The Nasdaq indicators will be released shortly at 10:30 AM.
The MACD is forming a dead cross on the 6-hour chart.
*When the red finger moves,
Long position strategy:
Before and after the first touch of the purple finger at the top
1. After confirming the first touch of the purple finger (autonomous shorting)
Switch to a long position at $70,355.6 (red finger) / Set a stop loss if the purple support line is broken
2. $72,577 long position initial target -> Target prices are Good, Great, and so on.
If the price fails to touch the first section at the top and immediately falls,
Wait for a final long position at section 2 / Set a stop loss if the green support line is broken
In short-term patterns, maintaining the purple support line is recommended
for long positions.
After breaking the green support line,
it could fall to the bottom -> 3 range over the weekend.
Gold is currently losing some strength,
so a significant move could occur over the weekend.
Please use my analysis as a reference only.
I hope you operate safely, with a focus on principled trading and stop-loss orders.
Thank you. Long 
Global Market StrategiesUnderstanding Global Markets
Global markets consist of financial markets, goods markets, and services markets that operate across different countries. These include stock markets, currency markets, commodity markets, and international trade networks. Globalization has made it easier for companies to sell products worldwide and for investors to invest in foreign assets. For example, an investor in India can invest in American technology companies, European bonds, or Asian emerging markets.
However, global markets are complex. Each country has different regulations, economic conditions, cultural preferences, and political environments. A global market strategy helps organizations understand these differences and operate successfully across borders.
Importance of Global Market Strategies
Global market strategies are important because they help companies and investors expand their opportunities. When a company operates only in its domestic market, its growth may be limited. Entering global markets allows businesses to reach millions of new customers.
Another important benefit is diversification. Investors and companies can spread their investments across multiple countries. If one market experiences economic slowdown, other markets may still perform well, reducing overall risk.
Global strategies also help companies access resources such as cheaper labor, raw materials, advanced technology, and new innovations. For example, many technology companies establish research centers in different countries to benefit from local expertise.
Types of Global Market Strategies
There are several common strategies used in global markets. Each strategy depends on the company's goals, industry, and market conditions.
1. International Strategy
In an international strategy, companies sell their products in foreign markets with minimal changes. The company mainly focuses on its domestic market and simply exports products to other countries. This strategy is often used by companies that have strong products that are already successful in their home market.
For example, a clothing brand may manufacture its products in its home country and export them to international markets without significant modifications.
2. Multi-Domestic Strategy
A multi-domestic strategy focuses on adapting products and marketing strategies to local markets. Companies using this strategy treat each country as a separate market and customize their offerings to match local tastes, culture, and preferences.
For example, food companies often change their menu items in different countries to match local tastes. This approach increases customer acceptance but can also increase costs due to customization.
3. Global Strategy
A global strategy focuses on standardization. Companies produce standardized products and sell them worldwide with minimal changes. This allows companies to benefit from economies of scale, reducing production and operational costs.
Technology companies often follow this strategy. For example, smartphones and electronic products are usually similar across different markets, with only minor adjustments.
4. Transnational Strategy
A transnational strategy combines global efficiency with local responsiveness. Companies attempt to achieve cost efficiency while also adapting products to local markets when necessary.
This strategy is complex but very effective. It allows companies to benefit from global integration while still meeting local customer needs.
Market Entry Strategies
Before operating in global markets, companies must decide how to enter foreign markets. Several entry methods are commonly used.
Exporting
Exporting is the simplest way to enter global markets. Companies produce goods in their home country and sell them internationally. This method requires relatively low investment but may face challenges such as tariffs, transportation costs, and regulatory barriers.
Licensing and Franchising
Licensing allows foreign companies to produce or sell products using a company's brand or technology. Franchising is similar but usually involves a complete business model, such as restaurant chains or retail stores.
These methods allow companies to expand internationally with lower financial risk.
Joint Ventures
In a joint venture, two companies from different countries create a partnership to operate in a market. This strategy allows companies to share risks, resources, and local knowledge.
Joint ventures are common in industries where local regulations require partnerships with domestic firms.
Foreign Direct Investment (FDI)
Foreign direct investment involves establishing business operations in another country, such as building factories, offices, or subsidiaries. This strategy requires large investment but offers greater control over operations and market presence.
Global Investment Strategies
Investors also use global strategies to grow wealth and manage risk. These strategies include investing in international stocks, bonds, commodities, and currencies.
Geographic Diversification
Investors allocate their investments across different countries and regions. For example, a portfolio may include assets from North America, Europe, Asia, and emerging markets.
Geographic diversification helps reduce risk because economic conditions vary across regions.
Currency Strategy
Exchange rate movements can significantly impact global investments. Investors must consider currency fluctuations when investing internationally. Some investors hedge currency risk using derivatives such as futures and options.
Sector-Based Global Strategy
Investors may focus on specific industries that are strong in certain regions. For example, technology companies dominate in the United States, automobile companies are strong in Germany and Japan, and manufacturing is prominent in China.
Emerging Market Strategy
Emerging markets offer high growth potential but also higher risk. Investors often allocate a portion of their portfolio to emerging economies to benefit from rapid economic growth.
Challenges in Global Markets
Operating in global markets involves several challenges. Political risks, regulatory differences, and economic instability can affect business operations and investments.
Currency fluctuations can significantly impact profits and investment returns. For example, if a company earns revenue in a foreign currency and that currency weakens, the company's profits may decrease.
Cultural differences also play an important role. Marketing strategies that work in one country may not be effective in another due to differences in consumer behavior and preferences.
Logistics and supply chain management are also complex in global markets. Companies must manage international transportation, customs regulations, and global distribution networks.
Role of Technology in Global Strategies
Technology plays a critical role in global market strategies. Digital platforms allow companies to reach customers worldwide through e-commerce and online marketing. Financial technology also enables investors to trade international assets easily.
Data analytics helps companies understand global consumer behavior and market trends. Artificial intelligence and machine learning allow businesses to analyze large amounts of data and make better strategic decisions.
Conclusion
Global market strategies are essential for companies and investors seeking growth and diversification in an interconnected world. These strategies help organizations enter international markets, compete effectively, and manage risks associated with global operations.
Successful global strategies require a deep understanding of international economics, cultural differences, regulatory environments, and financial markets. Companies must choose the right combination of market entry methods, competitive strategies, and operational models to succeed globally.
As globalization continues to expand and technology advances, global market strategies will become even more important. Businesses and investors who understand global markets and adapt to changing conditions will be better positioned to capture opportunities and achieve long-term success in the international marketplace. 📈🌍 Education 
Ethereum Holding Trendline Support – Potential Buy Setup Formingethereum is currently holding above a key ascending trendline and liquidity support zone around $1,960–$1,970, where buyers are showing signs of defending the structure. After the recent rejection from the $2,150 BOS level, the market corrected and is now consolidating near this demand area, suggesting a possible accumulation phase before the next upward move.
The confluence of the trendline support and the marked demand zone ($$$) increases the probability of a bullish reaction. If Ethereum maintains support above this area, the price could start building momentum toward $2,020–$2,060, with a potential continuation toward the $2,100–$2,150 resistance zone where previous supply exists.
From a broader perspective, improving sentiment in the crypto market and continued interest in risk assets could support buying pressure from this structure, especially if Bitcoin remains stable or moves higher.
Buy Scenario:
If the trendline and support zone continue to hold, buyers may target the $2,020–$2,060 region initially, followed by a possible retest of $2,100+ levels.  Long
Long
Bitcoin Bullish Channel Breakout Targeting 70.5KBitcoin Bullish 1. Market Structure
Price previously experienced a strong bearish trend, falling from around 71,000 → 67,000.
After the drop, the market formed a base around 66,800–67,000, indicating strong support.
Price is now moving inside an ascending channel, forming higher lows, which is a bullish recovery pattern.
📈 2. Bullish Setup
Entry Zone: Around 67,100 – 67,200
Stop Loss: 66,792
Target Area: 70,400 – 70,530
This setup suggests a trend continuation trade, where price could climb toward the upper channel resistance.
🎯 Key Levels
Support: 66,800
Channel Support: 66,900 – 67,000
Resistance: 68,500 → 69,500
Main Target: 70,528
⚠️ Risk Scenario
If price breaks below 66,790, the bullish structure fails and BTC may fall toward 66,000 – 65,500.
📌 Summary
Bias: Bullish
Structure: Ascending channel
Trade idea: Buy the pullback
Target: ~70.5K Long 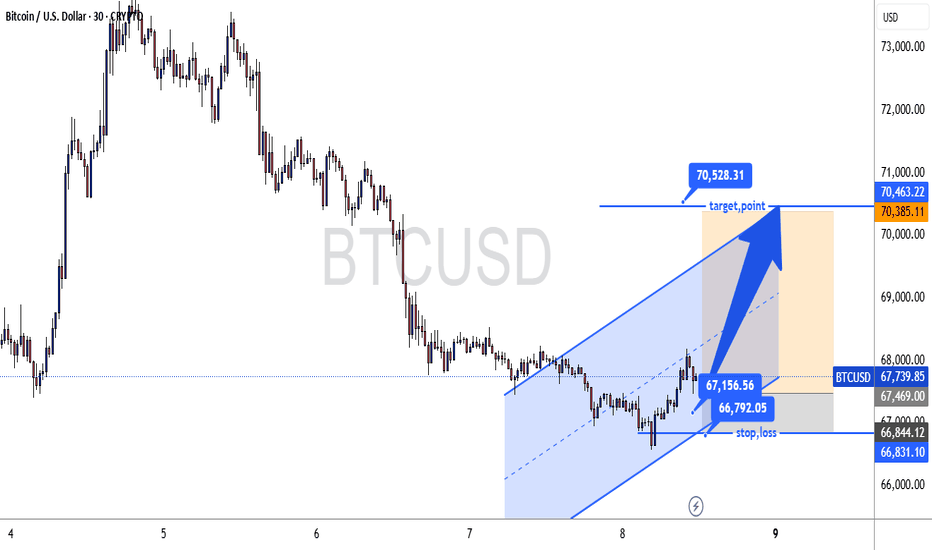
 Long
Long
$SHIB is forming a double-bottom on the 4-hour chartCRYPTOCAP:SHIB is forming a double-bottom on the 4H chart, bouncing off the 0.00000524–0.00000530 support zone. This region previously acted as a strong reaction area, and buyers are again attempting to defend it after the recent downtrend.
The price has formed Bottom 1 and Bottom 2 near the same support level, indicating possible accumulation or a depletion of selling pressure. After the second bottom formed, #SHIB is starting to show a small reaction bounce.
If this double-bottom holds, the price might try to hit around 0.00000555–0.00000565, where there was some short-term supply before. A stronger push could extend toward 0.00000580–0.00000590, the upper reaction zone marked in the chart.
However, this structure still needs confirmation. If price fails to hold the 0.00000520 region, the support breaks and SHIB could extend lower toward 0.00000500 or new lows, as sellers would regain full control.
Key levels to watch
Support: 0.00000524–0.00000530
Bounce targets: 0.00000555 → 0.00000580
For now, this area is a reaction zone, and traders will watch whether buyers can build momentum from the double-bottom base.
➖➖➖➖➖
Follow Crypto Sat 🟨  Long
Long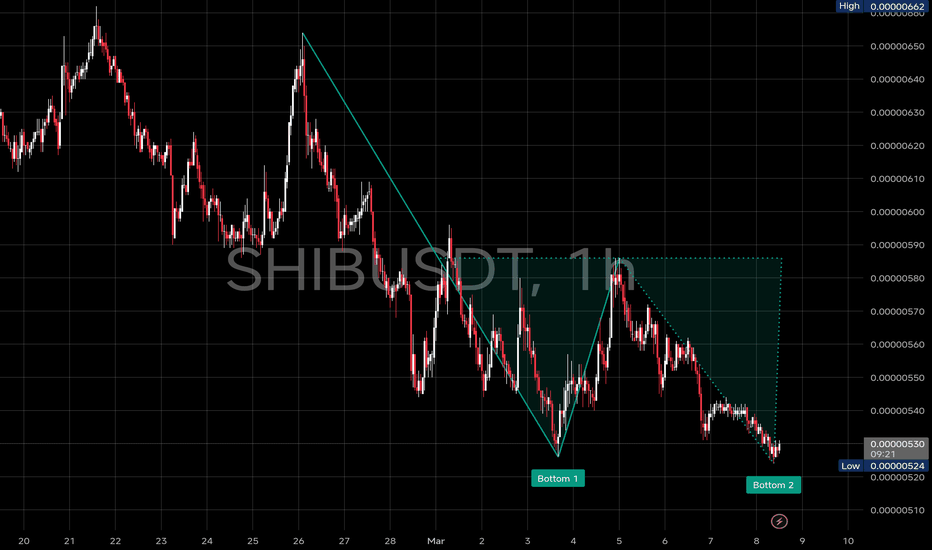
MARAL SMFT-X+Flow Governance: Reading RealMoves or TrapConditionMarkets do not fail traders only because direction is wrong.
Very often, direction is broadly correct, but the quality of the move is poor, the timing is premature, or the price action is being driven by deceptive liquidity behavior rather than true continuation.
That is the purpose of the Participation & Flow Governance panel and the SMFT-X panel inside the MARAL Execution Workflow.
These panels were not designed to predict tops, bottoms, or guaranteed outcomes. Their purpose is more practical and more structural:
to evaluate whether a move is behaving like real directional participation, or whether it is more likely to be churn, trap behavior, short-covering, long liquidation, or a squeeze-prone transition.
In other words, they help answer one of the most important questions in execution:
Is this move tradable, or is it only moving?
Why price movement alone is not enough
A candle can look strong and still be weak.
A breakout can print and still fail.
A trend can remain intact on higher timeframes while lower timeframe execution becomes unstable, noisy, and dangerous.
This is where many traders get trapped. They interpret movement as confirmation. But in many cases, the market is not expanding with clean directional intent. It is only passing through a phase of:
compression,
liquidity recycling,
mid-range churn,
stop-hunting,
reactive repricing,
or temporary inventory adjustment.
That distinction matters.
A strong-looking move is not automatically a high-quality move.
A correct bias is not automatically a clean entry.
A valid setup is not automatically a valid execution.
The MARAL framework treats these as separate layers.
The role of the Participation & Flow Governance panel
The Participation & Flow Governance panel is designed to measure the behavioral quality of the move before execution quality is judged.
Its function is to read whether there is actual directional participation in the market or whether the tape is still unstable.
It does this through several components:
1. Control State
This estimates whether the market is currently showing:
buyer dominance,
seller dominance,
weak directional control,
or neutral balance.
This matters because many failed trades begin in environments where structure appears directional, but control state is still mixed or weak.
2. Phase
The panel identifies whether price is in:
Expansion
Compression
Transition
This is critical.
A compression environment is one of the most common sources of false starts, because price can move in both directions without real takeover.
3. Sustainability
Not every push can sustain.
The sustainability reading helps distinguish between:
a move that can continue,
a move that is losing internal support,
or a move that has not yet proven itself.
4. Aggression
The panel separates buyer aggression and seller aggression instead of simplifying the market into a basic bullish/bearish label.
This is useful because traps often occur when one side appears visually active on price, but aggression readings do not support the apparent move.
5. Displacement Quality
This is a key concept.
A move that is real usually leaves evidence:
stronger candles,
clearer expansion,
less hesitation,
and better follow-through.
A move with no real displacement often lacks commitment.
6. Liquidity Conversion
This is one of the most important sections of the panel.
It helps answer whether a sweep has been converted into actual directional continuation, or whether the market only touched liquidity and then failed to continue.
That is the difference between:
liquidity event
and
liquidity conversion
This distinction is essential.
Many traders recognize a sweep.
Far fewer can judge whether that sweep has actually converted into control.
The role of SMFT-X
If the Participation & Flow Governance panel measures internal flow quality, the SMFT-X panel acts as the execution validity filter.
SMFT-X stands for:
Smart Money Flow + Trap + Squeeze
The name is intentional.
The goal is not to claim that an indicator can “see smart money” directly.
The goal is to validate whether the move is behaving like:
real aggressive participation,
or deceptive liquidity behavior.
SMFT-X is therefore a classification layer, not a prediction engine.
It asks:
Is the flow strong enough?
Is the move actually expanding?
Did the move begin from a meaningful liquidity event or only from mid-range churn?
Is the reclaim or rejection actually confirmed?
Is follow-through present?
Is trap risk elevated?
Is squeeze risk elevated?
These questions matter because a trader can be directionally correct and still be stopped out if the move is not yet structurally valid.
How SMFT-X distinguishes real move vs trap
The strongest contribution of SMFT-X is that it separates movement from valid movement.
That means it can help distinguish between:
Real expansion
A real move typically shows:
meaningful flow strength,
usable displacement,
directional aggression,
a credible liquidity origin,
reclaim/reject confirmation,
and follow-through.
When these align, the move begins to behave like genuine continuation or genuine reversal acceptance.
Trap behavior
A trap often shows:
movement without displacement,
weak or mixed aggression,
unclear reclaim/reject behavior,
weak follow-through,
or a mid-range origin without true conversion.
This is the kind of environment where price can look active while still lacking real commitment.
Squeeze-prone movement
A squeeze-prone move often appears when:
phase remains compression or transition,
aggression is mixed,
trap risk is not low,
and the market is vulnerable to taking obvious stops before confirming direction.
This is especially relevant in leveraged and fast-moving markets.
Why this matters during a live trade
These panels are not useful only before entry.
They also support decision-making during the trade.
That is important.
A panel that helps only at entry but becomes irrelevant during live exposure is incomplete.
The purpose here is broader: to improve trade governance while the position is active.
During trade, these panels help answer:
Is the move still behaving like a real continuation?
Is flow still supportive?
Is follow-through deteriorating?
Is the move degrading into weak churn?
Is the trade entering a trap-prone environment?
Should the position be held, reduced, protected, or treated more cautiously?
This makes the panels useful for:
managing conviction,
reducing overconfidence,
avoiding emotional re-entry,
and identifying when market behavior no longer matches the original execution logic.
How they work together inside MARAL
The best way to understand these panels is not as standalone indicators, but as part of a layered execution workflow.
Context layer
The broader MARAL context helps define direction, structure, and high-level environment.
Flow layer
The Participation & Flow Governance panel evaluates whether the market is actually showing usable control.
Validity layer
SMFT-X decides whether that movement is:
real,
degraded,
trap-prone,
squeeze-prone,
or context-only.
Execution layer
Only after those conditions are aligned does the workflow become suitable for higher-confidence execution logic.
This layered structure is important because it prevents one good-looking candle from being treated as sufficient confirmation.
A technical advantage of this approach
Many tools attempt to simplify the market into “buy” or “sell.”
The problem is that this often collapses too many layers into one output.
The SMFT-X and Flow Governance design takes a different approach.
Instead of asking only:
“What direction?”
it asks:
“What is the quality of the current flow, what is the validity of the move, and what is the execution risk right now?”
That is a more useful execution question.
It does not eliminate uncertainty.
No tool can do that.
But it can reduce the number of trades taken in conditions where direction appears clear but participation quality is not yet proven.
Why “real move or trap” is such an important distinction
A large amount of trading damage does not come from being completely wrong.
It comes from engaging during the wrong phase of the move.
Examples include:
entering during compression before real expansion,
shorting before a squeeze completes,
longing before reclaim is actually confirmed,
treating a liquidity touch as a converted move,
or mistaking weak reaction for true continuation.
That is why “real move or trap” is not a cosmetic distinction.
It is one of the most important differences in execution quality.
A workflow that can separate those two states is often more valuable than a workflow that simply identifies direction.
How to interpret these panels practically
When both panels show:
stronger control,
confirmed conversion,
usable displacement,
low trap pressure,
and manageable squeeze risk,
the environment is more coherent.
When they show:
compression,
weak sustainability,
mixed aggression,
failed conversion,
unclear reclaim,
and medium-to-high trap or squeeze risk,
the move should be treated more defensively.
That does not mean the market cannot continue.
It means the evidence for immediate execution is weaker.
That distinction is central to disciplined trading.
Final perspective
The Participation & Flow Governance panel and SMFT-X panel are designed to help MARAL move beyond simple directional interpretation.
Their purpose is not to promise accuracy, predict every reversal, or replace trader judgment.
Their role is to provide a more technical way to judge whether price is:
truly being accepted,
genuinely being driven,
or merely rotating through deceptive liquidity conditions.
That makes them useful not only for entry selection, but for trade quality assessment, trap filtering, and execution discipline.
In short:
Flow Governance measures whether the market is behaving with real internal directional support.
SMFT-X measures whether that behavior is clean enough to be treated as a real move rather than trap or squeeze structure.
That is the practical value of the framework.
both attached charts are very good examples of why the SMFT-X panel is useful.
At first look, both charts can tempt a trader to think:
buyers are active,
candles are moving,
maybe a long is forming.
But your system is correctly saying:
not enough quality yet.
Common message in both examples
In both charts, SMFT-X is reading:
Flow Strength = Moderate
Displacement = None
Aggression = Buyer Dom
Liq Origin = Mid-Range
Reclaim/Reject = Unclear
Follow-Through = Weak
Trap Risk = Medium
Squeeze Risk = Medium
Final State = COMP CHURN
Permission = CONTEXT ONLY
That is extremely important.
It means:
buyers are trying to lift price, but the move is not starting from a clean structural origin, it is not displacing with force, and it is not confirming with follow-through.
So this is activity, but not yet validated expansion.
1) BTC example — what it means
In the BTC chart, the Execution Console shows:
Global State = WAIT
Setup = WAIT
Entry Permission = WAIT
Liquidity Reason = Low Liquidity
Exit Permission = No Trade
The PFG panel shows:
Control State = Buyer Weak (59)
Phase = Compression
Sustainability = Low
Buyer Aggression = 32.3
Seller Aggression = 20.3
Displacement Quality = None
Liquidity Conversion = Failed (SSL)
Shift Watch = Buyers Gaining
Confidence/Gate = No Permit | Context only
What this means technically
BTC is showing a reactive bid, not a confirmed directional takeover.
Why?
Because:
buyers are stronger than sellers,
but the strength is still weak-quality strength,
there is no usable displacement,
the move is still in compression,
and the liquidity conversion has failed.
So the panel is correctly separating:
buyer interest
from
tradable bullish continuation
That is a major difference.
Real interpretation
This is not a clean long.
This is more like:
buyers trying to stabilize price inside a compressed environment, but without proving control.
That is why SMFT-X says:
COMP CHURN
and
CONTEXT ONLY
Meaning:
watch it,
respect the context,
but do not treat it as a real expansion yet.
2) SENT example — what it means
In the SENT chart, the Execution Console is even stricter:
Global State = ENTRY_BLOCKED
Setup = WAIT
Entry Permission = SKIP | L: BLOCKED | S: BLOCKED
Liquidity Reason = Low Liquidity
Exit Permission = No Trade
The PFG panel shows:
Control State = Neutral (54)
Phase = Compression
Sustainability = Low
Buyer Aggression = 25.5
Seller Aggression = 16.6
Displacement Quality = None
Liquidity Conversion = Failed (SSL)
Shift Watch = Buyers Gaining
Confidence/Gate = No Permit | Context only
And the SMFT-X panel is almost the same as BTC:
moderate flow,
no displacement,
buyer dominance,
mid-range origin,
weak follow-through,
medium trap/squeeze,
comp churn,
context only.
What this means technically
This one is even weaker than BTC.
Why?
Because in BTC the control state is at least Buyer Weak (59).
Here it is only Neutral (54).
So in SENT, buyers are visible, but not strong enough to change the market character.
This is a classic case of:
apparent lift without structural proof.
The move is trying to bounce, but it is still:
low quality,
compression-based,
low sustainability,
and not converting liquidity into directional control.
That is why the Execution Console moves from simple WAIT in BTC to ENTRY_BLOCKED in SENT.
3) Why both charts examples
Both charts show something very important:
Buyer dominance alone is not enough
A trader can see:
green candles,
local bounce,
buyers gaining,
small upward reaction,
and still get trapped.
Your panels are correctly saying:
Do not confuse reactive buying with real bullish expansion.
That is the exact strength of SMFT-X and Flow Governance.
Because both examples have:
Buyer Dom / Buyers Gaining
but also
No displacement
Weak follow-through
Failed liquidity conversion
Compression
Mid-range origin
So the move is not yet “real” in execution terms.
4) Main difference between the two charts
BTC
slightly stronger internal reading
Buyer Weak (59)
still watchlist quality
not tradable yet
SENT
weaker internal reading
Neutral (54)
more unstable
system blocks it harder
So BTC is like:
“Not ready yet.”
SENT is like:
“Even worse quality — do not touch.”
That difference is very valuable.
5) What “Failed (SSL)” means here
In both charts, Liquidity Conversion = Failed (SSL) is a major warning.
That means:
sell-side liquidity interaction happened,
but price did not convert that event into strong bullish continuation.
So the market touched a potentially useful liquidity area, but the flow quality after that was poor.
This is exactly where many traders enter too early.
They see:
liquidity taken,
buyers active,
small bounce,
and assume:
reversal started.
But your system correctly says:
No — the conversion failed.
That is a big institutional-style filter.
6) Final conclusion for both examples
Both screenshots are showing:
Not a real bullish move
Even though buyers are visible.
Why not real?
Because the market is still missing:
strong displacement,
strong follow-through,
confirmed reclaim,
clean liquidity origin,
strong sustainability,
low trap/squeeze profile.
So the system correctly keeps the state at:
COMP CHURN
and
CONTEXT ONLY
That is the right answer.
Best one-line explanation for these two charts
Both BTC and SENT show reactive buyer presence inside compression, but neither chart shows enough displacement, conversion, or follow-through to qualify as a real expansion.
Very important lesson from these examples
These two charts prove that SMFT-X is not just reading direction.
It is reading move validity.
That is why this panel is powerful.
Because it can say:
buyers are present,
but also
the move is still poor quality,
still compression-based,
still trap-prone,
still not ready for permission.
That is exactly what a serious execution framework should do.
Note : This workflow is intended for market structure analysis, participation assessment, and execution-quality filtering. It is educational and analytical in nature. It does not guarantee outcomes, does not make performance claims, and should not be treated as automated financial advice or a promise of results.
Education 
Long 
$SOL is trading within a rising wedge pattern on the 4hr chartCRYPTOCAP:SOL is presently trading within a rising wedge pattern on the 4-hour chart, with the current price around $82–$83 following a pullback from the recent $94 resistance level. The structure has been respected multiple times, and price is now approaching the lower wedge support, which is the key area to watch.
Current situation:
The $80–$81 region is acting as the lower boundary of this wedge. If buyers defend this support again, it could trigger another short-term bounce toward the upper wedge, similar to previous rotations inside the structure.
As long as #SOLANA holds this lower trendline, a reaction toward $86 → $90 is possible, with the $92–$94 zone remaining the major resistance near the upper wedge.
This type of structure often creates range trades inside the wedge, where price moves between the lower and upper boundaries before a decisive breakout happens.
However, if $80 breaks and price closes below the wedge, the structure weakens and we could see a deeper move toward $76–$74, which was the previous reaction zone.
A reaction from the lower wedge support could provide a long opportunity for a quick bounce, targeting the mid-range and upper wedge levels.
Key levels to watch
Support: $80–$81
Bounce targets: $86 → $90 → $92
Momentum will likely expand once the wedge eventually breaks.
➖➖➖➖➖
Follow Crypto Sat 🟨  Long
Long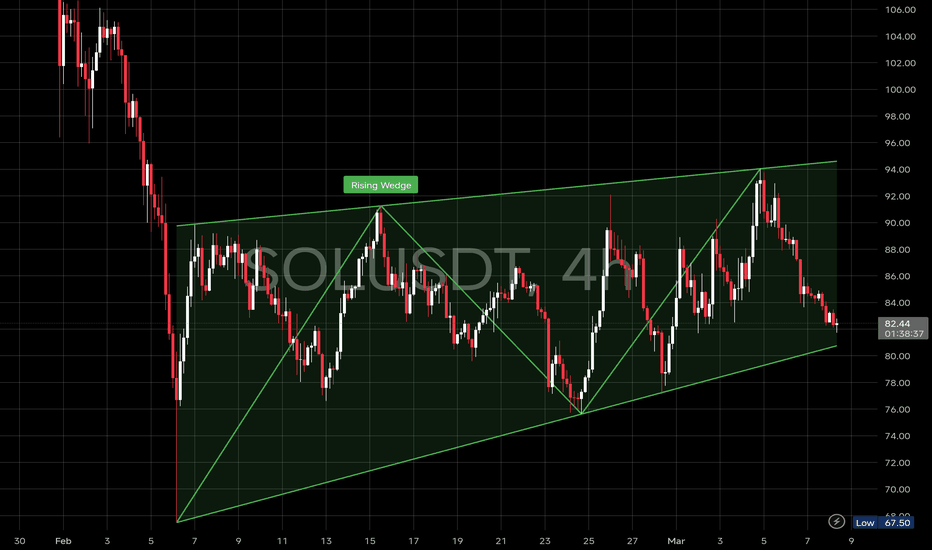
Long 
Long