XAUUSD — Sell the Fibonacci Liquidity RetestMarket Pulse
Gold remains under macro pressure after U.S. August PPI rose 0.4% MoM and 5.4% YoY, keeping inflation concerns high. Markets are now pricing roughly a 70% chance of a Fed rate hike next week, while the U.S. 10-year yield is trading close to 5%.
Attention now turns to U.S. CPI later today. Oil has eased from its recent highs, giving Gold some support, but a hotter CPI could quickly bring the dollar and yields back into focus.
What the Chart Says
XAUUSD remains bearish on H1.
Price is still moving below the previous bearish structure after falling from the 4,425–4,436 OB + rejection zone.
The rebound from the 4,300–4,305 support area has now started to lose momentum. Price reached around 4,355 before sellers returned, which keeps the recovery looking corrective rather than a real trend change.
The key area above is 4,360–4,370, where liquidity meets the 0.50 Fibonacci retracement near 4,369.
A slightly deeper recovery could reach the 0.618 Fibonacci near 4,385, but this would still remain inside the bearish retracement structure.
If sellers continue to defend this area, price could rotate back toward 4,320 and later retest the major support around 4,295–4,305.
Levels That Matter
4,425–4,436 — OB + major rejection
4,405–4,410 — Liquidity
4,360–4,370 — Liquidity + 0.50 Fibonacci
4,384–4,390 — 0.618 Fibonacci resistance
4,295–4,305 — Main support
My Main Plan
The main plan remains bearish.
I prefer waiting for a rebound toward 4,360–4,370. If price rejects this area and sellers return with confirmation, Gold could move back toward 4,320 first.
A clean continuation lower may then bring 4,295–4,305 back into focus.
What I Need to See
I want the recovery to stay below the Fibonacci resistance and form another lower high.
A sustained H1 move above 4,390 would weaken the immediate bearish setup. A stronger recovery above 4,410 would suggest that buyers are gaining more control.
Final Read
The H1 trend still favors sellers. The current bounce looks more like a retracement than a confirmed reversal.
For now, I prefer selling the rebound rather than chasing price near support, especially with U.S. CPI likely to bring higher volatility later today.  Short
Short
XAUUSD — Sell the H1 Fibonacci RetestFundamental Analysis
Gold remains under macro pressure after U.S. August PPI rose 0.4% MoM and 5.4% YoY, reinforcing concerns that energy-driven inflation is becoming more persistent. Markets are now pricing roughly a 70% probability of a 25 bp Fed hike next week.
Attention now turns to U.S. CPI later today. Brent has eased toward $105 after briefly approaching $110, while the U.S. 10-year yield remains close to 5%. A hotter CPI could strengthen the dollar and yields further, while softer inflation may trigger a stronger gold rebound.
Technical Analysis
On H1, XAUUSD is trading near 4,345 after recovering from the 4,300.80 low. However, the broader structure remains bearish beneath the descending resistance trendline.
The key decision area is 4,348–4,376, where Fibonacci 0.618–1.0, previous structure, and the marked sell zone overlap. A corrective recovery into this region followed by rejection would favor another bearish leg.
If sellers regain control, downside targets sit near 4,330, 4,318, and ultimately the 4,300–4,305 liquidity low.
A stronger recovery could first test the upper 4,395–4,405 FVG, but acceptance above this area would weaken the immediate bearish thesis.
Important Key Levels
4,395–4,405 — Upper FVG
4,360–4,376 — Main sell zone
4,347–4,350 — Fib 0.618 / pivot
4,329–4,330 — First support
4,318–4,320 — Secondary support
4,300–4,305 — Main downside target
Trading Scenario
Main Sell Setup
Entry: 4,360–4,376
Stop Loss: 4,392
Take Profit 1: 4,330
Take Profit 2: 4,318
Take Profit 3: 4,300–4,305
Sell Condition
Wait for bearish confirmation inside the sell zone. A rejection wick, bearish engulfing candle, failed reclaim above 4,376, or H1 close back below 4,348 could confirm renewed seller pressure. A sustained break above 4,395–4,405 would invalidate the immediate sell setup.
Overall View
The H1 bias remains bearish while XAUUSD stays below 4,376 and the descending trendline. The preferred plan is to avoid chasing shorts around current price and wait for a corrective rebound into 4,360–4,376. If sellers defend this area, gold could rotate back toward 4,330 → 4,318 → 4,300.
Will CPI trigger the retest into 4,360–4,376 before sellers attack 4,300 again? Short 
Gold 1H: Will 4,400 Reject Before 4,283 Gets Swept?
Market Overview
• Macro Driver: Spot Gold closed the week at $4,349.420 on Saturday, September 12, 2026, consolidating following intense volatility ignited by Friday's US August Consumer Price Index (CPI) report. While headline inflation showed signs of stubborn persistence, core metrics came in line with forecasts, triggering volatile two-way liquidity sweeps. Global institutional desks are now entering the blackout window ahead of next week's highly anticipated September FOMC interest rate decision.
• Market Condition: Institutional order flow continues to operate within a well-defined descending channel distribution structure. Despite Friday's impulsive short-covering spike that engineered a local CHoCH, price remains constrained beneath dominant descending channel resistance and premium order block supply.
Technical Context
• Structure: Bearish Descending Channel / Corrective Relief Wave. On the 1H timeframe, Gold is carving out lower swing highs beneath the 4,511.089 Strong High. Following a liquidity sweep into 4,300, price printed an aggressive bullish displacement candle back to 4,400, testing the upper channel boundary before easing into the weekend close at 4,349.42.
• Liquidity & Imbalance: Price delivery points toward an intraday push to retest the Upper Supply Block / Channel Resistance (4,390 – 4,405). A confirmed bearish rejection here is projected to complete an internal distribution cycle, driving price downward through the channel median toward the lower Demand Block and sweeping the 4,283.19 Weak Low.
Key Zones
• Macro Ceiling (Strong High): 4,511.089
• Upper Supply / Channel Resistance (Blue Box): 4,390.00 – 4,405.00
• Immediate Market Close Price: 4,349.42
• Channel Median Pivot: 4,330.00 – 4,340.00
• Primary Liquidity Target / Lower Demand (Blue Box): 4,280.00 – 4,300.00
• Macro Floor (Weak Low Target): 4,283.19
Trading Plan (IF–THEN)
• IF price pushes into the 4,390.00 – 4,405.00 supply block / descending channel ceiling AND confirms lower-timeframe (M5/M15) bearish displacement/CHoCH -> THEN look to execute Short swing positions, targeting 4,330 and expanding downward to sweep the 4,283.19 Weak Low inside the 4,280 – 4,300 demand pool.
• IF price invalidates the channel structure with a decisive 1H close above 4,415 -> THEN the bearish continuation thesis is postponed, exposing an extended recovery toward 4,440.
MMFLOW View
• Bias: Bearish Channel Rejection. Do not chase green candles into descending channel resistance ahead of FOMC week; the mathematical edge favors shorting confirmed rejection displacement at premium supply to target deep discount liquidity pools.
Are you selling the 4,400 channel retest into next week, or waiting for a breakout above the channel? Short 
THE NEXT BATTLE: FOMC — THE INTEREST RATE DECISIONNearly 90% of the market is currently pricing in a 25bps rate hike in September.
But this time, I’m more interested in one question:
What is the Fed actually worried about? And how will the market react after the decision?
🎯 Three key factors to watch:
OIL | US10Y | DXY
⚠️ If OIL ↑ + US10Y ↑ + DXY ↑ → inflation pressure and tighter financial conditions could return.
On the other hand, if all three cool down → the environment could become more supportive for Gold & Crypto.
👀 And here is my personal hypothesis:
Will the Fed actually hike rates in September?
Personally, I’m leaning toward the possibility that they may hold rates steady in September, based on a few observations:
1️⃣ We are getting closer to the midterm election period, and there isn’t much time left.
2️⃣ Is the Fed truly completely independent in its policy decisions?
Especially after Trump repeatedly called for lower interest rates.
If the Fed holds rates in September, while the market is pricing in nearly a 90% probability of a hike, that could be a major policy surprise — and potentially trigger a significant psychological shock across markets.
But if the Fed does start hiking, I don’t think the story necessarily ends with just one hike.
Historically, meaningful policy impact often requires the Fed to maintain a consistent sequence of actions, rather than hike once and stop.
👉 So my personal view is:
September may not be the month when the Fed starts hiking.
But if they do start, it could be the beginning of a new hiking cycle.
🔥 That’s why the upcoming FOMC is not simply about “hike or hold.”
The bigger question is:
What is the Fed seeing — and what are they preparing for next? Why “Buy Low, Sell High” Fails So Many Traders“Buy low, sell high” sounds like the simplest rule in trading.
Buy when the price is low. Sell when the price is high.
But in real markets, this idea often causes traders to buy too early in a downtrend and sell too early in an uptrend.
1. “Low” and “High” Are Always Relative
A price that looks very low today can still fall much further if the bearish structure remains intact.
On the other hand, a price that looks extremely high can continue rising if the trend remains strong.
A low price is not automatically a Buy opportunity. A high price is not automatically a Sell signal.
The more important question is:
Where is price within the current market structure?
2. Traders Often Buy When the Market Is at Its Weakest
After a sharp decline, price suddenly looks “cheap.”
This is when many traders start trying to catch the bottom simply because they think:
“It has already fallen too much.”
But if the market is still forming Lower Highs + Lower Lows , support keeps breaking, and selling pressure has not weakened, you are not necessarily “buying low.”
You may simply be buying into a downtrend that is not over yet.
3. “Sell High” Can Make You Exit Too Early
The opposite mistake happens when traders see price rally strongly and immediately want to sell because the market looks “too high.”
But in a healthy uptrend, Higher Highs and Higher Lows can continue for much longer than expected.
Don’t sell just because price looks high. Sell when the structure starts giving you a reason to exit.
4. Location Matters More Than the Absolute Price
Instead of asking:
“Is the price low enough yet?”
Ask:
Is price at support or in the middle of a range?
Is the broader trend bullish or bearish?
Has price action provided confirmation?
If I’m wrong, where is my invalidation?
A “cheap” price without structural support can always become cheaper.
5. A Better Approach Than Buy Low – Sell High
A more practical way to think about the market is:
Buy strength after weakness has failed.
Sell weakness after strength has failed.
In simple terms:
Don’t try to predict the bottom.
Don’t try to call the top.
Wait for the market to prove that control has shifted from one side to the other. Education 
Long 
XAUUSD — Bullish Retest Toward 4,425XAUUSD — Bullish Retest Toward 4,425
Gold is showing a short-term bullish recovery after completing the previous downside wave near the lower support area. From Kelly’s view, the current chart suggests that XAUUSD may be forming a corrective bullish structure, with price now reacting from the 4,334–4,340 buy retest support zone.
The key idea is simple: if gold holds above this support, the next recovery leg may continue toward the 4,420–4,435 strong resistance area.
⟡ Market structure
Gold recently completed a bearish 5-wave sequence and is now trying to rebuild from the lower zone. Price is trading around 4,351, slightly above the buy retest support.
The current structure looks like a possible ABC recovery. Buyers are trying to defend the 4,334–4,340 area, while the next major upside target remains the strong resistance zone near 4,420–4,435.
However, gold is still trading below the descending trendline, so the bullish setup needs confirmation. A clean move above 4,380–4,400 would strengthen the recovery and open the way toward the upper resistance.
➤ Key levels
◌ Current price area: 4,351
◌ Buy retest support: 4,334–4,340
◌ Key support: 4,300–4,315
◌ First bullish confirmation: above 4,380
◌ Main resistance: 4,420–4,435
◌ Strong breakout confirmation: above 4,435
◌ Bullish invalidation: below 4,300
⌁ Elliott Wave view
The chart suggests that the previous bearish wave may have already completed near the 4,300 area.
After that, gold started to form a short-term bullish recovery:
Wave A may be the first rebound from the low.
Wave B may be the retest into 4,334–4,340.
If this support holds, wave C may push price toward 4,420–4,435.
This is why Kelly is watching the current retest zone carefully. The bullish idea is valid only if buyers continue to defend support and price starts to break above the short-term resistance levels.
▸ Trading scenario
Preferred bullish scenario
Entry: Buy around 4,334–4,340 if price gives bullish confirmation
Stop Loss: Below 4,300
Take Profit 1: 4,380
Take Profit 2: 4,400
Take Profit 3: 4,420–4,435
Alternative entry
If gold breaks above 4,380–4,400 and retests this area as support, buyers may look for continuation toward 4,420–4,435.
◌ Invalidation
The bullish view becomes weaker if gold breaks below 4,300 and fails to recover back above the buy retest support. In that case, the recovery structure may fail and sellers could regain control.
⌁ Kelly’s view
Kelly’s main view is cautiously bullish while gold holds above 4,334–4,340. The market is showing signs of recovery, but price still needs to confirm strength above 4,380–4,400.
If buyers defend the current support, gold may continue toward 4,420–4,435, where the next key decision zone is waiting.
Do you think gold will complete wave C toward resistance, or retest the lower support one more time first? H2 Bullish Recovery From Major Demand
XAUUSD is trading around 4,349 after another volatile session around the lower H2 structure. Price remains inside a broader descending channel, but the current location is close to a major demand cluster where a recovery setup may begin to develop.
The macro backdrop remains challenging for gold. U.S. August CPI rose 0.4% MoM and 3.4% YoY, while core CPI increased 0.3% MoM and 2.4% YoY. Markets now price roughly an 85% probability of a Fed rate hike next week, keeping pressure on non-yielding gold. However, the U.S. 10-year yield eased back toward 4.93% after nearly touching 5%, providing some short-term relief.
Technical View
The broader structure remains below the descending channel resistance, so the recovery is not confirmed yet.
Price is currently holding around the 4,335–4,360 Demand / Reclaim Zone. This area may support a short-term bounce, but the cleaner bullish location remains lower at the 4,275–4,300 Major Demand / Bullish OB.
A liquidity sweep into that major demand followed by a strong reclaim, bullish MSS or higher-low confirmation would support the recovery path shown on the chart.
The first upside obstacle is 4,385–4,405 Resistance / Bearish OB. Acceptance above this area would strengthen the recovery and expose the larger 4,475–4,490 Major Resistance / Supply zone.
Key Zones
Current Price: 4,349.420
Demand / Reclaim Zone: 4,335–4,360
Buy Priority: 4,275–4,300
Resistance / Bearish OB: 4,385–4,405
Major Resistance / Supply: 4,475–4,490
Trading Plan
Buy Priority: 4,275–4,300
Condition: wait for a liquidity sweep into Major Demand followed by bullish rejection, reclaim, MSS or clear higher-low confirmation.
TP1: 4,335–4,360
TP2: 4,385–4,405
TP3: 4,475–4,490
Invalidation: sustained acceptance below 4,275.
Buy/Sell View
The preferred setup is to wait for a deeper pullback into Major Demand rather than chase the current bounce.
Shorts also become less attractive near 4,300 because price would already be entering a major bullish OB. The cleaner decision is to let demand confirm whether buyers can absorb the remaining sell-side pressure.
Important Note
Inflation remains the main macro risk. With CPI and PPI both firm, Fed tightening expectations remain elevated, while oil above $100 continues to reinforce inflation concerns. Any renewed rise in Treasury yields could pressure gold again.
Final View
Gold remains structurally weak, but 4,275–4,300 is the key H2 area where the risk/reward begins to shift toward a recovery setup.
My main scenario is a liquidity sweep into Major Demand followed by bullish confirmation, targeting 4,385–4,405 first and potentially 4,475–4,490 if the recovery strengthens.
Will gold sweep Major Demand before starting the next H2 recovery? Long 
Education 
XAUUSD: Sellers Reject the Recovery — Is 4,280 the Next Target?After a short-term rebound, XAUUSD is showing renewed weakness as price struggles below the descending trendline and the Ichimoku resistance area. The recovery toward 4,430–4,440 has so far failed to change the broader bearish structure, keeping sellers in control.
In terms of news, gold is under pressure as rising oil prices revive inflation concerns, while strong U.S. employment data has increased expectations that the Federal Reserve could raise rates again. Markets are currently pricing roughly a 60% probability of a Fed rate hike, making upcoming U.S. inflation data especially important. Higher rate expectations remain a headwind for non-yielding gold, even though a softer U.S. dollar is providing some support.
Looking at the H3 chart, the technical structure also supports a bearish scenario:
Price has been repeatedly rejected from the descending trendline.
The 4,425–4,440 area overlaps with trendline resistance and the upper Ichimoku zone.
Price is now trading around 4,393, showing that the latest rebound has already lost momentum.
The 4,360–4,385 zone is the nearest support. A decisive break below this area could accelerate selling pressure toward the lower demand zone.
📉 Main Scenario
Resistance: 4,425–4,440
Support: 4,360–4,385
Target: 4,280–4,300
As long as XAUUSD remains below the descending trendline and fails to reclaim 4,440, I continue to favor the bearish scenario. A breakdown below 4,360 would strengthen the case for another move toward 4,280–4,300. Short 
 Short
Short
XAU/USD - Buyers Take Control Next WaveOANDA:XAUUSD is reacting again from the 4,280–4,360 support zone, an area that already produced a strong rebound earlier this month. However, price is still trading below the descending trendline and around the Ichimoku structure, so the bullish reversal is not confirmed yet.
If buyers defend this zone and price breaks decisively above the trendline, I favor a recovery toward:
🎯 Target: 4,510
Macro Market: Gold is facing a difficult backdrop after US PPI rose 0.4% in August and annual producer inflation reached 5.4%, lifting the probability of a Fed rate hike to around 70%. The US 10-year yield is also close to 5%, while the Dollar remains firm.
A sustained H2 break below 4,280 would weaken the recovery scenario.
AURICVERSE View: technically, Gold is sitting at an attractive support area, but macro remains a headwind. I want to see support hold + trendline breakout before treating 4,510 as the next upside objective. Long 
XAUUSD – Gold Breaks Range, 4,283 Is Critical XAUUSD – Gold Breaks Range, 4,283 Is Critical
Gold is trading under pressure near 4,327 after losing the previous consolidation range.
The chart is showing a clear shift in short-term structure. Price failed to hold above the liquidity area around 4,351 and continued to move lower inside the descending channel. This tells me sellers are still controlling the intraday direction, especially after gold broke below the earlier sideways range.
From the market side, traders are still waiting for the U.S. CPI report. The stronger USD reaction after PPI data is keeping pressure on gold, while rising oil prices and Middle East tension create mixed safe-haven flows. This is why the current move is sensitive: gold can react quickly, but the technical structure is still weak unless buyers reclaim resistance.
Technical view:
Gold is moving inside a descending channel.
Price broke below the previous range and is now trading near 4,327.
The nearest liquidity resistance is around 4,351.
As long as gold stays below 4,351, sellers still have short-term control.
The main support zone is around 4,283 – 4,273.
This area is important because it aligns with the channel support and the previous strong support level.
If 4,273 breaks with strong bearish momentum, gold may continue toward the Fibonacci target near 4,198.
If buyers defend 4,273 – 4,283, gold may create a short-term recovery back toward 4,351.
Key levels to watch:
Current price: 4,327
Nearest resistance: 4,351
Short-term liquidity area: 4,340 – 4,351
Strong support: 4,283 – 4,273
Downside Fibonacci target: 4,198
Recovery confirmation: above 4,351
Invalidation for sell pressure: above 4,375
Main scenario:
If gold retests 4,340 – 4,351 and shows bearish rejection, sellers may try to push price lower again.
Possible targets: 4,283 first, then 4,273.
If 4,273 breaks clearly, the next bearish extension can move toward 4,198.
Alternative scenario:
If gold sweeps 4,273 – 4,283 and forms a strong bullish rejection, buyers may attempt a recovery.
First recovery target: 4,351.
If gold breaks above 4,351 and holds, the short-term bearish pressure may weaken and price can move back toward 4,375.
Hannah’s view:
Gold is not showing a clean bullish reversal yet.
The break below the previous range and the weak reaction under 4,351 keep the short-term view bearish. For buyers, the best area to watch is not the middle of the move, but the lower support around 4,273 – 4,283.
Main view: sellers remain in control below 4,351. A clean rejection from this zone supports continuation toward 4,283 and 4,198. If buyers defend 4,273 strongly, gold may form a recovery attempt. No confirmation means no trade.
Do you think gold will defend 4,273, or will CPI pressure send price toward 4,198 next?
Short 
POC Rejection Keeps Downside Liquidity in Focus
Fundamental Analysis
Gold remains supported by a softer U.S. dollar and safe-haven demand. However, high oil prices and Treasury yields keep inflation concerns elevated, with U.S. PPI and CPI now the key catalysts.
Technical Analysis
On H1, Gold rejected the 4,435–4,445 liquidity area and remains below the descending trendline.
Price is now trading near 4,380, below the 4,395–4,405 POC, keeping short-term pressure bearish.
The first liquidity sits around 4,375, while the stronger downside target remains 4,340–4,345.
Important Key Levels
4,435–4,445 — Strong Liquidity
4,395–4,405 — POC / Resistance
4,375 — Liquidity
4,340–4,345 — Main Liquidity Support
Trading Scenario
Sell priority remains on a weak rebound into 4,395–4,405 followed by bearish H1 confirmation.
Target: 4,375 first, then 4,340–4,345.
Invalidation: H1 acceptance above 4,405 and the descending trendline.
Overall View
H1 remains bearish below the POC and trendline. The cleaner setup is to wait for a rebound rather than chase price lower, with 4,340–4,345 remaining the main liquidity objective.
Will Gold retest the POC first, or sweep 4,340 directly? Long 
Education

Trendline Rejection Keeps Bearish Bias
Fundamental Analysis
Gold is supported by safe-haven demand as Middle East tensions intensify, but Brent above $100 is increasing inflation concerns. Markets are now focused on U.S. PPI Thursday and CPI Friday, with a Fed rate hike still being priced as a meaningful possibility.
Technical Analysis
On H1, Gold remains below the descending trendline after the recent CHoCH and BOS, keeping the short-term structure bearish.
Price is now near 4,410, where the trendline creates immediate resistance. The stronger sell area sits around 4,428–4,442 OB + Fibo.
Volume Profile also shows heavy activity around 4,380–4,410, making rebounds into this area important for sellers.
Important Key Levels
4,485–4,495 — BSL / Major Resistance
4,428–4,442 — OB + Fibo / Resistance
4,380–4,395 — POC
4,340–4,355 — Liquidity
4,305–4,320 — SSL
Trading Scenario
Sell priority remains while Gold stays below the descending trendline and 4,428–4,442 resistance.
Target: 4,340–4,355 first, then 4,305–4,320 SSL.
Invalidation: H1 acceptance above 4,442 and the trendline.
Overall View
The H1 structure remains bearish. The cleaner approach is to wait for rejection around resistance rather than chase price lower, with liquidity and SSL remaining the main downside objectives.
Will Gold reject the trendline again and sweep 4,350 next? Short 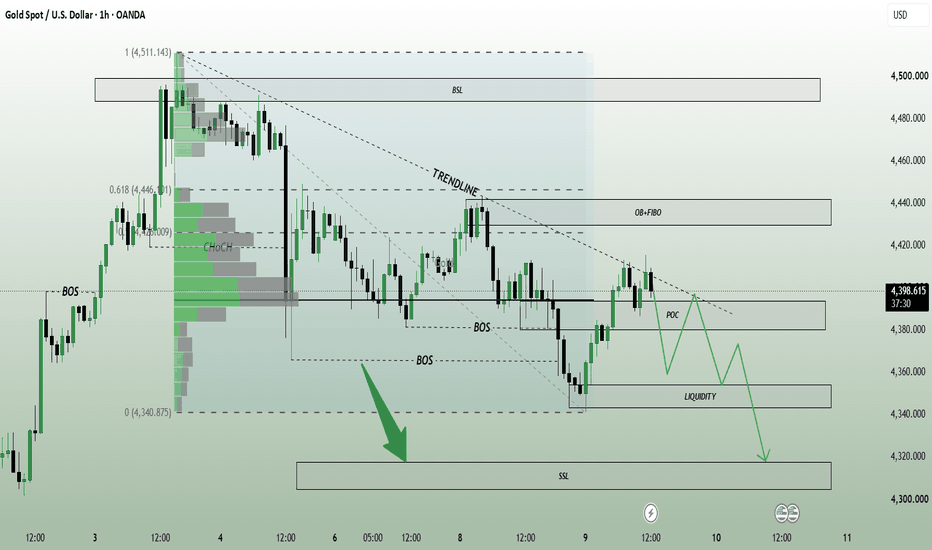
BRIAN XAUUSD – GOLD BREAKS RANGE, SELLERS TARGET LOWER VALUE BRIAN XAUUSD – GOLD BREAKS RANGE, SELLERS TARGET LOWER VALUE
Gold is entering the end of the week under strong pressure.
After several sessions of narrow movement, price finally broke below the previous consolidation range and tested the 4,300 area. This is important because the market had been holding value earlier in the week, but the latest breakdown shows that buyers lost short-term control.
The macro background also supports caution. The US dollar remains firm after stronger PPI inflation data, while the market is waiting for the next US CPI report. At the same time, Middle East tension and higher oil prices continue to keep inflation risk alive. That creates a difficult environment for gold, because safe-haven demand can support price, but stronger USD and hawkish Fed expectations can pressure any recovery.
So the message is clear:
Gold is not ready for a clean bullish recovery yet.
Sellers are still controlling the structure below 4,362 - 4,386.
Technical structure
On the 45-minute chart, gold is trading around 4,330 after breaking down from the previous value range.
The market is moving inside a descending trendline structure. Price has already lost the prior support base and is now attempting a weak recovery from the lower part of the channel.
The first important resistance is the Sell zone POC around 4,362. This is the nearest value resistance. If gold rebounds into this area and rejects, sellers may continue pushing price lower.
Above that, the stronger resistance is the Sell zone VAH and support flip around 4,386. This zone is very important because it was previous support, but after the breakdown, it may now act as resistance. As long as gold stays below 4,386, the bearish structure remains valid.
The downside target is the lower channel area around 4,275 - 4,285. If CPI volatility supports USD strength, gold may rotate toward this lower value zone before buyers attempt a stronger reaction.
Important zones
Current price area: 4,325 - 4,335
Gold is consolidating near the weekly low after breaking the previous range.
Sell zone POC: 4,355 - 4,365
First short-term resistance and seller reaction zone.
Sell zone VAH / support flip: 4,380 - 4,390
Main resistance. Buyers need to reclaim this area to weaken the bearish view.
Lower channel target: 4,275 - 4,285
Main downside target if sellers continue controlling the structure.
Key psychological support: 4,300
Price already tested this area; losing it again can invite more downside pressure.
Trading scenario
Priority view: sell reaction from 4,362 - 4,386
Entry:
Look for sell positions only if gold rebounds into 4,355 - 4,365 or 4,380 - 4,390 and shows clear bearish rejection.
Stop Loss:
Above the rejection high or above the 4,386 resistance zone.
Take Profit:
TP1: 4,310 - 4,300
TP2: 4,285
TP3: 4,270 if bearish momentum expands after CPI
This setup follows the current breakdown structure. Sellers have the advantage while gold remains below the flipped value resistance.
Alternative buy scenario
A buy setup is only interesting if gold sweeps the 4,300 area or reaches 4,275 - 4,285, then forms a strong bullish rejection.
Entry:
Buy only after confirmation from the lower channel support area.
Stop Loss:
Below the local sweep low.
Take Profit:
TP1: 4,330
TP2: 4,362
TP3: 4,386 if buyers reclaim momentum
This is only a reaction-buy idea, not a bullish trend-following setup yet.
Final view
Gold has broken the previous range to the downside, and RSI turning negative confirms that short-term momentum has shifted toward sellers.
For now, I would not chase buy just because price is near the low. The cleaner plan is to wait for price to retest resistance, then watch the reaction.
The map is simple:
Below 4,362 = sellers keep pressure.
Reject 4,362 = downside can retest 4,300.
Reject 4,386 = bearish structure remains strong.
Lose 4,300 = 4,275 - 4,285 becomes the next target.
Break above 4,386 = bearish pressure weakens.
Gold is now in a CPI decision zone. If sellers continue to defend 4,362 - 4,386, the next move may be a deeper rotation into lower value. If buyers reclaim 4,386, the breakdown may turn into a false move.
Will gold reject from the flipped value zone, or will CPI create a reclaim back above 4,386?
Short 
Trading Masterclass #1Institutional trading means trading like hedge funds, banks, prop firms, and professional desks. They do not trade based on emotions, random tips, or gambling. They use systems, probabilities, risk control, position sizing, discipline, and psychology.
Retail traders often lose because they focus only on “entry.” Institutions focus on:
Risk Management
Capital Protection
Position Sizing
Probability
Psychology
Consistency
Repeatable Edge
In options trading, if you think like institutions, your results can improve significantly
 Education

 Long
Long
XAUUSD — Bullish Reaction From Fibonacci SupportMarket Pulse
Gold is getting some support from a softer U.S. dollar, but high bond yields and oil above $100 are keeping inflation concerns alive.
The market is now focused on U.S. PPI and CPI. These reports could quickly change Fed rate expectations and create stronger volatility for Gold.
What the Chart Says
XAUUSD is reacting from an important H1 support area after the latest pullback.
Price reached the 4,386–4,396 OB + liquidity zone, which also sits close to the 0.50 Fibonacci level around 4,388. Buyers are starting to react from this area.
The next support below is around 4,376–4,378, where the 0.618 Fibonacci retracement sits. If the pullback becomes deeper, the 4,348–4,355 support + OB remains the stronger lower zone.
For now, the chart favors a recovery as long as buyers continue to defend the current Fibonacci support.
The first upside area is 4,408–4,412, followed by the stronger 4,424–4,432 OB + rejection zone.
Levels That Matter
4,424–4,432 — OB + rejection
4,408–4,412 — Near-term resistance
4,386–4,396 — OB + liquidity / 0.50 Fibo
4,376–4,378 — 0.618 Fibonacci
4,348–4,355 — Major support + OB
My Main Plan
The main plan is bullish.
I prefer watching the 4,386–4,396 area for continued buyer support. If price holds this zone and bullish confirmation appears, Gold could recover toward 4,408–4,412 first.
A clean move above that area may open the way toward 4,424–4,432.
What I Need to See
I want to see the current support hold and price form a clear higher low.
A sustained H1 break below 4,376 would weaken the immediate bullish setup and increase the chance of a deeper move toward 4,348–4,355.
Final Read
The H1 chart is showing a possible bullish recovery from Fibonacci and liquidity support.
For now, I prefer buying only after confirmation from support rather than chasing price higher, especially with U.S. inflation data likely to increase volatility. Long 


