BRIAN XAUUSD – GOLD REMAINS STRONG DESPITE FEARBRIAN XAUUSD – GOLD IS NOT WEAK BECAUSE OF FEAR, IT IS WEAK BECAUSE BUYERS CANNOT HOLD VALUE
Gold begins the new week in a very uncomfortable position.
The market had every reason to attract safe-haven flow, but price still failed to build a strong recovery. That tells me one thing: fear is not controlling this chart. Value is.
Last week, gold tried to rebound from the lower area, but buyers could not keep price above the key intraday value zone. The auction is still heavy. Every recovery attempt is being tested quickly, and sellers are still forcing price back into lower value.
Technical structure
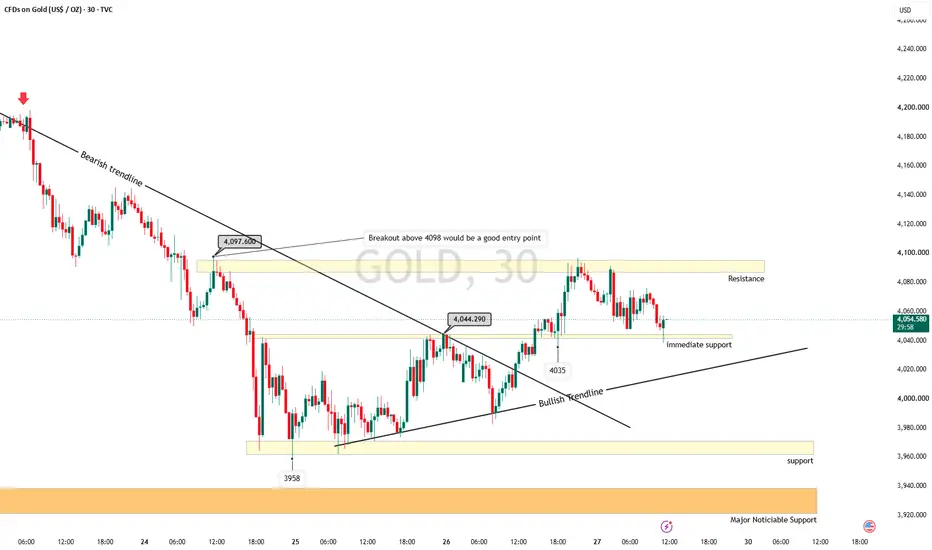
On the H1 chart, gold is trading below the upper value area and has not shown real acceptance above the POC Reaction Zone.
The area around 4,060 - 4,067 is now the key battlefield. If price cannot hold above this zone, the rebound loses quality and sellers can take control again.
Above that, 4,090 - 4,095 is the zone that would change the short-term tone. Until gold reclaims that area, the market is still trading like a weak auction, not a bullish recovery.
Below current price, 4,020 - 4,025 is the first support to watch. If this area breaks, the path opens towards the lower demand rotation around 3,975 - 3,985.
Important zones
POC Reaction Zone: 4,060 - 4,067
Current value test. This is where buyers must prove strength.
Upper Liquidity Reaction: 4,090 - 4,095
The level gold needs to reclaim to reduce bearish pressure.
Value Shift Support: 4,020 - 4,025
First downside support if sellers regain momentum.
Main Demand Rotation: 3,975 - 3,985
Lower value area and weekly downside magnet.
Trading scenario
Sell reaction from POC Reaction Zone 4,060 - 4,067
Entry:
Look for sell positions only if price tests 4,060 - 4,067 and fails to stay above it.
Stop Loss:
Above the rejection structure or above the POC zone.
Take Profit:
TP1: 4,047
TP2: 4,020 - 4,025
TP3: 3,975 - 3,985
This setup is not about chasing weakness. It is about waiting for gold to fail at value, then trading the next rotation lower.
Weekly outlook
For this week, I see gold as a market that can still rebound, but only inside a weak structure unless 4,090 - 4,095 is reclaimed.
If gold stays below 4,060 - 4,067, sellers remain in control.
If price loses 4,020 - 4,025, the lower demand rotation near 3,980 becomes the next realistic target.
Final view
Gold is not giving a clean strong-buy signal.
The chart is showing weak acceptance, failed recovery, and pressure below value. That makes the current structure dangerous for early buyers.
For me, the key is simple:
Hold above 4,090, pressure can ease.
Fail below 4,067, sellers keep the edge.
Break 4,020, lower value opens again.
This week is not about predicting the move. It is about watching where gold accepts value — and where it gets rejected.  Short
Short
Short 
Long 
Long 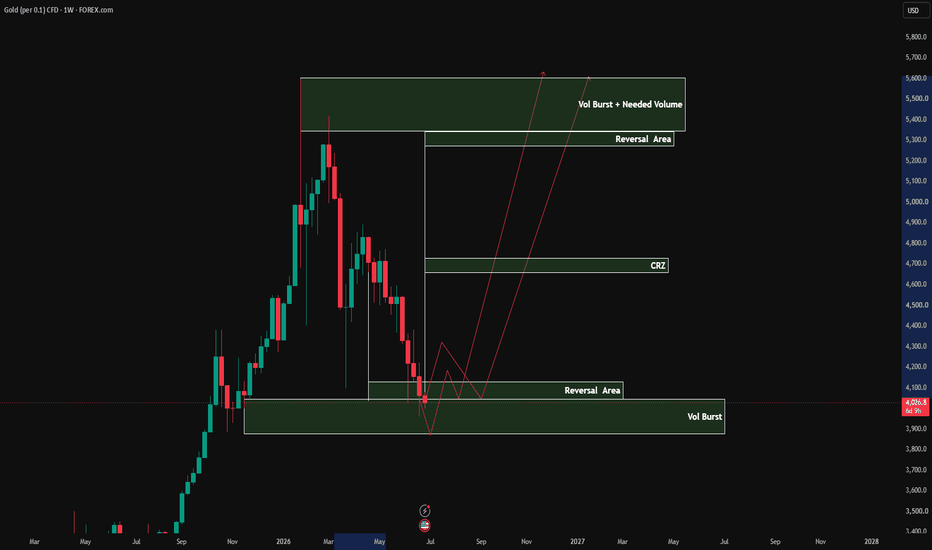
GOLD (XAUUSD) | WEEKLY STRUCTURAL ANALYSISINTRODUCTION
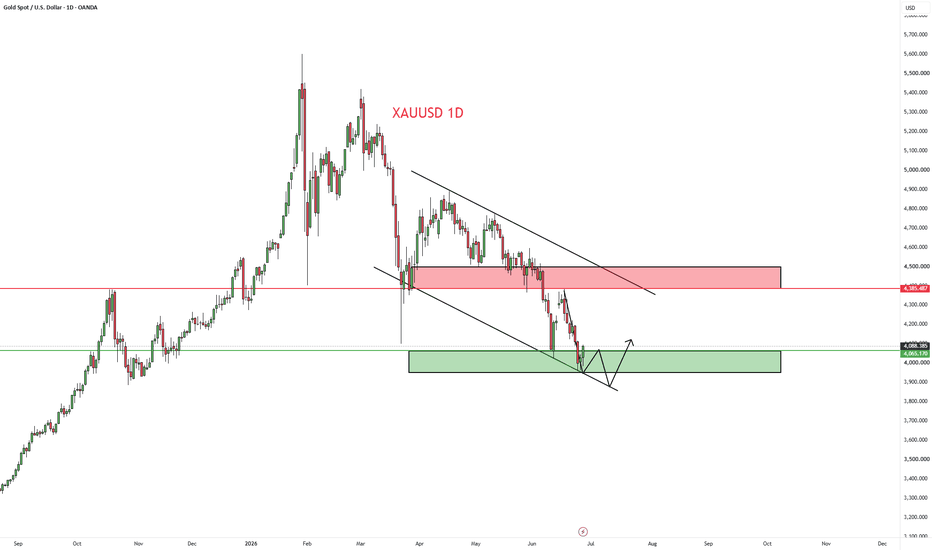
Gold remains within a Corrective Decline, with selling pressure continuing to dominate around the primary Support Zone. The broader structural framework remains corrective, while current participation indicates the market is testing an important structural reference rather than confirming a structural recovery.
STRUCTURE
Structure: Corrective Decline
Structural Phase: Corrective
MARKET CONTEXT
Current Position: Within Support Zone
Structural Area: Support Zone
Participation: Support Active
Interpretation: Selling pressure continues to test the primary Support Zone while support participation remains active. Structural recovery has not yet been confirmed.
KEY LEVELS
Resistance Zone: 5,400–5,600
Structural Pivot Zone: 4,800–4,900
Behavioural Pivot Zone: 4,450–4,550
Support Zone: 4,000–4,200
Structural Base: 3,800–3,900
STRUCTURAL TRIGGERS
Continuation: Acceptance below the Support Zone.
Review: Acceptance above the Structural Pivot Zone.
STRUCTURAL INTERPRETATION
The dominant structure remains corrective. Although price is interacting with the Support Zone, selling pressure continues to dominate the broader structure. Current participation suggests support is being tested rather than a structural reversal being confirmed.
The Support Zone remains the immediate structural reference, while acceptance above the Structural Pivot Zone is required before considering a broader structural recovery.
EDUCATIONAL INSIGHT
Markets frequently stabilize within support before deciding their next structural direction. Support represents an area of participation—not a guaranteed reversal point. Structural recovery requires market acceptance at higher structural references rather than a short-term bounce from support.
CLOSING THOUGHT
Structure remains corrective.
The Support Zone remains the key structural reference under observation.
Observe participation before assuming recovery.
EDUCATIONAL DISCLAIMER
This publication is an educational structural market study. It does not constitute investment advice, financial advice, trading advice, or a prediction of future market direction. The observations presented reflect structural market behaviour at the time of publication.
#Gold #XAUUSD #MarketStructure #StructuralAnalysis #PriceAction #SupportResistance #TradingView #TechnicalAnalysis #Commodities
Structure → Level → Trigger → Probabilit y
Analyze. Educate. Empower. XAUUSD Weekly Outlook: Hunting for the Next Order BlockHere is a comprehensive technical analysis of XAUUSD based on your structural breakout levels.
The market is currently exhibiting high volatility around the psychologically crucial 4,000 handle, acting as a massive structural pivot. Your breakdown of the specific "if/then" breakout scenarios maps perfectly onto current market mechanics, utilizing key Liquidity Zones, Supply/Demand imbalances, and Order Blocks.
Scenario 1: The Bullish Breakout (4150 $\rightarrow$ 4183)
▲
│ (Aggressive Expansion / FVG Fill)
│
┼ ── ── ── ── ── ── ── ── ── ── ── ── ── ── ──
▲
│ (Sustained H4/D1 Candle Close Above)
The Catalyst (4,150 Break): The 4,150 zone acts as immediate overhead resistance and a cluster for buy-stop liquidity. For this move to validate, we need to see a clean H4 or D1 candle close above 4,150 to confirm a structural Shift in Market Structure (SMS) rather than a simple liquidity sweep (fakeout).
The Path to 4,183: Once 4,150 flips to support, it clears a path through a minor Fair Value Gap (FVG) left behind during recent distributions.
The Target (4,183): The 4,183 target aligns precisely with a previous daily Rejection Block/Supply Zone. Expect heavy profit-taking here. If bulls clear this, it opens the door to retest the stronger 4,220 structural resistance.
Scenario 2: The Bearish Breakdown (4054 $\rightarrow$ 4022)
│
┼ ── ── ── ── ── ── ── ── ── ── ── ── ── ── ──
│ (Breaching Intermediary Support)
▼
│ (Panic Selling / Stop-loss Cascade)
The Catalyst (4,054 Break): The 4,054 level represents the immediate local higher-low/demand failure point. Breaking below this level signals a continuation of the broader bearish order flow.
The Path to 4,022: A clean break below 4,054 will trigger sell-stops from retail buyers trying to catch a bounce near the 4,050 psychological level. This cascade of selling momentum should quickly flush price lower into the next major liquidity pool.
The Target (4,022): The 4,022 area is a critical Higher Timeframe (HTF) Demand Block and a previous structural swing low. This is a high-probability zone for institutional buyers to step in, look for a sweep of sell-side liquidity, and potentially initiate a sharp corrective rebound back toward 4,100+.
⚠️ Key Risk Note: Keep a close eye on the macroeconomic calendar—specifically upcoming FOMC statements and Nonfarm Payrolls (NFP). High-tier news drops can cause rapid, volatile spikes that bypass these level-to-level targets before stabilizing. Protect your capital by trailing stops once price reaches 50% of either target path.
Long 
XAUUSD (Gold) 2H Chart Analysis – Bullish Reversal SetupGold is showing early signs of a bullish recovery after completing a potential Bullish Bat Harmonic Pattern near a strong demand zone. Price has already reacted sharply from point C and is now pulling back into the highlighted buy area, where buyers may step in for the next upward leg.
The current retracement appears to be a healthy correction rather than a trend reversal. As long as price remains above the marked support, the bullish structure stays valid, with the market favoring a continuation toward the projected D target.
A bullish rejection candle or a break above the recent swing high would provide stronger confirmation that buyers are regaining control.
Trade Setup
Bias: Bullish
Pattern: Bullish Bat Harmonic
Timeframe: 2H
Entry Zone: 4,025–4,035
Stop-Loss: Below 3,963
Target: 4,193
Technical Perspective
The market is currently respecting the demand zone while maintaining a sequence of higher lows from point C. If this support continues to hold, momentum could build toward the harmonic completion level around 4,193, which also coincides with a significant resistance area.
Failure to hold above the support zone would invalidate the setup and increase the probability of a deeper correction.
Trading Plan
The ideal approach is to wait for bullish confirmation inside the entry zone before entering a long position. Managing risk is essential, as the setup remains valid only while price trades above the defined invalidation level.
Key Levels
✅ Buy Zone: 4,025–4,035
🎯 Target: 4,193
❌ Invalidation: Below 3,963 Long 
1H Technical Analysis – Bullish Recovery from Support Toward 1H Technical Analysis – Bullish Recovery from Support Toward Resistance
Market Structure
The chart shows that Gold (XAU/USD) remains in a broader downtrend, confirmed by the descending red trendline. However, recent price action indicates a short-term bullish correction after finding strong support around the highlighted demand zone.
Key Observations
🔻 Trend
Overall market structure is still bearish.
The descending trendline has been respected multiple times.
Price recently broke above the trendline, suggesting buyers are attempting a recovery.
🔵 Support Zone
Support Area: 3,990 – 4,020
This demand zone has attracted buyers several times.
As long as price remains above this area, the bullish retracement remains valid.
🟣 Current Price
Current price is around 4,052.
Price is consolidating just above support after the recent bounce.
🔴 Resistance Levels
First Resistance
Around 4,130–4,145
Previous supply zone and the 50% Fibonacci retracement.
Major Resistance
Around 4,190–4,210
Aligns with the 61.8% Fibonacci retracement.
Strong supply area where sellers may re-enter.
Bullish Scenario
If buyers defend the support zone:
Hold above 4,020
Break above 4,080
Target 4,140
Extend toward 4,200 (major resistance)
This matches the projected bullish path drawn on the chart.
Bearish Scenario
If price fails to hold support:
Break below 4,000
Retest 3,980
Further downside could revisit the recent swing low near 3,950–3,960.
Trading Plan
Bias Entry Stop Loss Target
Buy on Pullback 4,020–4,035 Below 3,990 4,140 → 4,200
Buy on Breakout Above 4,080 Below 4,045 4,140 → 4,200
Sell Rejection 4,190–4,210 Above 4,225 4,100 → 4,020
Overall Outlook
Bias: Short-term Bullish | Long-term Neutral to Bearish
The chart suggests a bullish retracement is underway after a strong reaction from the support zone. The most likely path is a move toward 4,140, followed by a test of the 4,200 major resistance. However, unless price decisively breaks and holds above 4,200, the broader downtrend remains intact, and sellers could regain control from that resistance area. Long 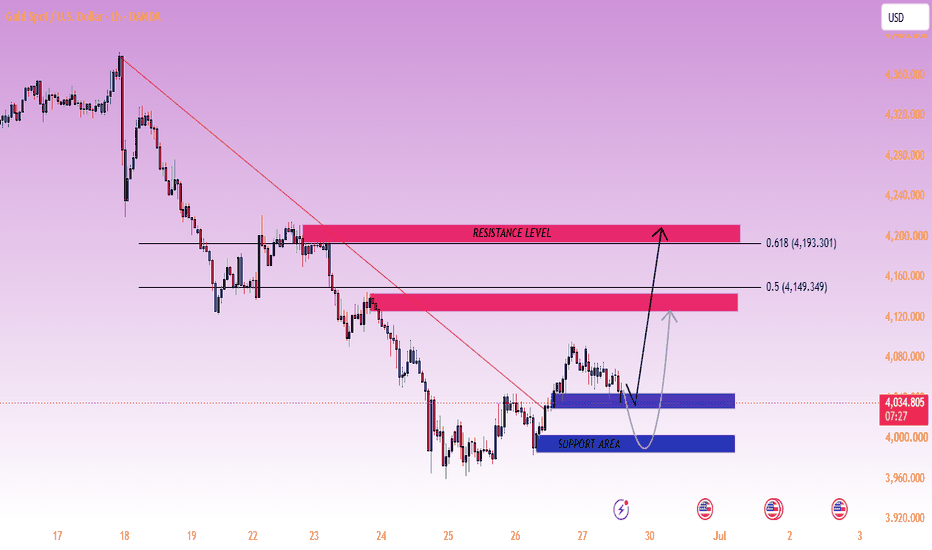
Short 
Short 
XAUUSD: Weekly ABC recovery ongoing.◈ XAUUSD: Weekly ABC Recovery Is Still Developing
Gold is showing a corrective recovery after reacting from the lower base around 3,980–4,000. From Kelly’s view, the current structure is developing as an Elliott ABC recovery, with price now holding above the 4,042 buy zone and trying to build momentum for the next upside leg.
The key idea is simple: the broader trend is still fragile, but the short-term recovery structure remains valid while gold holds above the buy zone.
⟡ Market structure
The chart shows gold rebounding from the lower accumulation area after a strong bearish move. Price formed the first recovery leg, pulled back into support, and is now attempting to continue higher from the 4,042 area.
The current reaction around 4,058 suggests buyers are still defending the short-term structure. If this support remains valid, gold may continue developing wave C towards the next Fibonacci resistance zone.
The first important upside area is around 4,125, where the chart marks a Fibonacci sell zone. If price breaks above this area with strength, the recovery could extend further towards 4,213.
➤ Key levels
◌ 4,042: buy zone and current support area
◌ 4,058: current reaction zone
◌ 4,095–4,100: short-term resistance checkpoint
◌ 4,125: Fibonacci sell zone and first major target
◌ 4,213: possible wave 5 completion / upper weekly target
◌ Below 4,042: area where the ABC recovery weakens
⌁ Elliott Wave view
From an Elliott Wave perspective, gold appears to be forming a weekly ABC recovery after completing the previous bearish impulse.
Wave A created the first rebound from the lower base.
Wave B corrected back into the buy zone and held above support.
Wave C may now be developing from the 4,042 area, with the first target near 4,125.
If wave C expands with stronger momentum, the move could transform into a broader 5-wave recovery, opening the path towards the 4,213 area.
However, if gold loses 4,042 and fails to reclaim it, the ABC structure becomes weaker and the market may need to form another base before recovery can continue.
▸ Trading scenario
Preferred scenario: wait for gold to hold above the 4,042 buy zone and continue building the ABC recovery.
Entry zone: 4,042–4,060 if bullish confirmation appears
Stop loss: below the confirmed reaction low or below 4,020
Take profit 1: 4,095–4,100
Take profit 2: 4,125
Take profit 3: 4,213 if wave C expands strongly
Alternative scenario: if gold breaks below 4,042 with clear bearish pressure, the weekly ABC recovery loses quality and price may return to the lower accumulation area before building a new structure.
⌁ Kelly’s view
For Kelly, this is a recovery setup, but still not a full trend reversal. Gold is trying to build an ABC structure from the lower zone, and the buy area around 4,042 is the key support to protect.
If buyers continue defending this area, the next weekly move may target 4,125 first, then 4,213 if momentum improves.
Gold is recovering from the lower base.
The ABC structure remains active while the buy zone holds.
Share your view below. Long 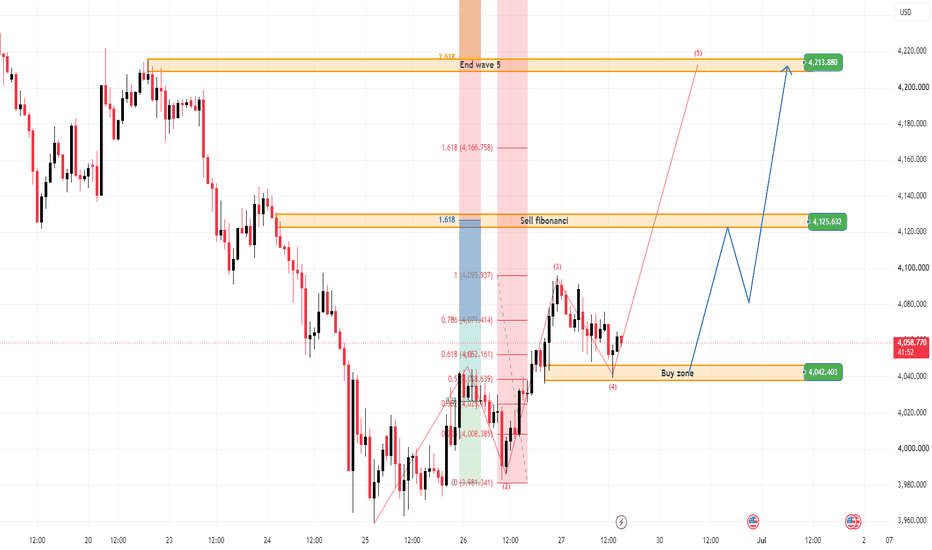
Gold trading plan for the next 3-18 monthsAccumulate zone for holding than 12 months: $2,000-$2,300
For swing trading plan: wait 3,200-3,000 zone, strong buy where 1 day and 1W candle leave hidden liquidity. When price moves from 3,200ish zone to 3,800ish zone: sell all, it’s where another liquidity zone before going down further
Reverse zone to continue the upward: 4,400ish must 1W close above otherwise next level is 3,200ish Short 
XAUUSD – A Gentle Start To The Week, Gold Is Trying To Build HigXAUUSD – A Gentle Start To The Week, Gold Is Trying To Build Higher
Gold is starting the new week with a calmer recovery structure.
After the strong decline last week, price found support near the lower area and has been moving inside a short-term rising channel. Gold is now trading around 4,058, holding above the buy-test zone around 4,030 – 4,040.
The recovery is not aggressive, but it is becoming cleaner. If buyers continue to protect the channel support, gold may have room to move higher toward the strong liquidity area around 4,135 – 4,145 this week.
WEEKLY TREND OUTLOOK
Last week, gold was mostly under bearish pressure. Price dropped sharply, broke several short-term support zones, then started to stabilize near the lower range.
At the start of this week, the structure is showing a softer tone. Buyers are trying to build higher lows, while price is moving inside a rising corrective channel.
The key for this week is simple: if gold holds above 4,030 – 4,040, the recovery may continue toward 4,100 and 4,135 – 4,145. If this support fails, the recovery structure becomes weaker and sellers may return.
FUNDAMENTAL ANALYSIS
Gold remains sensitive to USD movement, Treasury yields, and rate expectations. After last week’s strong decline, the current rebound may be supported by short-term technical buying and profit-taking from sellers.
For now, price action around the buy-test zone and the strong liquidity area is the main focus.
TECHNICAL ANALYSIS – SMC + MARKET STRUCTURE
From an SMC perspective, gold has shifted from direct bearish continuation into a short-term recovery phase.
The market is now forming higher reactions from the lower channel area. The 4,030 – 4,040 zone is the current buy-test support. As long as price respects this area, buyers may continue to control the short-term structure.
The first upside area to watch is around 4,100 – 4,110. If gold breaks above this level with momentum, the next target may be the strong liquidity zone around 4,135 – 4,145.
However, this is still a recovery inside a larger corrective structure. If price reaches the upper liquidity zone and shows rejection, a pullback may appear again.
KEY PRICE ZONES TO WATCH
Current price: 4,058
Buy-test support: 4,030 – 4,040
Channel support: Around 4,030
Resistance 1: 4,100 – 4,110
Strong liquidity zone: 4,135 – 4,145
Higher recovery target: 4,160
Bearish pressure returns: Below 4,030
Invalidation for recovery view: Below 4,030
TRADING SCENARIOS
Buy Scenario – Weekly Recovery View
Buy Zone: 4,030 – 4,040
Entry: Bullish reaction, liquidity sweep, or lower-timeframe CHoCH
SL: Below 4,030
TP1: 4,100 – 4,110
TP2: 4,135 – 4,145
TP3: 4,160 if momentum continues
Breakout Buy
Condition: Break and hold above 4,110
Target: 4,135 – 4,145
Sell Scenario – Only If Support Fails
Sell Zone: Below 4,030 after confirmation
Entry: Clean breakdown, bearish retest, or strong bearish displacement
TP1: 4,000
TP2: 3,980
TP3: Lower channel support if selling pressure expands
Invalidation: If price quickly reclaims 4,030 – 4,040
MY VIEW ON GOLD
Gold is opening the week with a gentle recovery tone.
The chart shows buyers are trying to build a base above 4,030 – 4,040. If this zone continues to hold, I expect gold to move higher toward 4,100 first, then possibly 4,135 – 4,145.
But I still want confirmation. The recovery is valid only while price respects the lower channel and holds above the buy-test support.
For now, gold is not fully bullish yet, but the path toward the strong liquidity zone is open if buyers protect 4,030.
Do you think gold can hold 4,030 and continue toward 4,140 this week?
Long 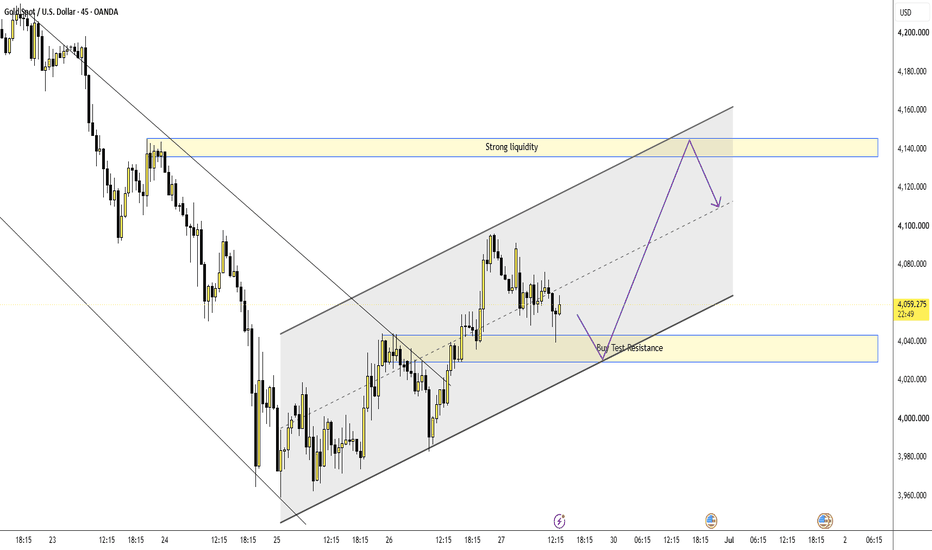
Long 
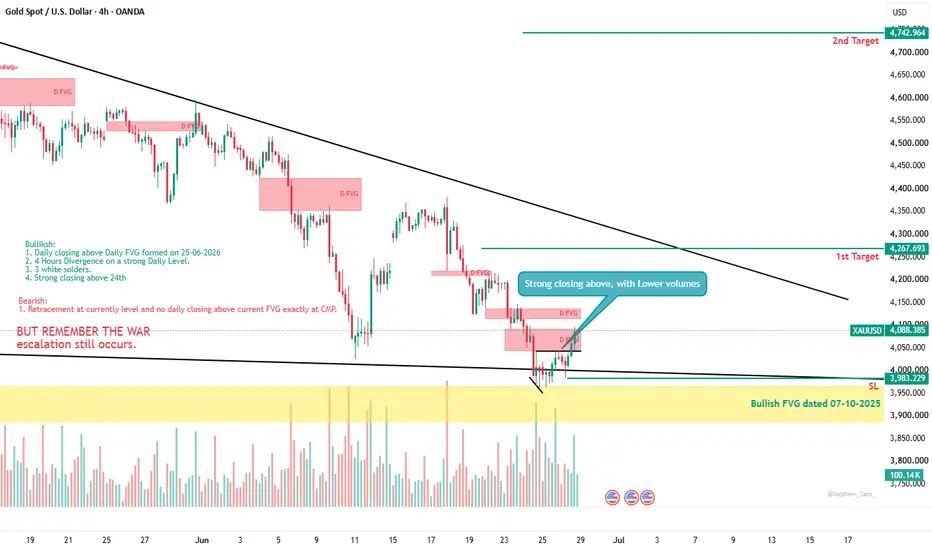
DON'T SHORT GOLD UNTIL YOU READ THISFor the last two weeks, gold has been under continuous selling pressure, which has caused many traders to panic sell. The big question now is whether gold will continue its decline this week or if we are about to see a reversal. Let's break it down in detail.
To be honest, the area from which gold found support last week is likely to act as a temporary support zone for now. If you study gold's price action throughout this year, you'll notice a recurring pattern: whenever an important support level breaks, the market often stages a short-term recovery before continuing its larger trend. This usually happens because the market needs to attract buyers and create fresh liquidity before making its next move.
Recently, gold broke our important $4024 support level. After that breakdown, the market spent some time consolidating around the $4000 area before finally showing a strong upside move on Friday. In my opinion, this wasn't a random bounce. The $4000 level is a major psychological price, and once it broke, many traders aggressively jumped into short positions expecting a much larger decline. The market then pushed higher to trap those late sellers. At the same time, buyers started stepping back into the market, which is another reason why we saw strength after the consolidation. Because of this, I believe gold still has the potential to move higher in the short term, mainly to trap the traders who randomly entered selling positions last week and are still holding them.
One of the biggest reasons behind my bullish short-term view is the overall market psychology. The last time gold broke the $5000 level, we witnessed a major sell-off. That previous move has made many traders extremely aggressive around the $4000 area, with most expecting another significant decline after the recent breakdown. However, I don't believe the market will repeat the exact same behavior this time. Instead, I think it will first focus on trapping those aggressive sellers before deciding its next major direction.
Last week itself, I noticed several signs of a potential sell trap. From Monday onwards, the market never swept any significant highs and continued forming lower highs throughout the week. Even Tuesday's opening was below $4200, and from there gold experienced a straight decline. On Friday, the market closed around $4096, which is just below the important psychological level of $4100. Markets often attract a large number of traders near psychological levels, especially before the weekend, because many prefer to build overnight positions with stop losses placed around those round numbers. Looking at last week's overall behavior, I have very little doubt that a large number of traders entered overnight short positions near Friday's close.
What's interesting is that on Monday, gold started moving lower again without first sweeping last week's high. This strongly suggests that those overnight sellers are still confidently holding their positions. Whenever I see this type of positioning, my attention immediately shifts toward the possibility of a seller trap. Markets often move against the majority before making their real directional move, and I believe that's exactly what could happen this week.
My Monday trading plan is very straightforward. As I've mentioned before, the $4025 level is extremely important. As long as gold remains above this level, my overall bias stays bullish. The $4034-$4044 zone is my primary support area, and I'll be looking for buying opportunities there with proper confirmation. At the same time, if you're a conservative trader, I'd recommend avoiding trades between $4044 and $4067 because, based on the current price action, momentum remains choppy within this range and the market can easily produce false moves. However, if gold delivers a strong breakout above $4067 with solid momentum, I'll be comfortable buying the breakout and will look to target the $4080, $4096, and $4128 levels. The only thing I want to see before chasing those targets is a clean breakout supported by strong bullish momentum.
Because of this, my overall bias remains bullish above $4020. As I mentioned last week, the $4084 level is extremely important. If the market can hold above $4020 and then deliver a strong close above $4084, I believe sellers could get trapped very quickly, leading to a sharp zig-zag upside move. Once that confirmation arrives, the market should have enough momentum to begin a stronger directional rally.
Overall, I'm expecting gold to eventually move towards the $4280 region in the coming sessions. The only condition for this bullish outlook is that the market continues holding above $4020 and successfully reclaims $4084 with a convincing close. If both conditions are met, I believe we could see a very clean upside move from there.
I hope you found this analysis logical and helpful. Wishing everyone a profitable week ahead.
What's your plan for gold this week? Are you bullish, bearish, or waiting for confirmation? Let me know in the comments!
XAUUSD: Weekly ABC Recovery from Buy ZoneGold is starting the new week with a corrective recovery structure after reacting from the lower liquidity area near 3,950–4,000. From Kelly’s view, the current move is developing as an Elliott ABC recovery, but the chart also leaves room for a stronger 5-wave upside scenario if buyers continue to defend the buy zone.
The key idea is simple: gold has already reacted from the lower base, and the next weekly direction depends on whether price can hold above the liquidity retest zone.
⟡ Market structure
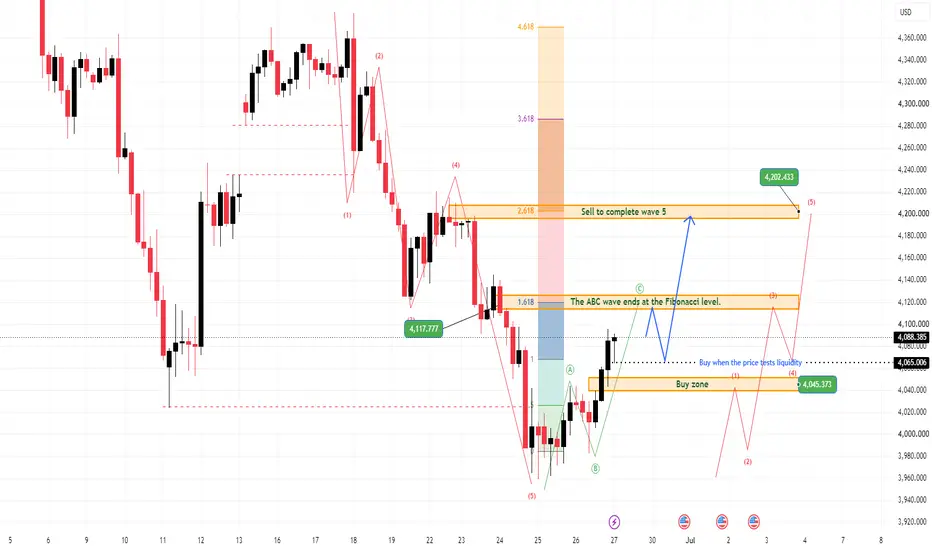
The chart shows gold completed a strong bearish sequence into the lower area, then started forming a recovery from the buy zone around 4,045. Price is now trading near 4,083, above the first liquidity reaction level.
This recovery is still early, but the structure is improving. If gold holds above the 4,045–4,065 area, the market may continue building wave C towards the Fibonacci resistance zone around 4,117–4,125.
Above that, the larger resistance and liquidity zone sits around 4,200–4,202, where Fibonacci 2.618 aligns with the projected upside structure.
➤ Key levels
◌ 4,045–4,065: buy zone and liquidity retest area
◌ 4,083: current reaction area
◌ 4,117–4,125: ABC completion / Fibonacci resistance zone
◌ 4,200–4,202: major liquidity zone and Fibonacci 2.618 target
◌ Below 4,045: area where the recovery structure weakens
◌ Below 3,950: area where the bullish recovery setup loses quality
⌁ Elliott Wave view
From an Elliott Wave perspective, gold appears to be developing an ABC corrective recovery after the previous bearish wave 5 completed near the lower base.
Wave A started from the low and created the first recovery reaction. Wave B corrected back into the buy zone and held above the liquidity base. Wave C may now be developing towards the 4,117–4,125 Fibonacci resistance area.
If wave C ends around this zone and price starts rejecting, the ABC recovery may be complete.
However, there is also a second scenario. If gold breaks above 4,125 with strong acceptance, the recovery may no longer be only a simple ABC correction. In that case, price could develop into a 5-wave bullish sequence, with the next major target around 4,200–4,202 at the Fibonacci 2.618 liquidity zone.
▸ Trading scenario
Preferred scenario: wait for price to hold the 4,045–4,065 buy zone and continue the ABC recovery.
Entry zone: 4,045–4,065 if bullish confirmation appears
Stop loss: below the confirmed reaction low or below 4,030
Take profit 1: 4,117–4,125
Take profit 2: 4,160
Take profit 3: 4,200–4,202 if the move expands into 5 waves
Alternative scenario: if gold fails to hold above 4,045 and breaks below the buy zone, the ABC recovery weakens. In that case, price may return to the lower base and the bullish structure should be reassessed.
⌁ Kelly’s view
For Kelly, this is a weekly recovery setup, but it still needs confirmation. The ABC structure is active while price holds above the buy zone, and the first important target is the Fibonacci area around 4,117–4,125.
If buyers break through that resistance with strength, the chart may shift from a simple ABC rebound into a stronger 5-wave recovery towards 4,200–4,202.
Gold is recovering from the lower liquidity base. The ABC structure is valid for now, but a clean breakout may open the stronger 5-wave path.
Share your view below. Long 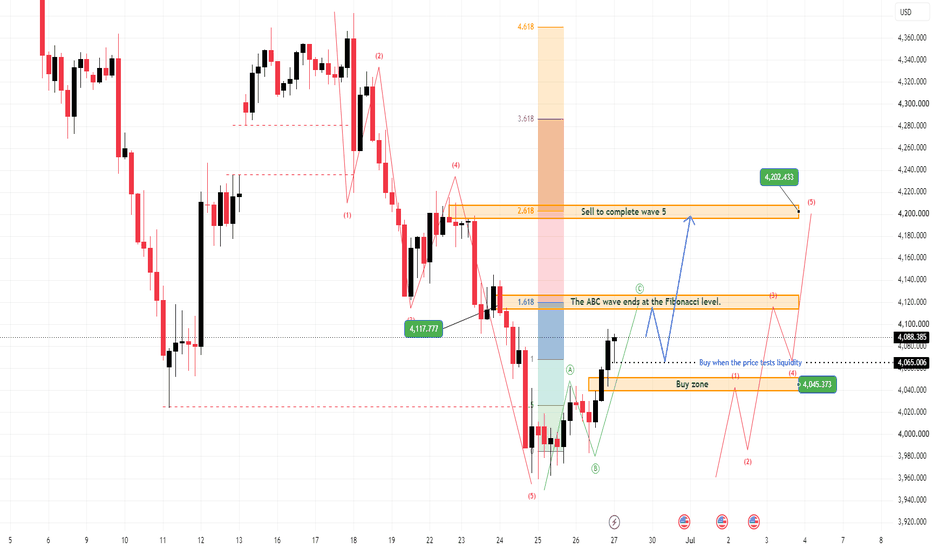
Long