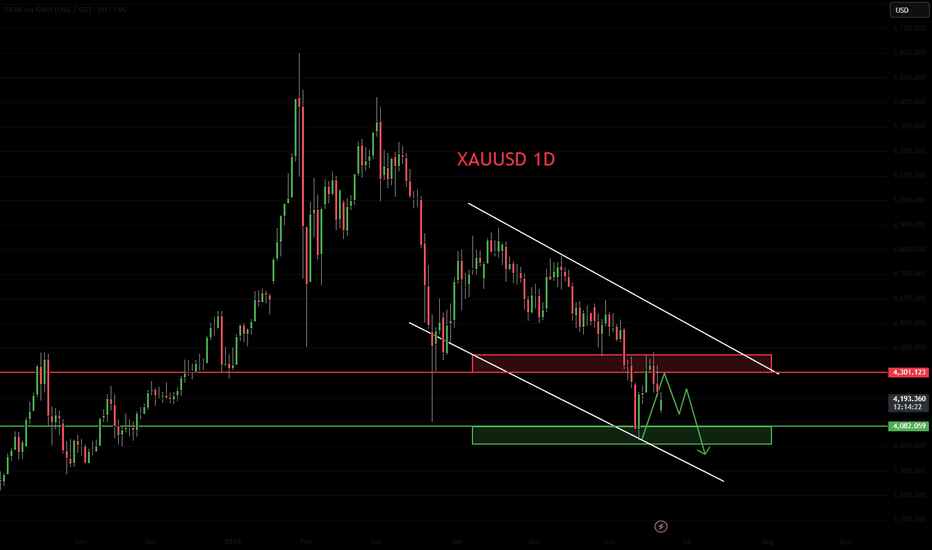
WARNING: GOLD'S BEARISH TREND CONTINUES UNABATEDGold continues to extend its bearish structure despite several factors that would normally support higher prices. This is exactly why traders need to focus on the broader macro narrative rather than individual headlines.
Over the past few sessions, markets have welcomed progress in peace negotiations, reducing geopolitical risk premiums. Oil prices have also softened, helping calm inflation concerns and easing pressure on global markets. Meanwhile, central banks and large institutional players continue to accumulate gold as a long-term reserve asset.
Under normal circumstances, these factors would be supportive for gold.
Yet gold keeps falling.
The reason is simple: the market is currently trading the strength of the U.S. Dollar more than the bullish gold narrative.
Inflation remains elevated enough to prevent the Federal Reserve from turning dovish. Recent Fed communication continues to reinforce the idea that interest rates may stay higher for longer, while the U.S. economy remains relatively resilient compared with other major economies. As long as yields remain attractive and the USD stays strong, capital continues to favor the dollar over non-yielding assets such as gold.
This creates a situation where positive gold news is unable to generate sustained upside momentum, while bearish catalysts continue to have a larger impact on price action.
From a structural perspective, gold has now confirmed multiple breakdowns and continues trading below key recovery zones. The market resembles a liquidation phase rather than an accumulation phase. Every recovery attempt has been met with renewed selling pressure, confirming that sellers remain firmly in control.
PRIMARY SCENARIO
The broader trend remains bearish.
Gold may continue to search for lower liquidity levels before a meaningful bottom can be established. However, after such an aggressive decline, chasing price lower becomes increasingly risky.
The preferred approach remains waiting for a technical recovery toward previously broken Demand + Fibonacci zones around 415x–420x, where fresh sell-side participation could re-enter the market.
MARKET VIEW
This market is teaching an important lesson:
Peace talks are bullish.
Lower oil is bullish.
Central bank buying is bullish.
Yet gold continues to decline.
That tells us the dominant force remains the USD and the higher-for-longer rate environment.
Until the market sees a meaningful shift in Fed expectations or a weakening dollar, rallies should be viewed cautiously and primarily as opportunities within a broader bearish trend.
Current Bias: Strong Bearish 📉
Key Zone: 415x–420x Retest Area
Macro Driver: Strong USD outweighing traditional gold-supportive factors.
LucasGrayTrading  Short
Short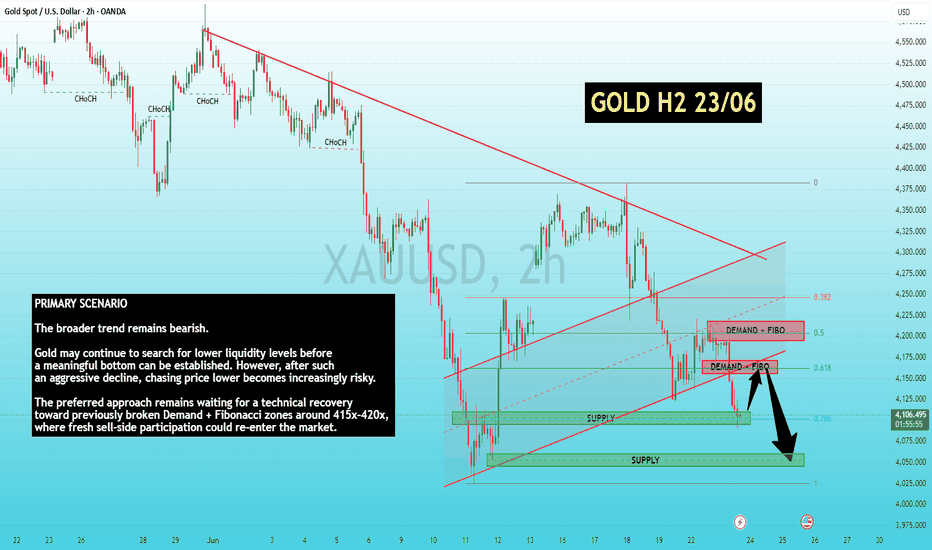
Short 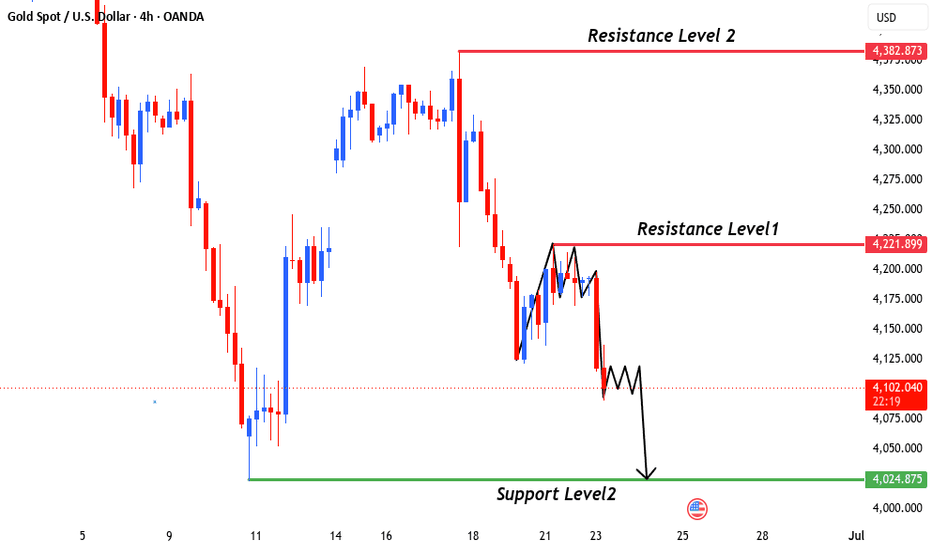
Trade Setup Breakdown: Identifying 1000-Pip Potential at 4210🐻 The Bearish Setup (Main Trend Continuation)
If the market fails to hold the $4,145–$4,150 region at open, it confirms bearish dominance heading into the London session.
Premium Entry Zone: Pullback into the internal H4 Fair Value Gap (FVG) / Rebalance Zone at $4,200 – $4,220. Alternatively, a direct lower-timeframe Market Structure Shift (MSS) on a rejection of $4,170 – $4,180.
Take Profit (TP):
TP1: $4,110 (Recent swing low)
TP2: $4,060 (Major institutional demand)
TP3: $4,020 (Weekly sell-side liquidity pool)
Stop Loss (SL): $4,235 (Placed safely above the local structural high/resistance level).
1. The Entry Triggers
For the Premium Entry: Do not blindly place a sell limit order at $4,200. Wait for the H4 candle to trade into the FVG, and look for a 5-minute or 15-minute displacement candle downward before clicking sell.
For the MSS Entry: Ensure the lower-timeframe shift breaks a clear swing low with a forceful, wide-range body candle. A slow drift lower is not a true market structure shift.
2. Risk Management & Invalidation
Your Stop Loss at $4,235 is structurally sound because if prices break above this level, the H4 FVG has completely failed, and the bearish thesis is entirely invalidated.
Trailing Stop Rule: Once price hits TP1 ($4,110), the trade has moved significantly in your favor. Move your Stop Loss to breakeven or just above the opening range high to secure a completely risk-free position for the remainder of the move.
3. Take Profit Mechanics
TP1 ($4,110): Take off 30–50% of your position size here. This pays the bills and covers your initial risk.
TP2 ($4,060): Take off another 30–40%. This is major institutional demand; expect an influx of buyers here that could cause a deep retracement.
TP3 ($4,020): Leave a small "runner" (10–20% of your initial position) to hit this weekly sell-side liquidity pool. Let it cook until it cleanly sweeps the pool. Short 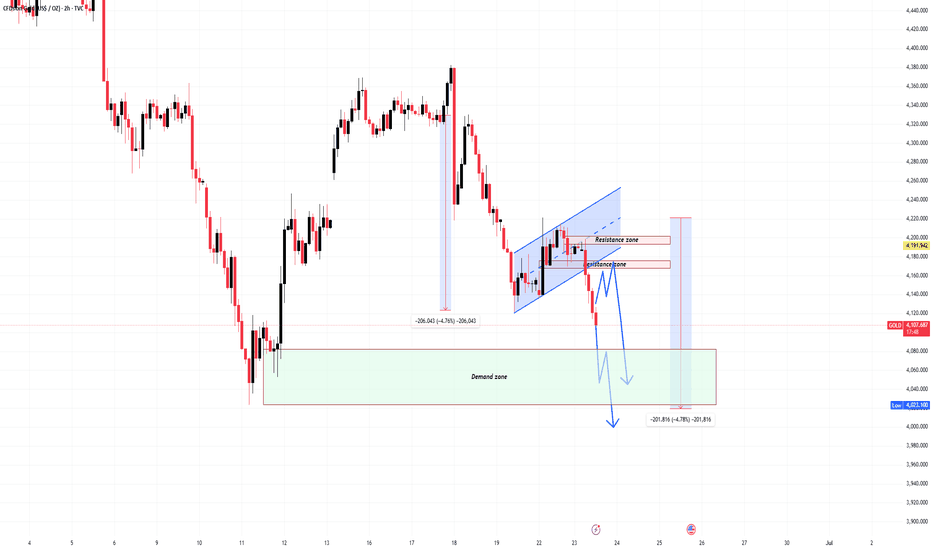
 Short
Short
BRIAN XAUUSD – Gold at decision zoneBRIAN XAUUSD – GOLD AT THE DECISION ZONE
Gold is now standing at one of the most important areas of the week.
After a weak rebound, price is being pushed back down into the 4,120 - 4,126 zone. This is not a random support. It is the closest low area, the place where buyers either defend the structure or allow a deeper breakdown.
The chart is simple now: gold either reacts here, or the next leg lower can open.
Technical structure
On the H1 chart, gold failed to hold above the Sellside Liquidity zone around 4,185 - 4,195. That rejection shows sellers are still active at the upper value area.
Price is now pressing directly into 4,120 - 4,126. This is the key decision zone.
If buyers defend this area, gold can create a short-term rebound back towards 4,160 and possibly 4,185 - 4,195.
If this zone is completely lost, the market may sweep lower towards last week’s bottom around 4,070.
Important zones
Decision zone: 4,120 - 4,126
Main support and current battlefield.
Sellside Liquidity: 4,185 - 4,195
Upper resistance and failed recovery area.
Short-term resistance: 4,240 - 4,250
Higher resistance if buyers regain control.
Last week’s bottom: 4,070
Next downside target if support breaks.
Trading scenario
Buy or breakdown reaction at 4,120 - 4,126
Entry:
Look for buy reaction only if price holds 4,120 - 4,126 and shows clear bullish rejection.
Stop Loss:
Below the decision zone or below the local sweep low.
Take Profit:
TP1: 4,160
TP2: 4,185 - 4,195
TP3: 4,240 if momentum expands
Breakdown condition:
If 4,120 - 4,126 is lost and price fails to reclaim it, the structure turns weak again. In that case, gold can continue lower towards 4,070.
Final view
Gold is not in the middle anymore. It is sitting directly on a major decision zone.
This is where the next move can be built.
Hold 4,120 - 4,126, gold can rebound.
Lose this zone, the door opens towards 4,070.
Would you buy the reaction here, or wait for the breakdown confirmation? Short 
Gold Is Bouncing, But Sellers Are Still Waiting AboveGold is starting the week inside a very interesting structure.
Price is no longer falling in one straight line, but the bigger pressure is still coming from the upper side of the chart.
The question this week is simple:
Is gold building a real recovery, or only bouncing into another sell zone?
THE SIMPLE READ
Gold is still moving inside a bearish channel structure.
The short-term bounce is trying to hold, but price is now trading below the 4,223 reaction zone. This area is important because it sits near the upper reaction zone where sellers may start watching again.
For beginners, this is where patience matters.
A bounce does not mean buyers are fully in control.
A bounce only becomes stronger when price can break resistance and hold above it.
WHAT I SEE
The first key area is 4,223.
This is the Zone React area. If gold pushes back toward this level and starts rejecting, sellers may try to protect the bearish structure again.
The current price is around the middle of the range.
That means chasing either side too early can be risky. The better approach is to wait for price to react at a clean level.
Below price, 4,128 is the first support and TP1 zone.
This level matters because if sellers take control again, gold may search for this area first.
The next important zone is 4,059.
This is marked as a React Zone and Buy React Fibo area. If price reaches this level, buyers may try to create a stronger reaction.
The deeper support is around 3,963.
This is the lower reaction zone. If bearish pressure expands during the week, this area becomes an important place to watch for a possible bigger response.
THE WEEKLY PLAN
📉 IF gold rejects below 4,223 and fails to break higher:
→ Sellers may stay in control
→ Price could move back toward 4,128 first
→ If 4,128 breaks, the next reaction zone is 4,059
→ If selling pressure continues, 3,963 becomes the deeper area to watch
→ Possible sell idea: after bearish confirmation near resistance
→ Invalidation: clear break and hold above 4,223
→ Target 1: 4,128
→ Target 2: 4,059
→ Target 3: 3,963
📈 IF gold breaks and holds above 4,223:
→ The short-term bearish pressure may weaken
→ Buyers may try to build a recovery structure
→ A breakout needs confirmation, not only one fast candle
→ Possible buy idea: after breakout and retest confirmation
→ Invalidation: back below the broken zone
→ First upside area: 4,260 - 4,300
⏳ No confirmation = no trade.
💡 Tiara’s Tip:
When price is inside a bearish channel, the safest question is not:
“Will gold go up or down?”
The better question is:
“Which level did price confirm first?”
If gold cannot break 4,223, the bounce may still be only a pullback.
If gold breaks and holds above 4,223, buyers may have a stronger chance to change the short-term structure.
For this week, I’m watching 4,223 as the main decision zone and 4,128 / 4,059 as the key downside reaction areas.
YOUR TURN
💬 What do you see this week — will gold reject from 4,223, or break higher and start a recovery?
Drop a 🔴 for seller rejection or 🟢 for breakout recovery below 👇 Short 
XAUUSD – Hold 4,121 or Break Down to 4,054? XAUUSD – Hold 4,121 or Break Down to 4,054?
Gold is sitting at one of the clearest decision zones on the H1 chart right now.
After failing to build above the recent intraday recovery area, price has dropped back into the 4,121 support zone. This is the kind of level that usually does not stay quiet for long. Buyers either defend it and force a rebound, or a clean breakdown opens the path toward the next strong liquidity area near 4,054.
FUNDAMENTAL ANALYSIS
Gold is still balancing between safe-haven demand and the strength of the U.S. dollar. That keeps the broader tone cautious.
For now, the bigger driver is still technical structure. Price is at a clear decision point, so reaction matters more than prediction. If the support holds, gold can bounce. If it fails, sellers may quickly press lower.
TECHNICAL ANALYSIS – SMC + MARKET STRUCTURE
From a market structure perspective, gold is no longer showing a clean bullish recovery. The recent rally failed to sustain, and price has already started respecting lower highs.
The chart also shows that upside attempts were rejected near liquidity, while the intraday recovery area around 4,171 – 4,179 is now acting as a sell zone. That makes the current support around 4,121 the most important level on the chart.
This is why the setup feels strong and simple.
There are only two key reactions to watch:
* If 4,121 holds, price may bounce back into 4,171 – 4,179 and possibly extend toward the SMA 200 area.
* If 4,121 breaks, the structure becomes much weaker and the next downside draw may open toward 4,054.
That is the story here. One level. Two outcomes. Clear reaction needed.
KEY PRICE ZONES TO WATCH
Current price area: 4,121
Major decision zone / strong support: 4,121
Sell order zone: 4,171 – 4,179
Nearest recovery resistance: 4,179
SMA 200 resistance: 4,230
Liquidity rejection zone: 4,277
Strong liquidity target below: 4,054
Invalidation area for bearish breakdown: Back above 4,179
TRADING SCENARIOS
Buy Scenario – Only If 4,121 Holds
If gold defends 4,121 and prints a clear bullish reaction, I will watch for a rebound setup.
Buy Zone: Around 4,121
Entry Condition: Bullish rejection, liquidity sweep below support, or lower-timeframe bullish CHoCH.
Stop Loss: Below the recent sweep low or below the support invalidation.
Take Profit:
TP1: 4,171 – 4,179
TP2: 4,230
Sell Scenario – Priority If Breakdown Confirms
If gold breaks below 4,121 and confirms weakness, I will watch for bearish continuation toward the lower liquidity area.
Sell Zone: Below 4,121 after confirmation
Entry Condition: Clean breakdown, bearish retest, or strong bearish displacement below support.
Stop Loss: Above the broken level or above the nearest swing high.
Take Profit:
TP1: 4,054
TP2: Lower extension only if bearish momentum expands.
Alternative Sell Scenario
If gold bounces first into 4,171 – 4,179 and shows rejection, that area may offer a cleaner sell reaction.
Sell Condition: Bearish rejection, failed reclaim, or lower-timeframe bearish CHoCH from the sell zone.
Target: 4,121 then 4,054
MY VIEW ON GOLD
This is a high-attention chart because the market is sitting right on a major decision zone.
I do not want the middle of the move here. I only want the reaction.
As long as gold stays pressed against 4,121, this level remains the key. If buyers defend it, a rebound into 4,171 – 4,179 is possible. But if support gives way, the chart becomes much heavier and 4,054 starts to look like the next real draw.
For me, this is not a chart to overcomplicate. It is a chart to watch closely.
Do you think 4,121 will hold and trigger a rebound, or is 4,054 the next stop for gold?
Short 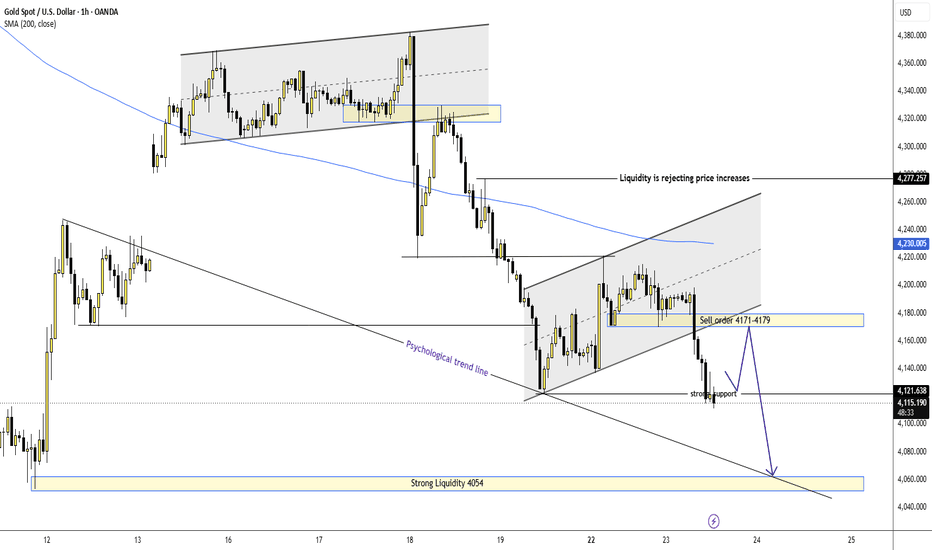
XAUUSD: Fed Hawks & War De-escalation Trigger 4HR Structure🧵 The Macro Shift: Connecting Yesterday's Relief to Today's Trend
In yesterday’s analysis, we mapped out a brief bullish relief rally for XAUUSD, which was heavily supported by a sharp plunge in crude oil prices. As energy costs temporarily fell, immediate market pressure eased, allowing gold to catch a minor bid and retest premium structural zones.
Today, however, the dynamic has completely flipped, and the primary bearish trend has resumed. Crude oil has stabilized, while two powerful fundamental catalysts have stepped in to drive institutional order flow:
Hawkish Fed & Rising Opportunity Cost (Gold Bias: Bearish)
Rumors of a potential interest rate hike by December have heavily repriced market expectations. Because gold pays no yield, the threat of "higher-for-longer" rates makes holding cash or buying the surging US Dollar much more attractive to big funds.
Geopolitical Premium Unwinding (Gold Bias: Bearish)
During periods of sudden global tension, institutions rush to buy gold as a "safe haven" because it has no counterparty risk, creating an artificially high price inflation known as a risk premium. Now, with reports of an unexpected 60-day preliminary ceasefire framework between the US and Iran, that immediate fear is leaving the market. When fear drops, institutional investors immediately pull their capital out of protective defensive assets like gold and reallocate those billions back into riskier, high-yielding assets. As this defensive demand completely dries up, it leaves a massive vacuum of buyers, causing XAUUSD to fall rapidly.
📉 Technical Convergence & Strategy
Liquidity Sweeps & Distribution (Gold Bias: Bearish)
This macro shift aligns perfectly with the 4-hour market structure. Yesterday's relief rally did exactly what it was supposed to do: it trapped early buyers and pulled price right into premium supply imbalances. With the buy-side liquidity officially swept at the recent structural highs, the path of least resistance remains heavily downward.
The Demand Zone Block ($4,054–$4,095) (Gold Bias: Short-Term Next/Bullish Bounce)
As price expands downward, the massive 4-hour POI demand zone sitting between $4,054 and $4,095 will act as key short-term structural support. Because major institutional buy orders rest here, expect a temporary demand reaction and a short-term bounce back from this block.
The Ultimate Target ($4,024) (Gold Bias: Medium-Term Bearish)
While the $4,054–$4,095 POI offers a temporary pit-stop, any short-term bounce is viewed purely as a lower-high sub-structure mitigation. The primary objective for this bearish expansion remains the major sell-side liquidity resting at the $4,024 swing low. We expect price to ultimately sweep this level once short-term demand is exhausted.
⚠️ Absolute Risk Warning
Disclaimer: This analysis is for educational purposes only and does not constitute financial advice. Geopolitical milestones and central bank decisions carry extreme financial risk. Protect your capital, monitor structural closes on the higher timeframes, and manage your risk defensively. XAUUSD — Medium-Term Buy Zone, Waiting For Liquidity Sweep
Gold is trading around $4,118 after rejecting from the short-term OB sell entry zone near $4,185–$4,198. Price has pulled back sharply, but the bigger focus is now shifting to the lower liquidity area.
From an SMC perspective, gold is moving toward a major demand zone where sell-side liquidity and the OB buy zone are sitting together. This area around $4,052–$4,085 is important because it was the origin of the previous bullish reaction and also sits above the strong low near $4,022.
The main plan is not to chase the current move. I prefer to wait for gold to sweep liquidity below $4,052, tap the OB buy zone, then look for bullish confirmation. If buyers defend this zone, gold can build a medium-term recovery back toward $4,198, $4,222, and higher FVG liquidity.
Buy setup 1
Condition:
Gold sweeps sell-side liquidity near $4,052 and reacts from the OB buy zone with bullish MSS / CHOCH confirmation.
Entry: $4,052–$4,085
SL: below $4,020
TP1: $4,118
TP2: $4,198
TP3: $4,222
Buy setup 2
Condition:
If gold holds the OB buy zone and breaks back above $4,198, wait for a retest before looking for continuation.
Entry: $4,185–$4,198 after breakout retest
SL: below $4,150
TP1: $4,222
TP2: $4,260
TP3: $4,285–$4,300
Sell setup
Condition:
Selling is not the priority. A sell setup is only valid if gold rejects again from $4,185–$4,198 and fails to reclaim the buy-side liquidity area.
Entry: $4,185–$4,198 after rejection
SL: above $4,222
TP1: $4,118
TP2: $4,085
TP3: $4,052
Key levels
Current price area: $4,118
OB buy zone: $4,052–$4,085
Strong low: $4,022
OB sell entry: $4,185–$4,198
Week high: $4,222
Upper FVG target: $4,260–$4,300
Bullish invalidation: clean 2H close below $4,020
My current view is that gold may create a stronger medium-term buy opportunity if price returns into the major OB and liquidity zone. The best Prime Gold plan is to wait for liquidity to be taken first, then enter only after bullish structure confirms.
No confirmation, no trade.
Long 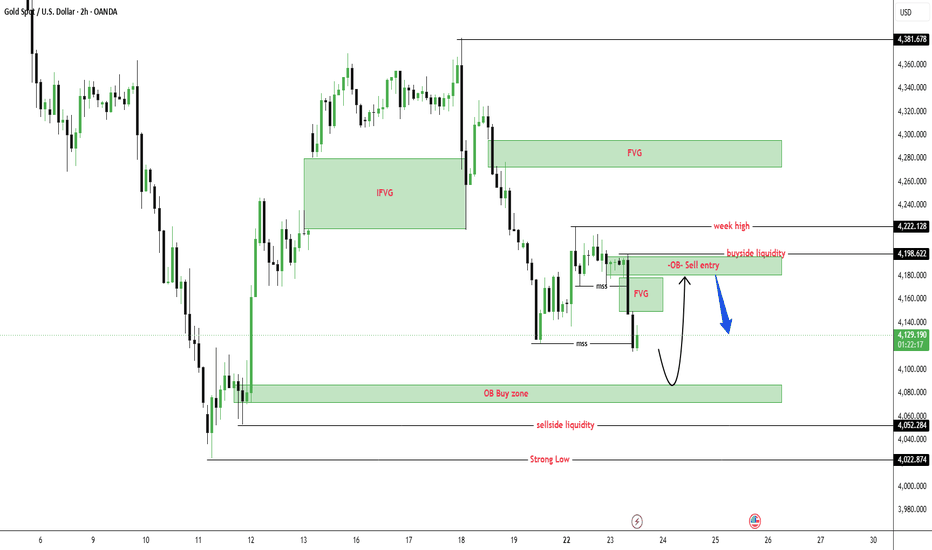
XAUUSD — Bearish Structure Continues, Liquidity Zones Remain Key
Gold is trading around $4,183 after failing to reclaim the day high near $4,221. Even with geopolitical tension still supporting volatility, the short-term structure remains bearish while price stays below the $4,194–$4,200 sell zone.
From an SMC perspective, gold has already rejected from the upper FVG area and continued to create lower structure. Price is now moving around a contested liquidity zone, where both buyers and sellers are active. This is why I do not want to chase price in the middle of the range.
The main sell reaction area is $4,194–$4,200. If gold retests this zone and shows rejection, sellers may continue to target sell-side liquidity around $4,137, then the deeper OB buy zone around $4,074–$4,078.
Sell setup 1
Condition:
Gold retests the $4,194–$4,200 sell zone and shows bearish rejection with lower-timeframe MSS / CHOCH.
Entry: $4,194–$4,200
SL: above $4,222
TP1: $4,160
TP2: $4,137
TP3: $4,078
Sell setup 2
Condition:
If gold breaks below $4,137 and retests it as resistance, bearish continuation remains valid.
Entry: below $4,137 after retest
SL: above $4,165
TP1: $4,100
TP2: $4,078
TP3: $4,052
Buy setup
Condition:
A buy setup is only considered if gold sweeps the $4,074–$4,078 OB buy zone and prints strong bullish rejection with lower-timeframe MSS / CHOCH. This is only a reaction setup, not the main trend.
Entry: $4,074–$4,078 after liquidity sweep
SL: below $4,052
TP1: $4,137
TP2: $4,160
TP3: $4,194
Key levels
Current price area: $4,183
Sell zone: $4,194–$4,200
Day high: $4,221
Sell-side liquidity: $4,137
OB buy zone: $4,074–$4,078
Bearish confirmation: clean break below $4,137
Bearish invalidation: clean 2H close above $4,222
My current view remains bearish while gold trades below $4,194–$4,200. Geopolitical tension can create sharp reactions, but the Prime Gold plan is still the same: wait for price to reach major contested liquidity zones, confirm structure, then execute with defined risk.
No confirmation, no trade.
Short 
THE CALM BEFORE THE STORM IN GOLD… BIG MOVE INCOMING!Whenever the majority of traders lose confidence in a particular direction—and it feels like the market has no strength left to continue—that’s often when a sharp and unexpected reversal happens. These moves catch most people off guard. I believe today could be one of those days. So let’s break down the likely direction and our plan of action for gold this Tuesday using market psychology and key institutional levels.
In my weekly analysis, I clearly mentioned the key support levels at **$4085** and **$4135**. The market is still respecting these zones, which shows they are strong institutional support levels. My plan has been simple: as long as gold holds above this zone, the focus is on trapping sellers.
On Monday, we did see an upside move, but there was no continuation. However, I had already mentioned that a sustained move wouldn’t come below **$4300** easily. The market would deliberately create a pullback to make traders believe it’s a retracement so they start selling. As you can see, overall price action and trend still look bearish, which is why many traders were waiting for pullbacks to sell—and they got that opportunity yesterday.
A lot of sellers have now entered the market because the retracement came from a publicly visible resistance area. That’s exactly why this looks like a trap. If you look at last week’s sharp fall on June 17, the low was around **$4220**. Yesterday, the market respected this level as resistance and moved down, forming a lower high structure—something that further convinced traders to sell.
The most important point is today’s opening below **$4200**. Monday also closed below **$4200**, so many traders likely entered sell positions near the close with stop losses above **$4200**. Even today, the market opened below **$4200** and didn’t hunt those stop losses yet. This strongly suggests that a large number of traders are currently in sell positions.
And that’s exactly why I believe the market is preparing to trap these sellers. An upside move is very likely in the coming hours.
This entire bullish plan remains valid as long as gold stays above **$4085**. I’m expecting a bigger upside target because both last week’s low and this Monday’s low have already been swept—indicating liquidity has been taken. Many traders are now randomly jumping into sell positions, and the market tends to move against the majority.
**Trading Plan:**
Liquidity sweep is already done, and I am already in a long position on gold. For a safer entry, you can wait for a **15-minute candle close above $4135**, and then look for strong buying opportunities.
Good luck to everyone—share your trading plan in the comments 👇
XAUUSD — EMA Downtrend Holds, Sell Position Remains Active
Fundamental Analysis
Gold remains under pressure as price continues to trade below the main EMA structure. Traders are still watching USD strength, Treasury yields, and upcoming U.S. macro data.
For now, the technical structure still favours sellers while recovery attempts are rejected from the value sell zone.
Technical Analysis
On the 1H chart, XAUUSD is trading below EMA 34, EMA 89, and EMA 200. The EMA structure is still pointing lower, showing that the short-term trend remains bearish.
Price recently tested the value range around 4,210 - 4,225 but failed to break higher. This rejection shows that buyers are still weak, while sellers continue to defend the EMA downtrend.
The order sell zone around 4,185 - 4,204 has also reacted well. After touching this area, price rejected and moved lower again, confirming that the sell zone is still valid.
As long as gold stays below 4,204 - 4,225, the bearish continuation setup remains active. The main downside target is the Fibonacci and liquidity convergence zone around 4,066.
Important Key Levels
Current price area: 4,177
Order sell zone: 4,185 - 4,204
Value range resistance: 4,210 - 4,225
EMA resistance area: 4,234 - 4,270
Short-term support: 4,140 - 4,120
Fibonacci liquidity target: 4,066 - 4,064
Invalidation area: above 4,225
Trading Scenario
Main Sell Scenario
Entry: 4,185 - 4,204
Stop Loss: 4,225
Take Profit 1: 4,140
Take Profit 2: 4,100
Take Profit 3: 4,066 - 4,064
Sell Condition
The preferred setup is to continue focusing on sell positions while price stays below the value range and EMA resistance.
The sell zone has already reacted well, showing rejection from 4,185 - 4,204. If price retests this area and forms another bearish rejection, the sell continuation setup remains valid.
A break below 4,140 would strengthen bearish momentum and open the way toward 4,100, then the Fibonacci liquidity target around 4,066 - 4,064.
Entry Conditions
Wait for price to stay below 4,204.
Look for bearish rejection on any retest.
A break below 4,140 confirms stronger downside pressure.
If price breaks and holds above 4,225, the sell setup is invalid.
Overall, the main view remains bearish while XAUUSD trades below EMA 34, EMA 89, EMA 200, and the value range resistance. The sell zone has already rejected price, so the preferred plan is to continue focusing on bearish continuation toward 4,140, 4,100, and 4,066.
Do you share the same bearish view on gold, or are you waiting for another retest of the order sell zone?
Short 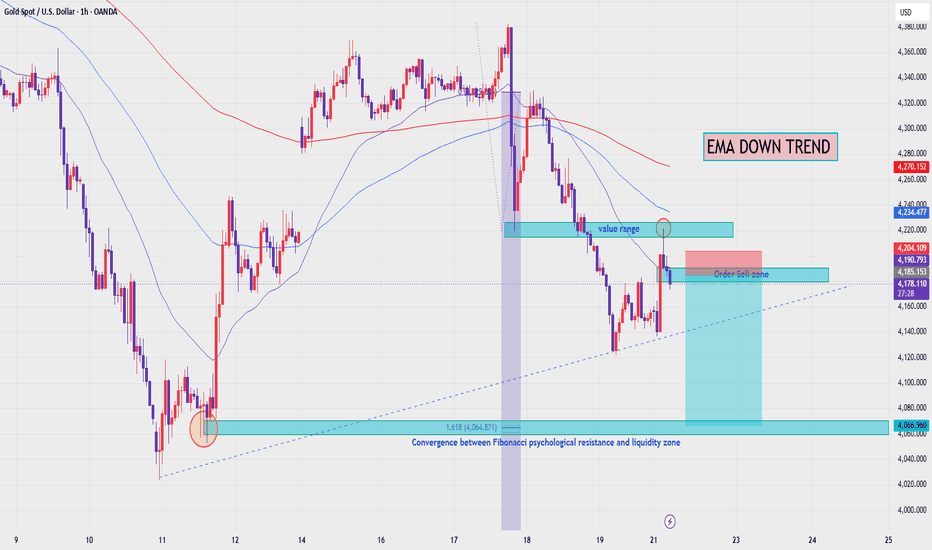
Gold Bounce Got Rejected again: Bear Is BackGold Bounce Got Rejected again: Bear Is Back, and the Demand Zone Is Now the Magnet
Yesterday the relief rally had to reclaim the supply overhead or it was nothing more than a reflex. Price pushed into the lower edge of that zone, printed a lower high, and got thrown straight back down. Today gold is red by more than a percent, trading near 4,140, and every single timeframe has flipped bearish again. The bounce is over. It did exactly what the chart said a bounce in this structure does: it sold into supply and handed control back to the bears.
Here is where it leaves us.
THE BOUNCE FAILED WHERE IT HAD TO
The supply band at 4,236 to 4,363 was the wall, and it held yesterday. On the four hour the change of character down has already printed, the lower high is in, the breakdown followed, and price is back beneath the levels the bounce briefly reclaimed. That is the definition of a fade, not a turn.
The structure dashboard tells the same story in one word: Full Bear. Both the daily and the four hour now read bearish across 15m, 1H, 4H, 1D and 1W. The fast timeframes that were green yesterday, the 15m and 1H, have rolled back over. When the bounce cannot even hold the timeframes that produced it, you have your answer. The path of least resistance is down again.
THE MAP NOW
Downside is where the action is. The immediate shelf is the four hour support around 4,125, sitting right beneath price, the first crack to watch. Below it, the daily support at 4059 is the floor that has held this entire move. Lose that and the market opens into the weekly demand zone at 4,059 down to 3,884. That zone is the one that matters. It is the high quality buy area, the place where the structural bid and the longer term trend that is still pointed up would be expected to defend, and it is the first level on this chart where a patient long actually earns an edge.
Upside, the levels are now overhead and proven. The four hour resistance at 4,201 is the first hurdle for any bounce attempt, then the same 4,236 to 4,363 supply that just rejected price, lining up with daily resistance at 4,331. The bears own everything between price and that band until it is reclaimed.
WHAT THE BULLS STILL NEED
Nothing has changed about the price of admission, except that today made it harder, not easier. A long here needs one of two things. Either price reaches the weekly demand at 4,059 to 3,884 and builds a reaction inside it, which is the patient, structural entry. Or price reclaims 4,363 and flips the daily structure to the upside, the first higher high after this run of lower ones. Today delivered the opposite of the second, a lower high and a rejection, so until the demand zone prints a reaction, buying this is catching a knife into a Full Bear tape with the macro pushing the same direction.
The trend is down, the bounce proved it, and the smart move is to let price come to the demand rather than guess at a bottom in the middle. Respect the level, not the hope.  Long
Long
XAGUSD: Downward Channel Remains Strong, Sellers Target 57,640The XAGUSD chart on the H4 timeframe is showing a clear picture: silver is still under medium-term downtrend pressure. After several attempts to recover but failing to break through the upper resistance zone, the price continues to be squeezed within the downtrend channel, reflecting that sellers still control the main market movement.
The most noteworthy point is the 66,499 zone. This is not only a near-term resistance, but also the intersection area between the upper edge of the downtrend channel, the Ichimoku zone above, and the price zone where a previous selling reaction occurred. In other words, if XAGUSD recovers to this area but fails to close strongly above, the market is very likely to form another price rejection.
Structurally, silver is still creating progressively weaker pullbacks. Each time the price approaches the resistance zone, the buying pressure lacks the necessary explosive force to reverse the trend. With the USD still supported and precious metals under pressure from high interest rate expectations, the current rallies in XAGUSD should be seen as areas to observe selling pressure rather than buy signals.
My preferred scenario is a technical rebound in XAGUSD to the 65.50 – 66.50 region, followed by a rejection signal at resistance and a continued decline along the main channel. If selling pressure persists, the next target could be 57.640, coinciding with the lower end of the current downtrend structure.
Reference strategy:
SELL: 65.50 – 66.50
SL: above 67.30
TP: 57.640 Short 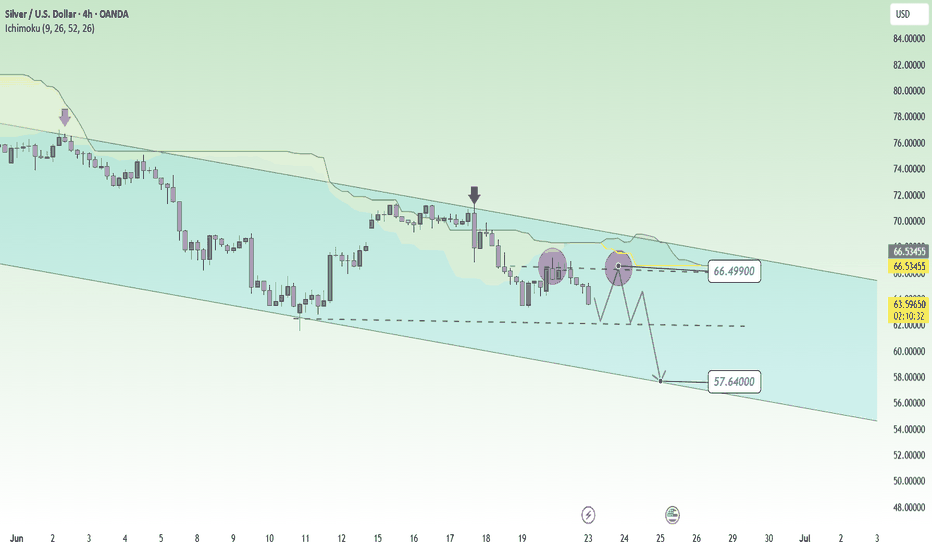
XAUUSD: Downward Trendline Remains a Barrier for BuyersOn the H4 timeframe, XAUUSD is trading around 4,151, after a sharp decline from the upper resistance zone. Although the price shows signs of a slight rebound, overall, gold has not yet escaped its main downtrend structure. The declining trendline continues to act as a "pressure ceiling," repeatedly blocking recovery attempts by buyers.
The key point lies at the 4,300 level. This is not only a technical resistance marked on the chart, but also a convergence point with the downward trendline and the Ichimoku zone above around 4,203-4,215. As long as the price remains below these resistance zones, the current rebound is not sufficient to confirm a reversal. Conversely, it could easily become a retest, allowing sellers to re-enter the market.
The news context also doesn't really support gold. The Fed maintains its hawkish stance, the USD remains supported, and expectations of higher interest rates continue to put pressure on non-yielding assets like XAUUSD. Therefore, the sensible strategy at this time is not to buy the dip, but to wait for the price to retrace to the resistance zone to look for a trend-following sell signal.
Preferred scenario: XAUUSD retraces to the 4,260 – 4,300 region, a rejection occurs at the trendline, then continues to fall to the 4,060 support zone.
Reference strategy:
SELL: 4,260 – 4,300
SL: above 4,335
TP: 4,060
As long as XAUUSD doesn't clearly break below 4,300, sellers remain in control of the main price movement. The 4,060 area will be a key target if selling pressure continues. Short 
GOLD: Deep Dive Into the $4,230 Supply ZoneBased on today’s market structure, XAUUSD is displaying a classic bearish continuation pattern after a brief corrective technical rebound.
The market recently corrected heavily from its all-time highs (near 5,500) down to the 4,020 psychological support area. Over the last 24 hours, easing geopolitical tensions regarding the US-Iran talks in Switzerland triggered a corrective bounce up into the 4,190–4,250 zone. However, the overarching higher-timeframe trend remains bearish, tightly capped by hawkish Fed rhetoric under Chair Kevin Warsh and a strengthening Dollar Index (DXY).
The strong possibility signals align with a Sell on Rally approach within a clear descending channel.
📉 Main Bearish Scenario (Higher Probability)
Order Type: Sell Limit / Sell Stop on intraday structural breakdown.
Premium Supply Zone (Entry): $4,225 – $4,250 (testing local descending channel resistance).
Invalidation / Stop Loss: Clean daily close above $4,280 – $4,300 (previous major structural support flipped to resistance/middle Bollinger band).
Targets (Take Profit):
TP1: $4,145 (Local internal liquidity sweep)
TP2: $4,060 – $4,020 (Major demand zone/recent swing lows)
📈 Alternative Bullish Scenario (Lower Probability)
Trigger: If buyers manage to push the price with heavy volume and consolidate cleanly above the $4,230 structural level.
Signal Change: This would invalidate the local bearish continuation and clear a path toward the next major liquidity pool at $4,315.
💡 Key Technical Cheat-Sheet
Order Block / Key Resistance: $4,230 & $4,300
Key Support / Liquidity Pools: $4,145 & $4,020
Trend Context: H4/D1 descending market structure. Intraday Stochastic is pushing overbought regions on the lower timeframes, indicating the recovery momentum is exhausting into supply.
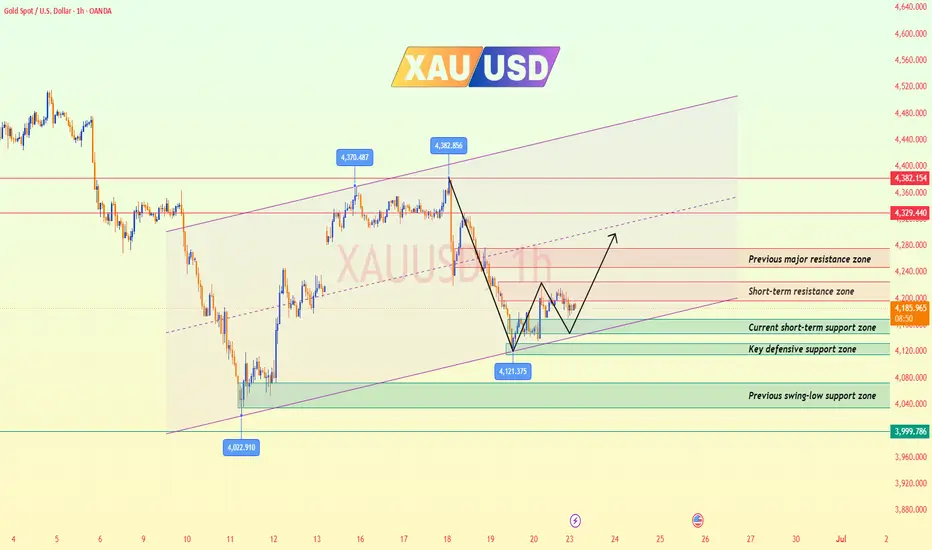
Gold Analysis & Trading Strategy | June 23🌐Hello traders! I’m Jack Blackwell, with 15 years of experience in analysis and trading in the futures and forex markets. Below are my technical analysis views based on the current XAUUSD (4H and 1H timeframes) chart structure.
✅ 4-Hour Trend Analysis
From the 4-hour chart, gold entered a clear correction phase after reaching a high of 4382 and remains within a broader corrective structure. Although the price found support around the 4120 area and staged a rebound, the recovery has been relatively weak. Gold is still trading below the 4-hour MA20, indicating that medium-term bearish pressure remains intact.
At this stage, the market appears to be undergoing a consolidation and recovery process following the recent decline rather than signaling a genuine trend reversal. Therefore, the broader outlook remains bearish.
✅ 1-Hour Trend Analysis
Looking at the 1-hour chart, gold has been consolidating within a range between 4160 and 4215 since rebounding from the 4121 area. Short-term moving averages have gradually flattened, while MACD momentum continues to weaken, suggesting that bulls and bears are currently in equilibrium and the market is awaiting a fresh directional catalyst.
In the short term, the 4200–4215 zone remains a key resistance area. If the price fails to break above this region decisively, sellers may regain control and push gold back toward the 4160 and potentially 4136 support levels.
On the other hand, if gold manages to establish itself above 4215, the rebound could extend further toward the 4250 area.
🔴 Key Resistance Levels
● 4200–4215 (Current primary resistance zone)
● 4250–4260 (Previous major resistance zone)
● 4297–4310 (Strong structural resistance zone)
🟢 Key Support Levels
● 4163–4156 (Current short-term support zone)
● 4136–4118 (Key defensive support zone)
● 4072–4035 (Previous swing-low support zone)
● 4000 (Major psychological support level)
📈 Trading Strategy Reference
🔰 Short Position Strategy (Sell the Rally)
👉 Sell Zone 1: 4200–4215
👉 Sell Zone 2: 4250–4260
🎯 Targets: 4163 → 4136 → 4118
📍 Rationale:
• The 4-hour MA20 continues to act as resistance.
• The broader market structure remains within a descending channel.
• Significant overhead supply and trapped long positions remain above 4200.
🔰 Long Position Strategy (Buy the Dip)
👉 Buy Zone 1: 4163–4156
👉 Buy Zone 2: 4136–4118
🎯 Targets: 4200 → 4215 → 4250
📍 Rationale:
• Price is currently trading near an important support zone.
• Support is present near the lower-middle section of the 4-hour Bollinger Bands.
• A confirmed stabilization with increased buying volume could trigger a technical rebound.
⚠️ Trend Outlook
👉 If gold breaks below 4136 and closes decisively beneath this level, bearish momentum could accelerate toward 4118, followed by 4072 and 4035.
👉 If the price breaks above and holds firmly above 4215, the short-term recovery could extend toward the 4250–4260 resistance zone.
👉 Based on the current 4-hour and 1-hour market structures, the broader trend remains bearish while the short-term outlook is characterized by consolidation. Traders should closely monitor the 4136 and 4215 levels, as a breakout from either side is likely to determine the next directional move.
🔔 Gold market conditions change rapidly, and seizing opportunities is essential!
If you feel confused or uncertain about the current market trend, you can follow our trading approach and gain access to real-time trading signals, professional strategy support, and in-depth market analysis. We are here to help you improve your trading efficiency, navigate the markets with greater confidence, and achieve more consistent and stable trading results. Short