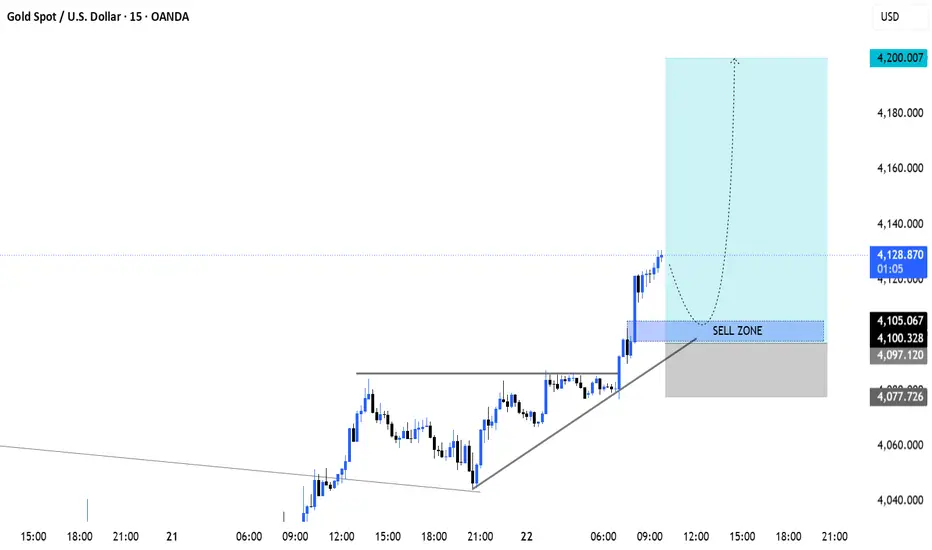
XAU/USD Holding Strong – Demand Zone Signals the Next Bullish 📊 Technical Analysis
The overall market structure remains bullish, with price consistently forming higher highs and higher lows after rebounding from the strong support zone. Each previous breakout was followed by a healthy retracement, allowing buyers to re-enter the market before continuing the upward trend.
The highlighted Demand Zone has once again proven its importance. After breaking above this area, Gold pulled back to retest it, where buyers stepped in aggressively. This successful retest strengthens the probability that the demand zone will continue acting as a launching pad for the next bullish wave.
The repeated Pivot Points shown on the chart indicate that every major correction has been followed by renewed buying pressure, suggesting that institutional participants continue to accumulate positions during pullbacks.
🔥 Bullish Signals
✅ Price is holding firmly above the key demand zone.
✅ Previous resistance has successfully flipped into support.
✅ Higher highs and higher lows confirm a healthy bullish trend.
✅ Strong buying reaction from every marked pivot point.
✅ Market structure favors trend continuation rather than reversal.
🎯 Potential Price Scenario
If Gold continues to hold above the highlighted demand zone, buyers are likely to regain momentum and push price toward the first target, followed by the second upside target marked on the chart. A clean breakout above the recent swing high would further confirm bullish continuation and could attract additional buying interest.
However, a decisive close below the demand zone would weaken the bullish outlook and may lead to a deeper correction before the next directional move.
⚠️ Risk Management
Even in a strong uptrend, disciplined trading is essential.
Wait for bullish confirmation before entering.
Place stop-loss orders below the demand zone or recent swing low.
Avoid chasing extended candles after sharp rallies.
Manage position size according to your trading plan.
💡 Conclusion
Gold is showing a textbook bullish structure, with buyers successfully defending a crucial demand zone after multiple breakout confirmations. As long as this support remains intact, the path of least resistance appears to be higher. A breakout above the recent high could pave the way for a fresh bullish leg toward the projected targets.  Long
Long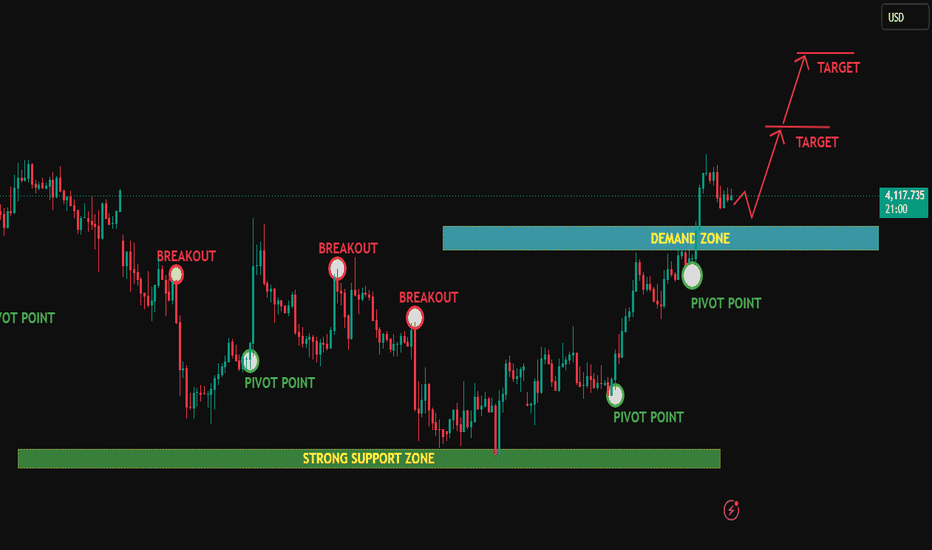
HDFC Bank Trades Near Lifetime HighsHighlights
* HDFC Bank continues to exhibit a strong technical structure, with the stock sustaining above all major moving averages following a steady post-merger recovery. The recent price action suggests sustained institutional accumulation and improving market confidence.
* The stock is currently trading near the **₹2,080–₹2,100** resistance zone. A decisive close above this range could confirm a fresh breakout and open the door for an advance towards **₹2,180–₹2,250** in the near term.
* On the downside, **₹2,000–₹2,020** serves as immediate support, while the **₹1,930–₹1,950** zone remains a strong medium-term demand area. Holding above these levels would keep the bullish outlook intact.
* Momentum indicators such as RSI and MACD remain firmly positive, while trading volumes have improved over the past few sessions, indicating continued participation from institutional investors.
* The stock has formed a higher-high and higher-low pattern on the daily chart and is consolidating just below its lifetime highs, suggesting that buyers remain in control despite intermittent profit booking.
* Improving deposit growth, stable asset quality, easing concerns around the merger integration, and expectations of stronger credit growth continue to provide a favorable fundamental backdrop for HDFC Bank's medium-term prospects.
Takeaway
HDFC Bank is displaying one of the strongest technical setups among large-cap private sector banks. A sustained move above **₹2,100** could accelerate buying momentum and push the stock towards the **₹2,180–₹2,250** zone. As long as HDFC Bank holds above the **₹2,000–₹2,020** support range, the technical bias remains firmly positive, making short-term pullbacks potential buying opportunities rather than indications of a trend reversal.
Bullish Breakout & Demand Zone Retest | High-Probability?🔍 Market Structure Analysis
The chart begins with a series of well-defined pivot points, where buyers repeatedly stepped into the market to defend price. Each successful defense created confidence among market participants while gradually weakening sellers.
As price approached resistance multiple times, every rejection became smaller than the previous one. This indicates that selling pressure was fading while buyers continued to absorb supply.
Eventually, the market gained enough momentum to break above the resistance, confirming a Bullish Break of Structure (BOS). This shift signals that market control has transitioned from sellers to buyers.
🟢 Pivot Points – The Foundation of the Trend
The highlighted pivot points represent the areas where institutional buyers entered the market.
Why are they important?
They reveal where demand consistently overwhelmed supply.
Every pivot created higher buying interest.
They established a sequence of higher reactions, proving buyers were becoming increasingly aggressive.
These zones served as the launching pads for the next bullish impulse.
Each pivot is evidence that the market respected support before preparing for the breakout.
🚀 Multiple Breakout Attempts – Building Pressure
Rather than breaking resistance immediately, the market tested it several times.
This behavior is extremely significant because:
Every breakout attempt consumed more sell orders.
Sellers gradually lost control.
Buyers continued accumulating positions.
Resistance weakened with every test.
When resistance was finally broken, it wasn't a random move—it was the result of sustained buying pressure built over time.
🔵 Demand Zone – The Institutional Entry Area
After the breakout, price returned to the highlighted Demand Zone.
This retest is one of the strongest confirmations in technical analysis because it demonstrates that:
Previous resistance has transformed into new support.
Institutions often revisit these areas to add positions.
Weak hands exit during the pullback.
Strong buyers defend the zone before continuing higher.
A successful retest confirms that the breakout is genuine rather than a false move.
📊 Price Action Psychology
The chart perfectly illustrates market psychology.
Stage 1: Buyers quietly accumulate near support.
Stage 2: Resistance is tested repeatedly, reducing selling pressure.
Stage 3: A strong breakout traps late sellers.
Stage 4: Price revisits the breakout area.
Stage 5: Buyers defend demand.
Stage 6: Momentum resumes toward higher targets.
This sequence reflects how professional traders build positions before major market moves.
🎯 Bullish Outlook
As long as price remains above the highlighted Demand Zone, the overall market structure remains bullish.
The current setup suggests:
✅ Buyers are defending higher prices.
✅ Market structure favors continuation.
✅ The breakout has already been confirmed.
✅ Demand remains intact.
If buying momentum continues, the market is likely to advance toward the projected target levels shown on the chart.
⚠️ Risk Management
Every trading setup has an invalidation point.
The bullish scenario remains valid only while price holds above the Demand Zone.
A decisive close below this zone would indicate:
Buyers are losing strength.
The breakout has failed.
Price may revisit the Strong Support Zone before another attempt higher.
Professional traders always protect capital by respecting invalidation levels.
💡 Key Takeaways
✔ Strong institutional support established the bullish foundation.
✔ Multiple breakout attempts weakened resistance.
✔ A confirmed Break of Structure shifted market control to buyers.
✔ The demand zone now acts as the primary buying area.
✔ A successful retest increases the probability of bullish continuation.
✔ Holding above demand keeps the path open toward higher targets. Long 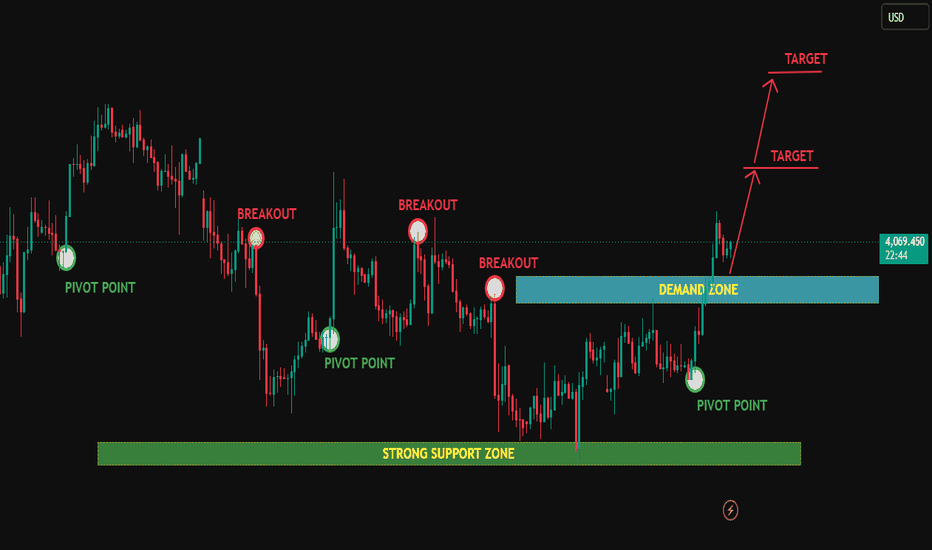
Long 
Gold - Technical And Quantitative Analysis CollaborationUpon zooming in on gold's chart on a 3-month timeframe, I made some very interesting observations........
Since 1970 - till 2026, I have identified 3 major bull runs in gold
- And every bull run has followed a rhythm.
- Each bull run lasts roughly 10 years.
- Each cycle inside the bull run expands close to +169%.
- And these inside cycles are compressing every decade
• The 1st bull run completed 3 full cycles.
• The 2nd bull run completed 2 cycles.
• The 3rd bull run (if it has topped) barely stretched to around 1.5 cycles.
• 3 → 2 → 1.5
Now the crucial point is that
- Each time a corrective trend is observed after the completion of every 10-year bull period
And the most interesting discovery of the analysis is that - the current bull cycle ends in Feb 2026
Logically speaking, if momentum compresses with every expansion, the exhaustion phase should arrive sooner.
Now technically, prices have breached the ascending wedge, made highs above 5200, testing resistance at fib ext 2.168 (5184), but still have not re-tested the wedge to confirm the pattern breakout.
Hence, to play out the pattern, gold could decline toward a major confluence zone:
• Convergence of the red trendlines of the ascending wedge
• Fibonacci 1.618 projection
• Major structural support
That zone sits near 3600.
If gold corrects toward that level, I believe it won’t be the end.
It could simply be the reset to begin the next 10-year spell. Short 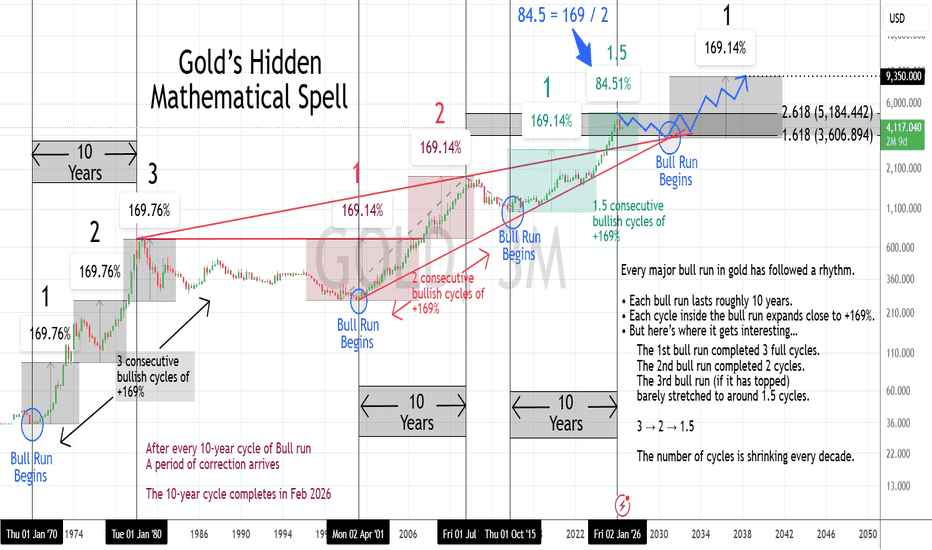
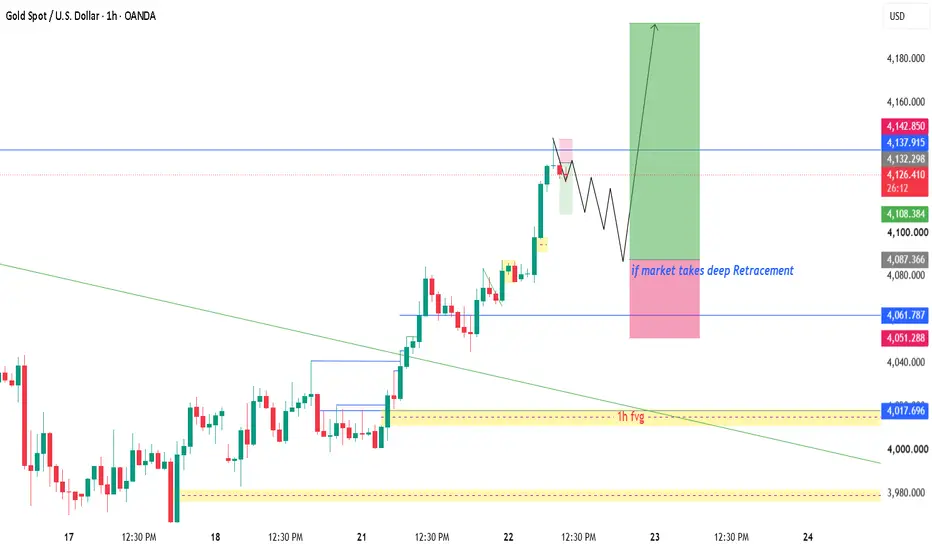
XAUUSD — Buy the Breakout RetestFundamental Analysis
Gold climbed to a two-week high as technical buying and renewed tensions in the Middle East boosted demand for safe-haven assets. However, the US Dollar remains close to a one-week high, while US Treasury yields continue to stay firm, which may restrict further upside ahead of the Federal Reserve's policy meeting on 28–29 July.
Technical Analysis
On the 1H chart, XAUUSD is trading around 4,124 after breaking above the descending channel and extending its rally towards the previous 4,130–4,140 swing high. The preferred buying area is 4,082–4,097, where the breakout structure aligns with the 0.382–0.5 Fibonacci retracement levels.
If the price retests this zone and holds with bullish confirmation, gold could reclaim 4,140 before extending towards the 4,175–4,180 target area.
Important Price Levels
Current Price: 4,124.13
Primary Buy Zone: 4,082–4,097
Short-term Support: 4,038–4,045
Short-term Resistance: 4,130–4,140
Liquidity Zone: 4,130–4,140
Primary Target: 4,175–4,180
Invalidation Level: Below 4,038
Trading Plan
Main Buy Setup
Entry: 4,082–4,097
Stop Loss: 4,038
Take Profit 1: 4,130
Take Profit 2: 4,140
Take Profit 3: 4,175–4,180
Buy Confirmation
Wait for a controlled pullback into the primary buy zone. A long lower wick, a bullish engulfing candle, a failed breakdown, or a 1H candle closing back above 4,097 may confirm renewed buying interest.
If the price breaks below 4,038 and sustains beneath that level, the bullish setup will no longer remain valid.
Overall Outlook
The 1H market structure remains bullish following the breakout above the descending channel. However, chasing the price near 4,130 may not offer an attractive risk-to-reward ratio. The preferred approach is to wait for confirmation around 4,082–4,097, with the expectation of a breakout above 4,140 and further upside towards 4,175–4,180.
What do you think? Will gold retest the primary buy zone first, or break straight above 4,140 and continue higher? Long 
# **XAU/USD (Gold) Technical Analysis ### **Market Structure**
Gold remains in a **strong bullish trend**, forming a sequence of **higher highs and higher lows** after reversing from the recent swing low. Buyers have regained control, and momentum is clearly favoring the upside.
The recent impulsive rally successfully **broke above a key resistance zone**, confirming a bullish market structure shift. Price is now consolidating after the breakout, which is a healthy sign before a potential continuation.
---
## **Key Technical Levels**
### 🟣 Support / Demand Zone
**4,076 – 4,084**
* Previous resistance has turned into support.
* This area is the highest-probability buying zone.
* A successful retest with bullish confirmation could trigger the next leg higher.
### 🔴 Immediate Resistance
**4,125 – 4,135**
* This is the recent swing high where sellers previously entered.
* A decisive break above this level would confirm continuation of the uptrend.
---
## **Trade Setup**
### ✅ Preferred Entry
* Wait for price to retrace into the **4,076–4,084 demand zone**.
* Enter only after a bullish rejection candle (Bullish Engulfing, Pin Bar, or Strong Momentum Candle).
### 🛑 Stop Loss
* Below **4,070** or beneath the recent swing low.
### 🎯 Take Profit Targets
* **TP1:** 4,120
* **TP2:** 4,135
* **TP3:** 4,150–4,170 (if bullish momentum remains strong)
---
## **Technical Confluence**
* ✔ Bullish market structure (Higher Highs & Higher Lows)
* ✔ Breakout above resistance
* ✔ Resistance turned into support
* ✔ Strong bullish momentum
* ✔ Healthy pullback expected before continuation
These confluences increase the probability of a successful **buy-on-retest** setup rather than chasing price at current levels.
---
## **Risk Management**
* Never buy after an extended rally without confirmation.
* Risk **1–2%** of account equity per trade.
* Wait for price action confirmation inside the demand zone.
* Maintain a minimum **Risk-to-Reward ratio of 1:2 or better**.
---
# **Professional Outlook**
The overall bias remains **bullish** as long as Gold holds above the **4,076–4,084 support zone**. A controlled pullback into this area is likely to attract fresh buyers and provide a higher-probability long opportunity. If buyers defend support and price breaks above **4,135**, the next bullish expansion toward **4,150–4,170** becomes increasingly likely.
**Bias:** 🟢 **Bullish**
**Strategy:** **Buy the Retest, Not the Breakout**
**Market Sentiment:** Buyers remain in control until the support zone is decisively broken.
Long 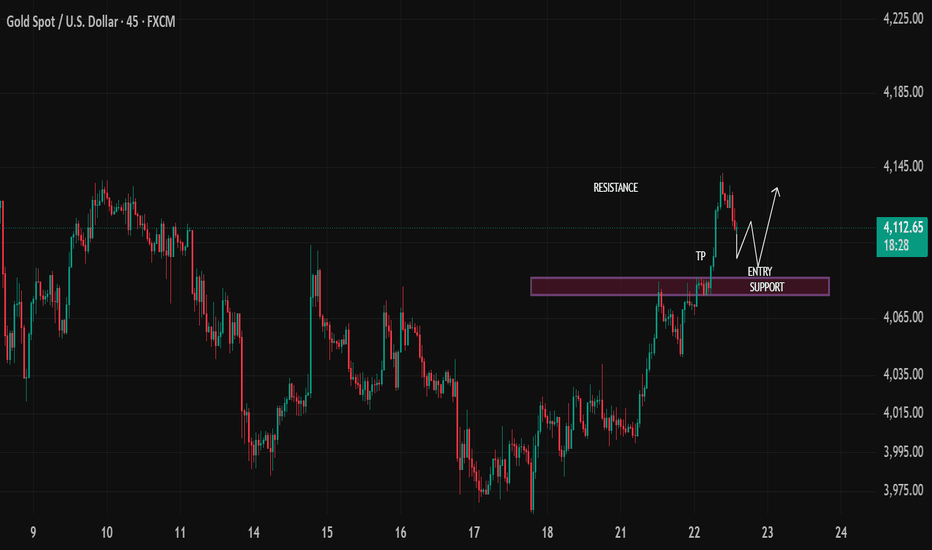
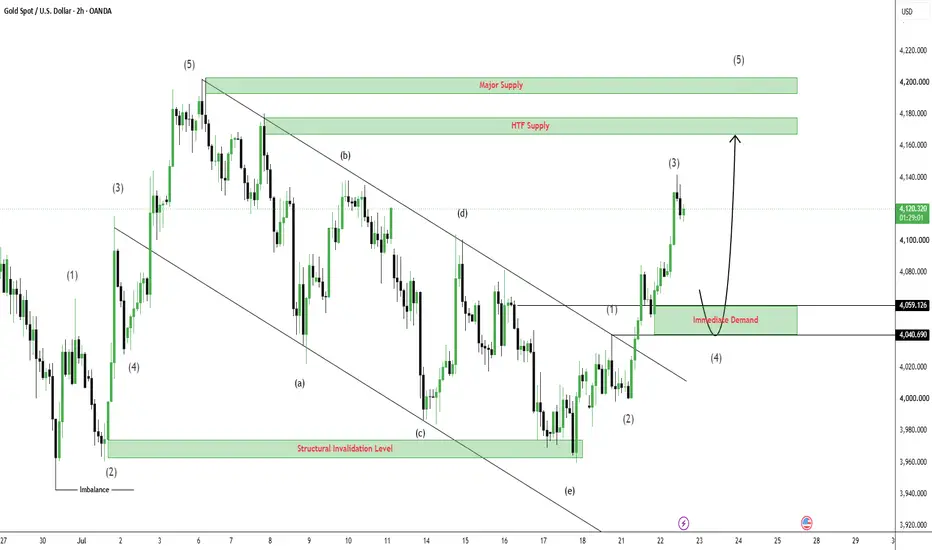
XAUUSD — Demand Retest Buy SetupGold is trading around $4,119 after breaking above the descending trendline and expanding strongly from the structural low near $3,960. The impulsive move confirms that buyers are controlling the short-term structure.
Price is currently extended after reaching the projected wave (3) area. The preferred opportunity is a controlled pullback into the Immediate Demand zone at $4,040.690–$4,059.126 before the next potential bullish expansion.
SMC View
The trendline breakout and strong displacement indicate a clear structural shift from correction into bullish continuation. The Immediate Demand zone represents the origin of the latest impulsive move and remains the main decision area for buyers.
Entering near the current price would mean chasing an extended move. A retracement into demand, followed by bullish rejection and a lower-timeframe MSS or CHOCH, would provide stronger confirmation that buyers remain in control.
Main Trading Scenario
Condition:
Gold pulls back into the $4,040.690–$4,059.126 Immediate Demand zone and forms a clear bullish rejection. A lower-timeframe bullish MSS or CHOCH is required before entry.
Entry: $4,040.690–$4,059.126 after bullish confirmation
SL: Below $4,040.690 and the reaction low
TP1: $4,130–$4,135
TP2: $4,168–$4,177
TP3: $4,193–$4,202
Key Zones to Watch
Current price: $4,119
Immediate Demand: $4,040.690–$4,059.126
HTF Supply: $4,168–$4,177
Major Supply: $4,193–$4,202
Invalidation: Acceptance below $4,040.690
Confirmation: Bullish rejection with MSS or CHOCH
Prime Gold View
The buy bias remains valid while Gold protects the $4,040.690–$4,059.126 Immediate Demand zone. The preferred plan is to wait for a confirmed pullback rather than chase the current expansion.
If buyers defend demand, price could continue toward the HTF Supply and potentially the Major Supply above. Acceptance below $4,040.690 would weaken the bullish setup.
No confirmation, no trade. Long 
Education 
XAUUSD — Bullish FVG Retest Setup
Market Context
Gold is trading around $4,063 after breaking the short-term structure and printing a bullish BOS above the $4,040 area. The recovery followed an earlier MSS from the lower boundary of the descending channel, showing that buyers are gaining control of the intraday structure.
Price is now approaching the old high liquidity at $4,073.649. Rather than chasing the current move, the cleaner opportunity would be a controlled pullback into the Bullish FVG around $4,020–$4,028, where displaced price action could provide support.
SMC View
The MSS marked the first shift away from the previous bearish sequence, while the recent BOS confirmed bullish continuation. The Bullish FVG below price is the main decision zone because it represents the imbalance created during the breakout.
A retracement into this area would allow price to rebalance before targeting the liquidity above. Buyer control should be confirmed through bullish rejection followed by a lower-timeframe MSS, CHOCH or a clean reclaim of the FVG.
Main Trading Scenario
Condition:
Gold pulls back into the $4,020–$4,028 Bullish FVG and forms a clear bullish rejection. A lower-timeframe bullish MSS or CHOCH is required before entry.
Entry: $4,020–$4,028 after bullish confirmation
SL: Below $4,000 and the FVG reaction low
TP1: $4,073.649
TP2: $4,103.844
TP3: $4,135.068
Key Zones to Watch
Current price: $4,063
Bullish FVG: $4,020–$4,028
Old high liquidity: $4,073.649
Internal high: $4,103.844
Main target: $4,135.068
Invalidation: Acceptance below $4,000
Confirmation: Bullish rejection with MSS or CHOCH
Prime Gold View
The buy bias remains valid while Gold holds above the Bullish FVG and maintains the recent BOS. The preferred plan is to wait for a pullback into $4,020–$4,028 rather than chase price near the first liquidity target.
If buyers defend the FVG, price could expand toward $4,073.649, followed by $4,103.844 and $4,135.068. Acceptance below $4,000 would weaken the current bullish setup.
No confirmation, no trade. Long 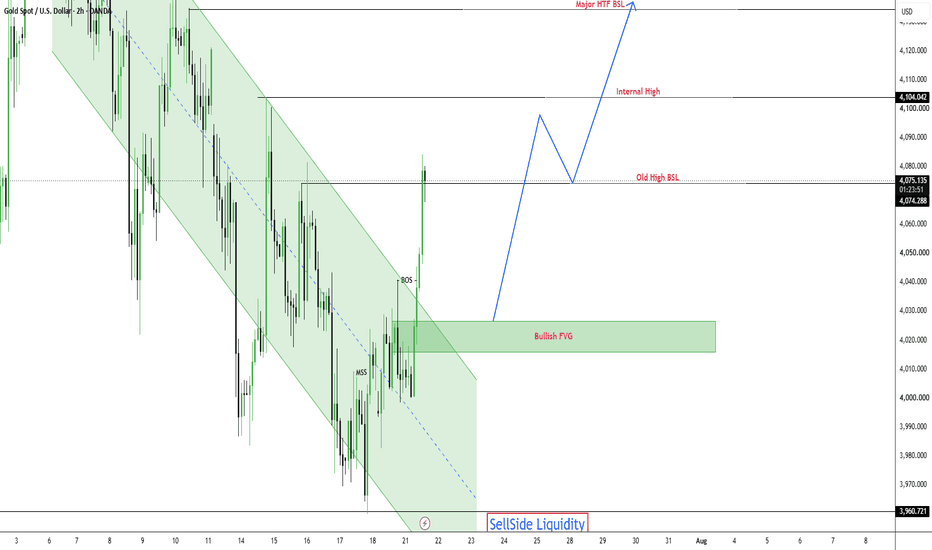
 Short
Short
XAUUSD – Gold Pushes Higher, But The FVG Retest Will Decide XAUUSD – Gold Pushes Higher, But The FVG Retest Will Decide The Next Move
Gold is showing a stronger bullish recovery after breaking above the previous descending trendline.
Price is currently trading around 4,129, after a clean upside move from the lower support area near 4,045. Buyers are clearly more active now, and the structure has shifted from defensive recovery into a stronger short-term bullish continuation.
However, gold is now approaching a sensitive area. After such a strong move, a pullback into the Buy Order FVG zone may be needed before the next push higher.
FUNDAMENTAL ANALYSIS
Gold is receiving follow-through buying as traders continue to watch U.S.–Iran developments and broader geopolitical risk.
At the same time, higher oil prices can keep inflation concerns alive, which may support expectations for a tighter Fed outlook and strengthen the U.S. dollar. This can limit gold’s upside in the short term.
For now, the fundamental picture is mixed, but the chart is showing stronger buyer control. The key is whether gold can hold the FVG support after the breakout.
TECHNICAL ANALYSIS – SMC + FIBONACCI
From an SMC perspective, gold has broken above the previous bearish trendline and created a strong bullish displacement. This is an important structural change because sellers are no longer controlling price the same way they did last week.
The current Buy Order FVG zone is around 4,102 – 4,116. This area is very important because it may act as the next support if price pulls back. As long as gold holds above this zone, buyers may continue to target the higher resistance area.
The nearest strong support sits around 4,045. This is the level that protected the previous move and helped create the current bullish recovery.
Above current price, the main target resistance is around 4,202 – 4,209. This area aligns with Fibonacci extension and previous resistance, making it the next major test for buyers.
KEY PRICE ZONES
Current price: 4,129
Buy Order FVG zone: 4,102 – 4,116
Strong support: 4,045
Near resistance: 4,140
Target resistance: 4,202 – 4,209
Fibonacci extension target: 4,209
Bullish structure valid: Above 4,102
Invalidation for bullish recovery: Below 4,045
TRADING SCENARIOS
Buy Scenario
Buy Zone: 4,102 – 4,116
Entry: Bullish reaction, FVG retest, liquidity sweep, or lower-timeframe CHoCH
SL: Below 4,102 or below the nearest swing low
TP1: 4,140
TP2: 4,202
TP3: 4,209
Breakout Buy
Condition: Break and hold above 4,140
Target: 4,202 – 4,209
Sell Scenario
Sell is not the priority while gold remains above the Buy Order FVG.
Sell Zone: 4,202 – 4,209
Entry: Bearish rejection, failed breakout, or lower-timeframe bearish CHoCH
TP1: 4,140
TP2: 4,116
Invalidation: If price breaks and holds above 4,209, the sell reaction idea becomes weaker.
MY VIEW
Gold is recovering with stronger momentum.
The breakout above the descending trendline is a positive sign for buyers, but I do not want to chase price too high after a strong move. The cleaner setup is to watch whether gold can retest and hold the 4,102 – 4,116 Buy Order FVG zone.
If this zone holds, the path toward 4,202 – 4,209 remains open.
If buyers fail to defend the FVG and price returns below 4,045, the bullish recovery becomes weaker.
For now, gold is showing strength — but the FVG retest will decide whether this move can continue.
Do you think gold will hold the 4,102 – 4,116 FVG and continue toward 4,209?
Long 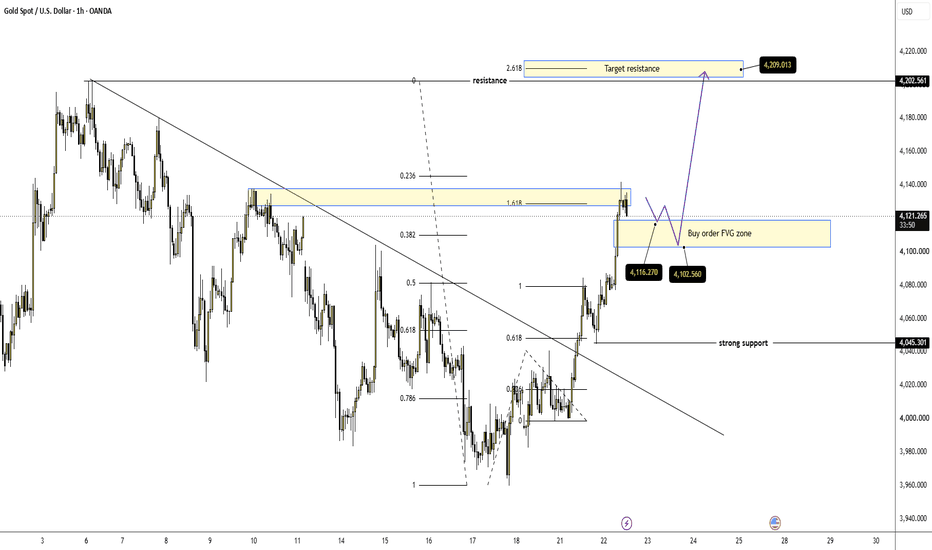
XAUUSD: Bullish Wave 5 may begin after pullback.Gold is showing a clear recovery structure after completing the previous bearish cycle near the lower area. From Kelly’s view, the chart is now shifting into a bullish Elliott sequence, but price may still need one corrective pullback before wave 5 continues higher.
The key idea is simple: gold is bullish in the short term, but the better setup may come from a clean retest of the buy zone, not from chasing the current push.
⟡ Market structure
The chart shows gold has reacted strongly from the lower base near 3,960 and created a sequence of higher lows. Price has already broken back above the descending pressure line, which is an important sign that sellers are losing control in the short-term structure.
Gold is now trading around 4,075 after a strong recovery move. However, price is approaching the 4,090–4,100 sell wave 4 zone, so a short correction from this area would be normal.
The main support to watch is the 4,040–4,050 buy zone wave 5. If gold pulls back into this area and buyers defend it, the next upside leg may continue towards the Fibonacci 2.618 target near 4,145–4,155.
➤ Key levels
◌ 4,040–4,050: buy zone wave 5 and key pullback area
◌ 4,075: current price reaction area
◌ 4,090–4,100: sell wave 4 / short-term resistance
◌ 4,138: previous Fibonacci reference zone
◌ 4,145–4,155: final wave 5 completion area
◌ Below 4,030: area where the bullish setup starts to weaken
◌ Below 4,000: area where the wave count needs reassessment
⌁ Elliott Wave view
From an Elliott Wave perspective, gold appears to be building a bullish 5-wave recovery after the previous bearish structure ended.
Wave 1 created the first upside reaction from the low.
Wave 2 corrected back but held above the base.
Wave 3 expanded strongly and pushed gold back above the broken trendline.
Wave 4 may now form as a controlled pullback into the 4,040–4,050 buy zone.
If that zone holds, wave 5 may begin and aim for the 4,145–4,155 completion area.
This is why Kelly would not chase the current price directly into resistance. The stronger setup is to wait for wave 4 to finish, then look for confirmation that wave 5 is starting.
▸ Trading scenario
Preferred scenario: wait for gold to pull back into the buy zone wave 5 and show bullish confirmation.
Entry zone: 4,040–4,050 if bullish confirmation appears
Stop loss: below the confirmed wave 4 low or below 4,030
Take profit 1: 4,090–4,100
Take profit 2: 4,138
Take profit 3: 4,145–4,155
Alternative scenario: if gold breaks above 4,100 without a pullback and holds strongly, price may continue directly towards the wave 5 target. In that case, a retest of 4,090–4,100 as support would become the cleaner continuation setup.
⌁ Kelly’s view
For Kelly, the bullish recovery structure is improving, but the market is now close to a short-term resistance zone. That means the best plan is patience.
If gold corrects into 4,040–4,050 and buyers defend the zone, the next wave 5 move may continue towards the higher Fibonacci target.
Gold is building a bullish Elliott structure.
A controlled pullback may prepare the next move higher.
Share your view below. Long 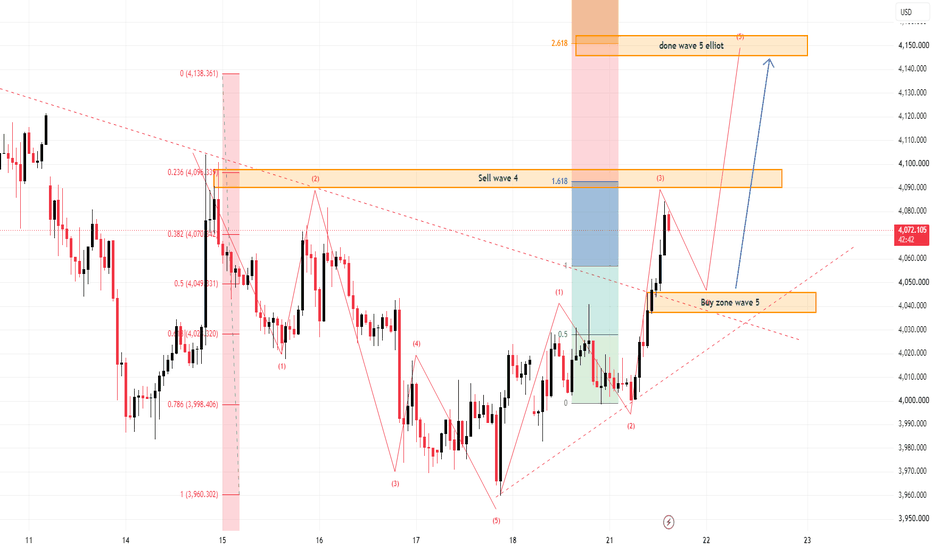
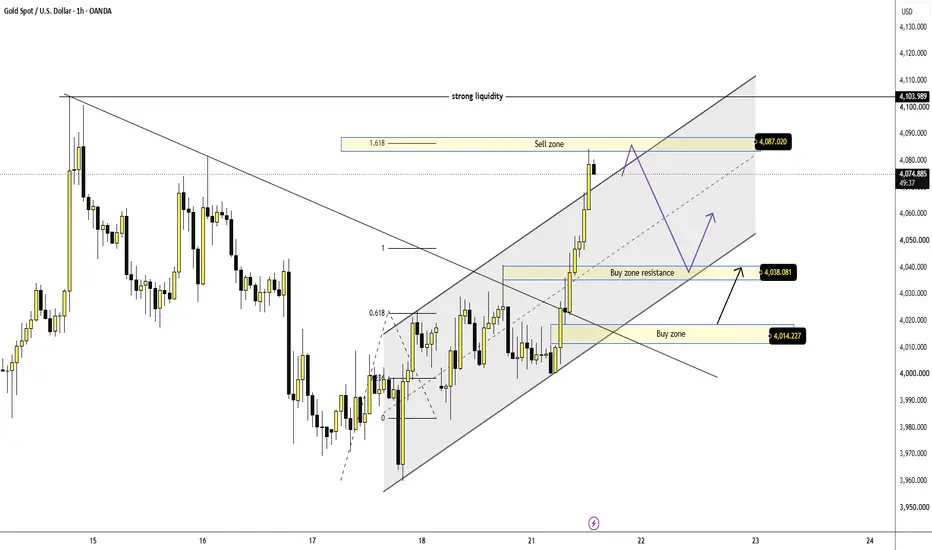
XAUUSD – Gold Rebounds Strongly, But 4,087 Is The First Test XAUUSD – Gold Rebounds Strongly, But 4,087 Is The First Test
Gold is showing a strong recovery from the lower buy zone.
After dropping close to the 4,000 area earlier, price reacted sharply from the 4,014 buy zone and is now trading around 4,077. This tells us that buyers are still active and the short-term structure has shifted into a cleaner recovery phase.
But the market is now moving into a sensitive area. Gold is approaching the 4,087 sell zone, and this is where sellers may try to react again.
FUNDAMENTAL ANALYSIS
Gold remains influenced by geopolitical tension and Fed expectations.
The recent U.S.–Iran headlines may keep safe-haven demand active, but rate expectations are still important. Traders currently see a low chance of a July rate hike, while the market still prices in the possibility of at least one hike later in the year.
This creates a mixed background: geopolitical risk may support gold, but a stronger USD or higher rate expectations can still limit upside.
TECHNICAL ANALYSIS – SMC + MARKET STRUCTURE
From an SMC perspective, gold has reacted strongly from the buy zone around 4,014 and created bullish displacement into the upper part of the short-term rising channel.
The first support zone is now 4,038. If price pulls back and holds above this area, buyers may attempt another push higher.
The key resistance is 4,087. This area sits near the 1.618 extension and is marked as a sell zone on the chart. If gold rejects from this level, a pullback toward 4,038 may appear.
Above 4,087, the next liquidity area is around 4,103. A clean break above 4,103 would make the bullish continuation stronger and open the path for higher movement inside the channel.
KEY PRICE ZONES
Current price: 4,077
Buy zone: 4,014
Buy zone resistance / support: 4,038
Sell zone: 4,087
Strong liquidity: 4,103
Channel support: 4,038 – 4,014
Bullish continuation above: 4,103
Invalidation for recovery view: Below 4,014
TRADING SCENARIOS
Buy Scenario
Buy Zone: 4,038 or 4,014
Entry: Bullish reaction, liquidity sweep, or lower-timeframe CHoCH
SL: Below 4,014
TP1: 4,087
TP2: 4,103
TP3: Higher channel resistance if momentum expands
Breakout Buy
Condition: Break and hold above 4,103
Target: Upper channel continuation
Sell Scenario
Sell Zone: 4,087
Entry: Bearish rejection, failed breakout, or lower-timeframe bearish CHoCH
SL: Above 4,103
TP1: 4,038
TP2: 4,014
Invalidation: If price breaks and holds above 4,103, the sell reaction idea becomes weaker.
MY VIEW
Gold is recovering well, but the next test is very close.
The reaction from 4,014 was strong, and buyers are now controlling the short-term move. However, the 4,087 – 4,103 area may decide whether this recovery continues or slows down.
For me, I prefer not to chase price directly into resistance. The cleaner plan is to wait for either a pullback into 4,038 for a buy reaction, or a breakout above 4,103 for continuation.
Gold is stronger today — but confirmation above 4,103 would make the recovery much cleaner.
Do you think gold can break above 4,103, or will sellers defend the 4,087 sell zone first?
Short 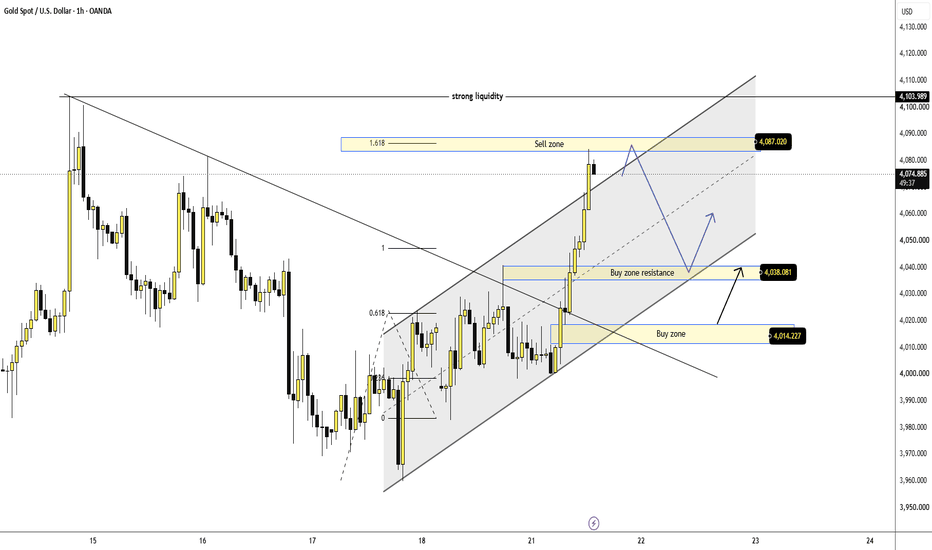
XAUUSD — Buy the Fibonacci PullbackFundamental Analysis
Gold gained more than 1% as markets assessed the possibility of a U.S.–Iran ceasefire and softer crude oil prices, which could reduce energy-driven inflationary pressure. However, firm US Treasury yields and renewed expectations of further Federal Reserve tightening may limit the upside ahead of the 28–29 July FOMC meeting.
Technical Analysis
On the 1H chart, XAUUSD is trading around 4,082.65 after breaking above the descending trendline and testing the immediate resistance near 4,078.67. Since the price has already made a strong upward move, the preferred strategy is to wait for a pullback into the 4,038.30–4,047.83 zone, where the 0.5–0.618 Fibonacci retracement levels coincide with the previous breakout support.
If buyers defend this zone with bullish confirmation, gold could retest 4,078–4,085 before extending towards 4,100 and eventually the 1.618 Fibonacci extension at 4,128.56.
Important Price Levels
Current Price: 4,082.65
Primary Buy Zone: 4,038.30–4,047.83
Short-term Support: 4,038.30–4,047.83
Short-term Resistance: 4,078.67–4,085
Liquidity Zone: 4,126.30–4,133
Primary Target: 4,128.56
Invalidation Level: Below 4,018.42
Trading Plan
Main Buy Setup
Entry: 4,038.30–4,047.83
Stop Loss: 4,018.42
Take Profit 1: 4,078.67
Take Profit 2: 4,100
Take Profit 3: 4,126.30–4,133
Buy Confirmation
Wait for the price to retrace into the primary buy zone and show clear bullish rejection. Confirmation may include a long lower wick, a bullish engulfing candle, a failed breakdown, or a 1H candle closing back above 4,047.83, signalling renewed buying interest.
If the price breaks below 4,018.42 and sustains beneath that level, the bullish setup will no longer be valid.
Overall Outlook
The short-term trend remains bullish following the breakout above the descending trendline. However, buying at the current price may not provide the best risk-to-reward opportunity. Waiting for a healthy pullback into the 4,038.30–4,047.83 demand zone offers a more favourable buying opportunity, with 4,128.56 remaining the primary upside target. This area may also attract profit booking and trigger a temporary bearish reaction.
Do you think gold will revisit the primary buy zone first, or continue its rally straight towards the 1.618 Fibonacci extension target? Long 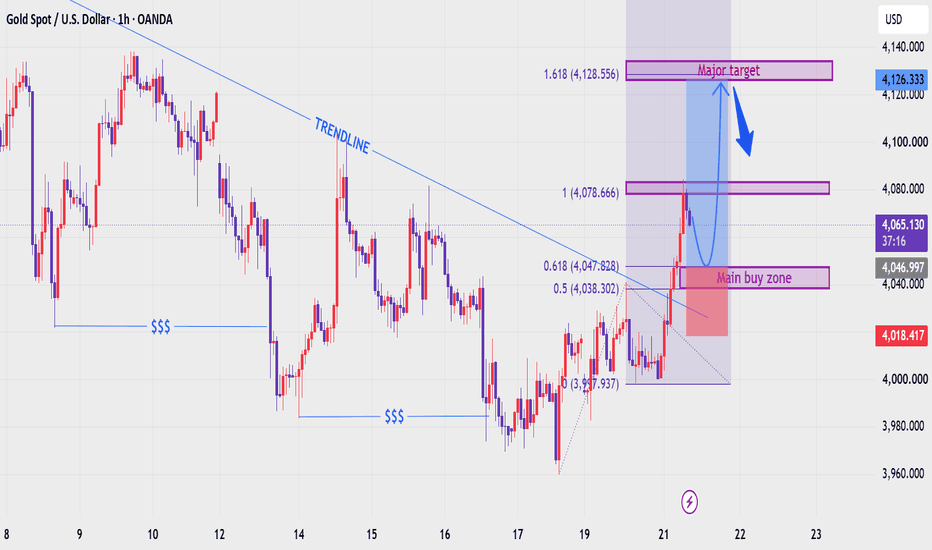
Long 
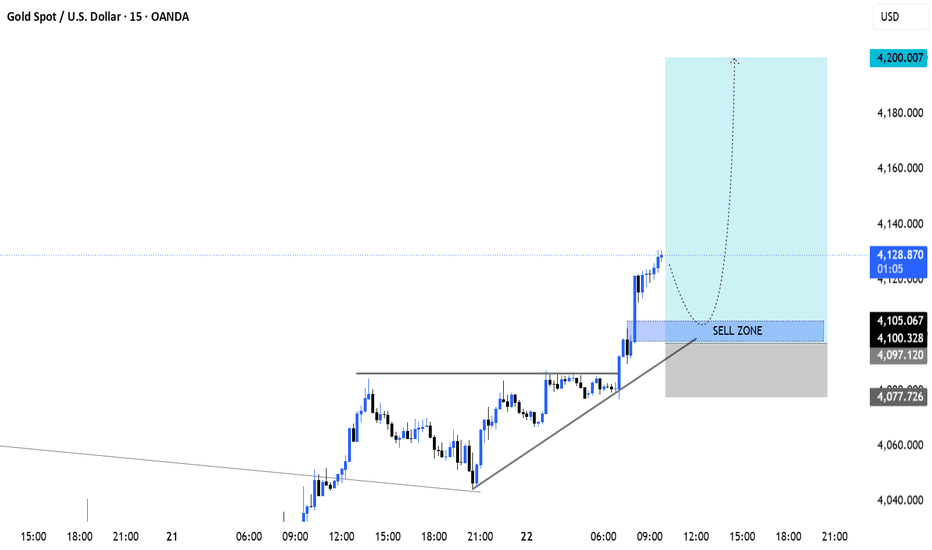
XAUUSD – H4 Breakout Pullback Setup
Gold is currently trading around 4,130 after breaking above the descending channel. The H4 market structure has turned bullish, but price is now approaching a key resistance area. Chasing the current move may not offer a favourable risk-to-reward ratio.
The preferred strategy is to wait for a pullback into the breakout zone before looking for fresh buying opportunities.
Technical Outlook
The 4,032–4,048 Fair Value Gap (FVG) is the primary buying zone. This area coincides with the previous channel resistance, which is expected to act as support if the breakout remains valid.
A bullish rejection, liquidity sweep, or a higher-low formation from this zone could trigger the next upward move towards 4,140–4,152, followed by 4,188–4,202.
If Gold manages to close and sustain above 4,202, the next upside target could be the 4,290–4,305 resistance zone.
Key Levels
📍 Current Price: 4,130
🟢 Main Buying Zone: 4,032–4,048
🔴 Immediate Resistance: 4,140–4,152
🔴 Major Resistance: 4,188–4,202
🎯 Final Target: 4,290–4,305
❌ Invalidation: Below 4,020
Trading Plan
Buy Zone: 4,032–4,048
Entry Confirmation:
H4 pullback into the FVG
Bullish rejection candle
Liquidity sweep with a strong reclaim
Higher-low confirmation
Stop Loss: Below 4,020
Take Profit 1: 4,140–4,152
Take Profit 2: 4,188–4,202
Take Profit 3: 4,290–4,305
Important Note
Avoid buying if Gold rallies straight above 4,152 without a pullback. Waiting for a proper retest usually offers a much safer entry with a better risk-to-reward ratio.
The 4,188–4,202 resistance zone could attract profit booking before the next bullish leg begins.
Final Outlook
As long as Gold remains above the broken descending channel, the overall outlook stays bullish.
The ideal setup is to wait for a pullback into the 4,032–4,048 FVG, targeting 4,200 initially and 4,290–4,305 if bullish momentum continues.
💬 What do you think? Will Gold revisit the FVG before the next rally, or will buyers push the price directly towards 4,200? Long 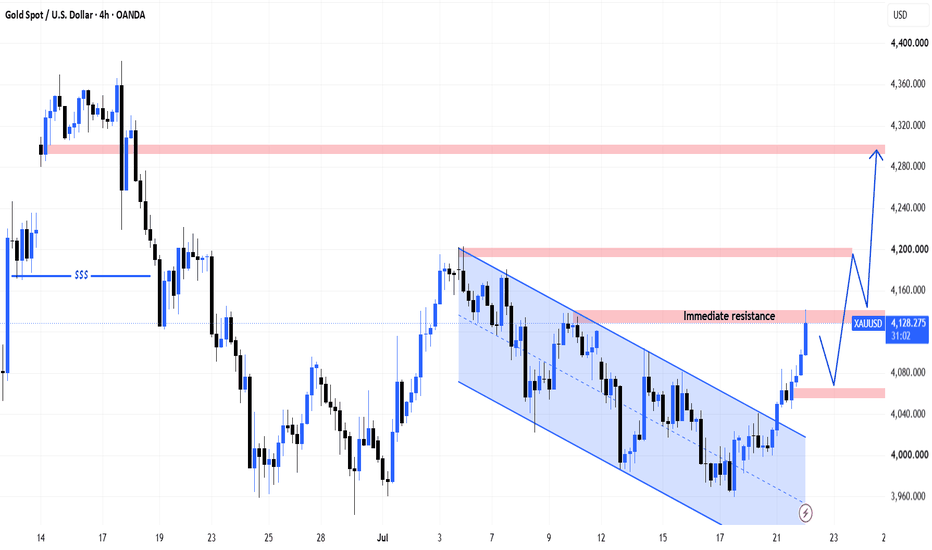
XAUUSD 4000 trap — 4134 liquidity waiting XAUUSD 4000 trap — 4134 liquidity waiting
That 4,000 dip still looks like bait to me.
Gold got pushed lower in Asia, tapped the messy support area, then started climbing again from around 3,966. Not clean. Not beautiful. But that is exactly how these traps usually start.
Sellers had the breakdown. They had the panic. Then price stopped bleeding.
Now gold is pressing back toward 4,033 and the next real problem zone is 4,058 - 4,078. That Order Block + liquidity area is sitting right above price. If buyers reclaim it clean, shorts can get squeezed fast.
Macro is mixed, yeah. US-Iran tension keeps the market nervous, USD still has safe-haven support, and Fed expectations are not fully soft. So I’m not calling this a full bullish reversal.
This is a recovery leg. A liquidity run.
Main bias is bullish short-term while 3,966 holds.
The play is simple. Price needs to hold above 4,000 - 4,007 and keep building. If gold breaks through 4,033, then 4,058 becomes the first draw. Above that, 4,078 opens the door toward 4,103 and maybe 4,134 if momentum actually expands.
Trading scenario:
Buy idea only if gold holds above 4,000 - 4,007 and reclaims 4,033 with clean candles.
Entry zone: 4,007 - 4,033 after confirmation
Stop loss: below 3,966
TP1: 4,058
TP2: 4,078
TP3: 4,103
Final target: 4,134
No reclaim above 4,033, no chase. Simple.
If gold closes hard below 3,966, this bounce idea is dead. Then sellers take control again and the recovery turns into another failed trap.
For now, I’m watching 4,033 first, then the 4,058 - 4,078 squeeze zone.
You think gold runs 4,134 before sellers reload?
Long 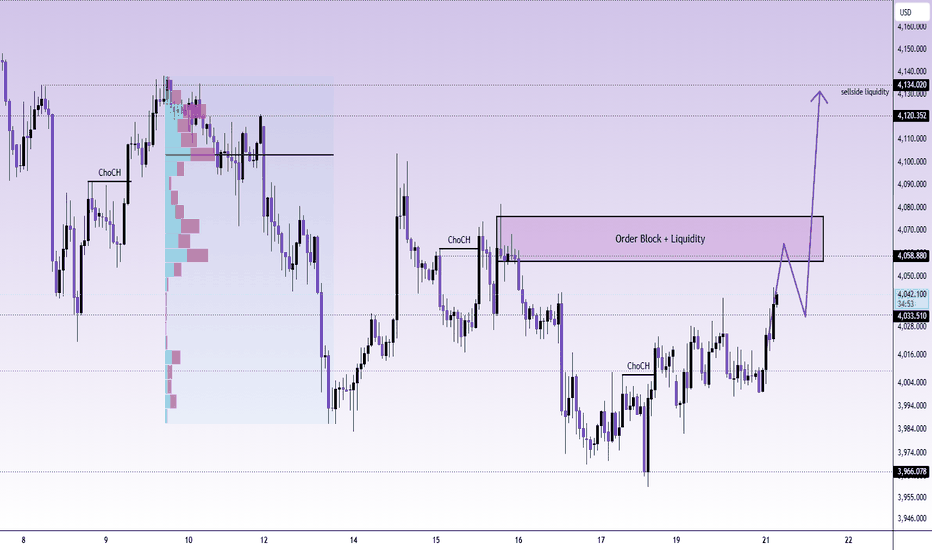
Long 
 Long
Long
Long