XAUUSD: Weekly bearish aims for final wave 5 zoneGold is still trading inside a broader bearish structure, and the weekly outlook continues to favor downside continuation. From Kelly’s view, the latest recovery looks more like a corrective rebound into resistance, while the main Elliott structure still suggests that wave 5 may extend lower.
The key idea is simple: as long as gold remains below the descending trendline and the sell wave B zone, the bearish weekly scenario stays active.
⟡ Market structure
The chart shows gold has been respecting a clear descending trendline, with repeated lower highs forming across the structure. Each recovery attempt has been capped under resistance, showing that buyers still lack strong control.
Price recently tested the lower support around 3,955–3,970 and bounced slightly, but the rebound is still weak. The nearest sell area is around 4,017–4,025, where the chart marks the sell wave B zone.
If gold retests this zone and fails to break above it, sellers may continue pushing price lower towards the final Elliott wave target near 3,845–3,855.
➤ Key levels
◌ 3,955–3,970: recent low and done test area
◌ 4,017–4,025: sell wave B zone and short-term resistance
◌ 4,050–4,075: higher resistance if the rebound expands
◌ 3,845–3,855: final wave 5 target area
◌ Above 4,075: area where the bearish weekly setup starts to weaken
⌁ Elliott Wave view
From an Elliott Wave perspective, gold appears to be developing the final bearish phase of a larger 5-wave decline.
Wave 1 started from the upper structure.
Wave 2 formed a corrective rebound but failed below trendline resistance.
Wave 3 pushed price lower with stronger bearish pressure.
Wave 4 may now be forming as a small recovery into the sell wave B zone.
If this resistance holds, wave 5 may continue lower towards the 1.618 Fibonacci extension area near 3,845–3,855.
This is why Kelly would not treat the current bounce as a full reversal yet. The market is still below the descending trendline, and the structure continues to favor sell reactions from resistance.
▸ Trading scenario
Preferred scenario: wait for gold to retest the 4,017–4,025 sell zone and show bearish confirmation.
Sell zone: 4,017–4,025 if rejection appears
Stop loss: above the confirmed rejection high or above 4,075
Take profit 1: 3,955–3,970
Take profit 2: 3,900
Take profit 3: 3,845–3,855
Alternative scenario: if gold breaks above 4,075 and holds with strong acceptance, the bearish wave 5 setup weakens. In that case, the market may shift into a larger corrective recovery before the next weekly direction becomes clear.
⌁ Kelly’s view
For Kelly, the weekly structure still favors selling the rebound. Gold has reacted from support, but the bounce remains corrective while price stays below the sell wave B zone and the descending trendline.
The cleaner plan is not to chase the low. Wait for price to retest resistance, then watch whether sellers defend the structure.
Gold may still have one more bearish leg ahead.
If the sell zone holds, the final wave 5 target remains open for next week.
Share your view below.  Short
Short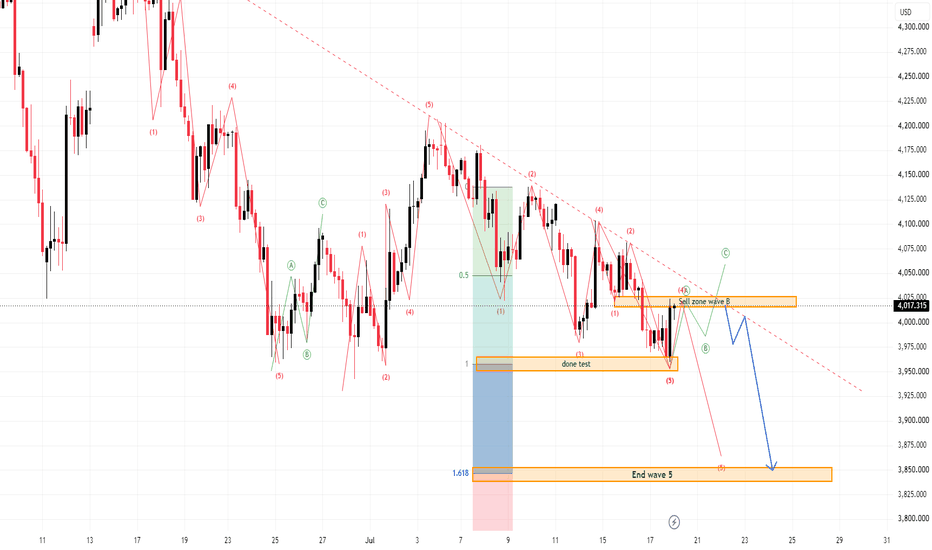
Short 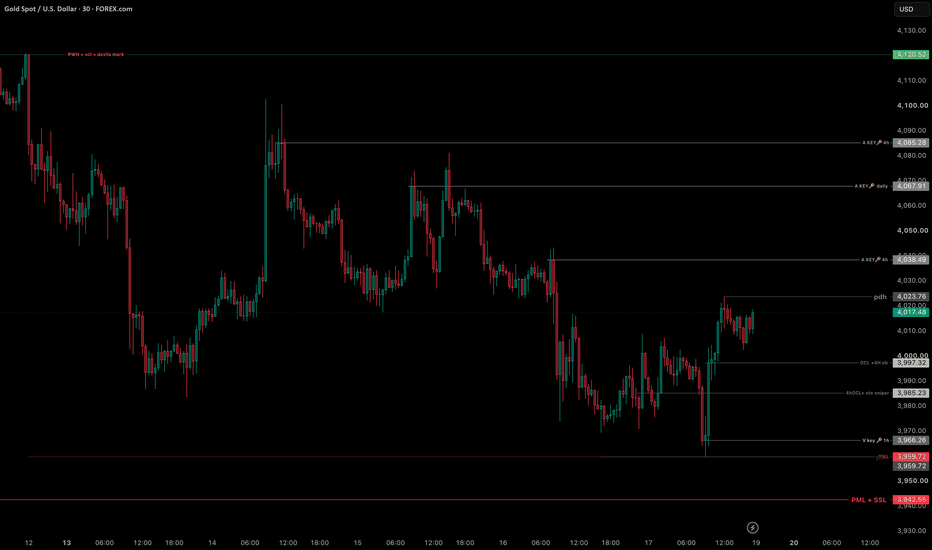
Short 
Short 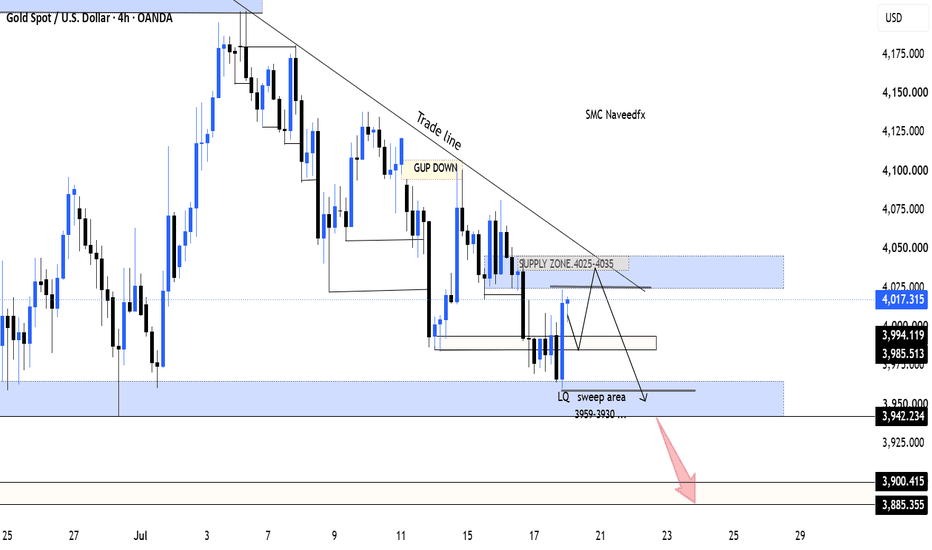
WTI Crude: The Hormuz Premium Is BackWTI Crude Oil (4H) | Bias: Bullish while the war premium holds — but headline risk cuts both ways | Key driver: US–Iran conflict
The Setup
This chart tells one story: war. WTI round-tripped from the low-$80s in mid-June down to ~$68 by early July, then ripped back to ~$82 in about two weeks — a near-20-point round trip in five weeks, on a 4H chart that's basically been trading Strait of Hormuz headlines rather than fundamentals. The pullback in the middle of that recovery held almost exactly at the 61.8% Fibonacci retracement before buyers took control again. This is a geopolitical tape right now, not a technical one, and it needs to be read that way.
🔍 Technical Read
Structure: Sharp decline (~$82 → ~$68) into early July, followed by an impulsive V-recovery back to current levels near $81–82.
The key technical tell: the corrective pullback after the first bounce off the lows found support almost exactly at the 61.8% retracement (~$71), right inside the $70.60–$71.90 zone that's been defended more than once. Textbook trend-continuation behavior.
Current position: price is testing the recent swing high (~$83), right at the top of the post-recovery range.
Momentum: daily technical/moving-average models are flashing a "Strong Buy" read, consistent with the strength of this move.
What would change the picture: a clean break and close back below the $71–72 zone undoes the bullish structure and re-opens the $68–69 lows.
📰 Fundamental Backdrop
The war is the whole trade right now:
The conflict: The US–Iran war broke out February 28, 2026, and has flared, cooled, and flared again since. The current leg is acute, the US has struck Iran for six consecutive days (surveillance, air-defense, and logistics targets, including the Chah Bahar port surveillance tower), Iran has hit back at US-linked targets in Kuwait, Jordan, and Bahrain, and Washington has reinstated a naval blockade on Iranian shipping.
Why WTI cares : roughly a fifth of the world's seaborne crude moves through the Strait of Hormuz. Tanker traffic through it has collapsed since the latest escalation, and that supply-disruption fear, not demand or inventories, is what's driving this chart.
The dip to $68 explained: in late June/early July, a partial de-escalation let Hormuz traffic start recovering, and oil fell back toward pre-war-resumption levels. OPEC+'s seven core members even used that calmer window to approve another 188,000 bpd output increase for August. Days later, the ceasefire collapsed and the rally back to $82 began.
OPEC+'s response is mostly symbolic. The group has raised output targets for five straight months, but Saudi Arabia, Iraq, and Kuwait, three of the seven core members — all rely on the Strait for exports. Raising quotas while the chokepoint is disrupted doesn't add real barrels to the market; it's positioning for whenever the strait normalizes.
No ceasefire in sight. Negotiations have stalled, and Washington has signaled talks aren't the near-term priority, with some reporting suggesting US operations could expand further.
🎯 Levels That Matter
Resistance / current test zone: $82 – $83
Bullish structure support: $71 – $72 (61.8% Fib + defended demand zone)
Invalidation for the bull case: sustained close below $71
Deeper support if that breaks: $68 – $69
📅 Catalyst Watch
This is a headline-risk market, not a data-calendar one:
Escalation risk (bullish for price): a confirmed tanker loss, a formal Hormuz closure attempt, or a strike on major energy infrastructure.
De-escalation risk (bearish for price): any credible ceasefire signal — we've already seen how fast that can send price back toward $68–69.
Weekly EIA inventory data is still on the calendar, but right now it's background noise next to the war headlines.
💭 My Take
Respect the trend while it's intact, the tape is bullish and the $71–72 zone has done its job twice now. But this isn't a "set and forget" trade. A single ceasefire headline erased a $14 rally once already this cycle, and it can do it again. Smaller size, wider stops, and a plan for both directions matter more here than picking a side.
Not financial advice. posted for discussion and educational purposes. Headline-driven markets move fast in both directions; manage risk accordingly.
 Long
Long
Long 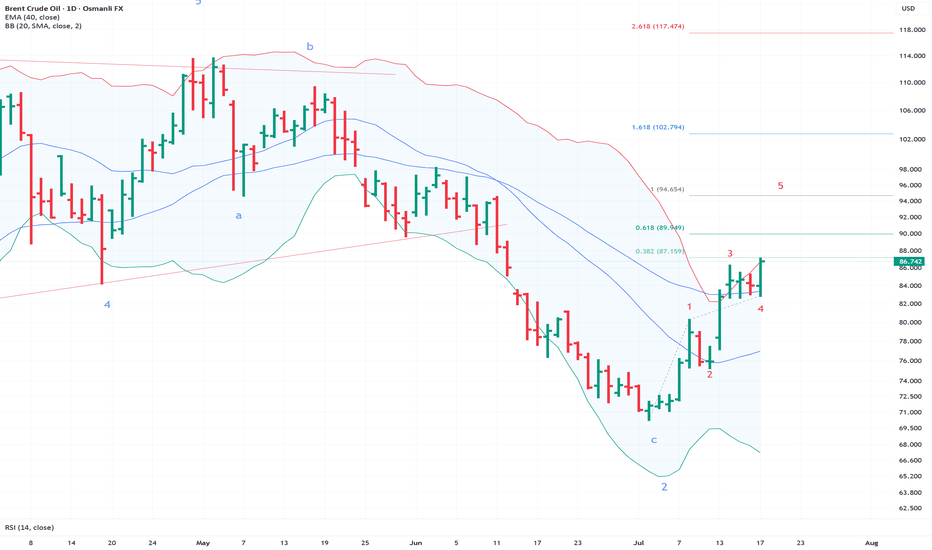
XAUUSD — 3,960 Is the Liquidity Pool XAUUSD — 3,960 Is the Liquidity Pool
Gold is sitting in a very important part of the chart now, and this is the kind of area where the market usually tries to confuse both sides before the real move appears.
Price has been moving lower for several weeks, printing weaker structure after each recovery. Every time buyers tried to push back, gold failed to reclaim the higher liquidity zones around 4,180 - 4,200, then slowly drifted back toward the lower range. That tells me the bigger pressure is still heavy, but the current location is not a place where I want to chase the sell too late.
The main story here is the liquidity pool around 3,940 - 3,970. Price has already travelled deep into discount, and this lower zone is where sell-side liquidity has been building for a long time. For newer traders, think of it like a pool under the market: once price comes close, it often wants to dip into it, collect liquidity, and then breathe back upward before deciding the next bigger direction.
That is why my short-term view is leaning bullish from the liquidity pool, as long as gold holds above 3,940 - 3,960. If buyers can defend this zone, the next area price may try to revisit is the POI around 4,080 - 4,110. That is where I would expect the real test. If gold reaches that zone and reacts weakly, sellers may step back in again.
This recovery idea becomes weak if gold breaks below 3,940 and cannot recover. In that case, the liquidity pool fails, and the market may continue searching for deeper downside.
Key price zones to watch
Current reaction area: 3,960 - 4,020
Main demand / liquidity pool: 3,940 - 3,970
Bullish confirmation zone: clean hold above 4,020
Main upside POI target: 4,080 - 4,110
Next upside liquidity zone: 4,180 - 4,210
Buy-side liquidity: 4,320 - 4,360
Lower support if buyers fail: 3,940
Invalidation: clean close below 3,940
Do you see this 3,960 area as the place where gold starts a recovery, or do you think the market still needs one deeper sweep first?
Short 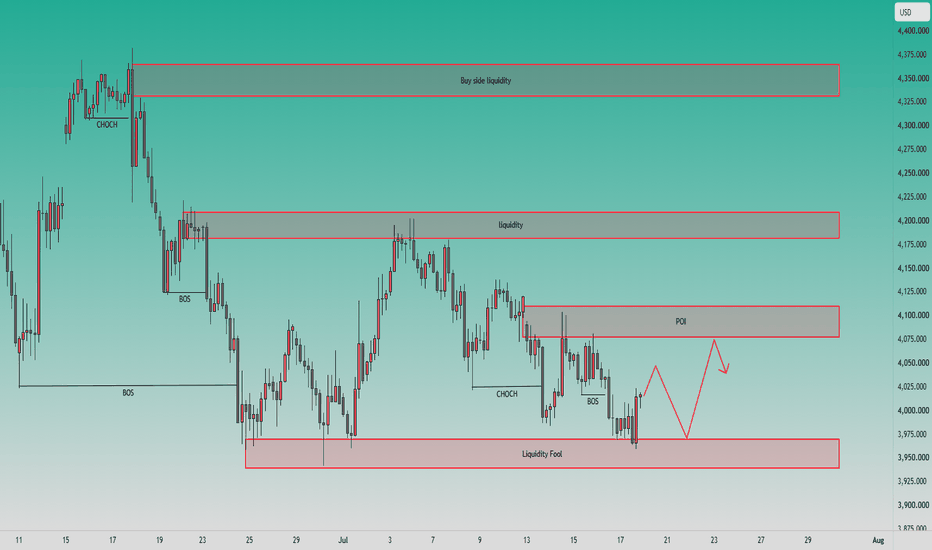
XAUUSD — Bearish Continuation Toward Fibonacci Target
Fundamental Analysis
Gold remains sensitive to USD momentum, Treasury yields, and upcoming U.S. macro data. For next week, the technical bias still leans bearish while price stays below the major descending structure.
Technical Analysis
On the 4H chart, XAUUSD is trading around 4,017 after losing momentum under the downtrend trendline. The nearest sell reaction zone is around 4,050 - 4,070, where price may retest the Fibonacci sell area before another downside move. If this zone rejects price, sellers may continue to push gold toward the lower Fibonacci psychological target around 3,755. A stronger recovery toward 4,203 or 4,300 - 4,384 would only be a deeper bearish retest unless price breaks the major downtrend.
Important Key Levels
Current price: 4,017
Nearest sell zone: 4,050 - 4,070
Strong resistance: 4,203
Fibonacci liquidity zone: 4,290 - 4,310
Major Fibonacci sell zone: 4,380 - 4,384
Main downside target: 3,755 - 3,740
Invalidation: above 4,203
Trading Scenario
Main Sell Setup
Entry: 4,050 - 4,070
Stop Loss: 4,203
Take Profit 1: 3,950
Take Profit 2: 3,850
Take Profit 3: 3,755 - 3,740
Sell Condition
Wait for gold to recover into the 4,050 - 4,070 Fibonacci sell zone and show bearish rejection. A failed reclaim, long upper wick, bearish engulfing candle, or close back below the zone would confirm seller pressure. If price breaks below the recent low, the bearish continuation setup becomes stronger. If gold breaks and holds above 4,203, this sell setup should be invalidated.
Overall View
The main view for next week remains bearish while XAUUSD trades below the downtrend structure. A short-term recovery can happen, but the preferred plan is to wait for price to retest the Fibonacci sell zone before looking for continuation toward the 3,755 - 3,740 target area.
Do you share the same bearish view on gold for next week, or are you waiting for a deeper retest near 4,203 first?
Short 
Gold under pressure: Is 38XX next?The new trading week begins with little change in the broader macro narrative. Last week's softer U.S. inflation data failed to trigger a sustained rally in Gold, reinforcing the view that institutional investors remain focused on the Federal Reserve's cautious stance rather than a single round of economic releases. Fed officials continue to emphasize that inflation has not yet been fully contained, keeping expectations for restrictive monetary policy largely intact. As long as U.S. yields remain relatively firm and the dollar avoids a deeper correction, Gold is likely to struggle in establishing a meaningful recovery.
With the major inflation reports now behind the market, attention shifts toward upcoming Fed communication and broader risk sentiment. The absence of a fresh bullish catalyst leaves Gold increasingly dependent on technical structure, where sellers continue to hold the upper hand.
From a technical perspective, Gold continues to respect its broader daily bearish trend, printing a sequence of lower highs and lower lows beneath the long-term descending trendline. Recent rebounds have repeatedly failed near the Demand + Fibonacci 0.50–0.618 resistance cluster, confirming that institutional sellers are still defending premium pricing. Although the 390x support zone has generated buying interest, price has yet to produce any meaningful Break of Structure (BOS) that would suggest a trend reversal.
As long as Gold remains below the descending trendline and key resistance, the current recovery should continue to be viewed as corrective. If selling pressure extends through the 390x support, the next major liquidity objective could emerge around the 38xx demand zone, where longer-term buyers may begin reassessing value.
PRIMARY SCENARIO
Gold could continue trading within the prevailing bearish structure. Failure to reclaim the Demand + Fibonacci 0.50–0.618 resistance may expose the 390x support to another test. A confirmed daily break below this area would likely extend the decline toward the 38xx liquidity zone.
ALTERNATIVE SCENARIO
If buyers reclaim the descending trendline and secure a confirmed daily close above the 0.618 Fibonacci resistance, bearish momentum could begin to fade. Such a move would be the first indication that the broader downtrend is losing strength and that a deeper corrective recovery may develop.
MARKET VIEW
Current Bias: Bearish
Preferred Strategy: Sell the Rally – Wait for Confirmation
Lucas Gray Trading Short 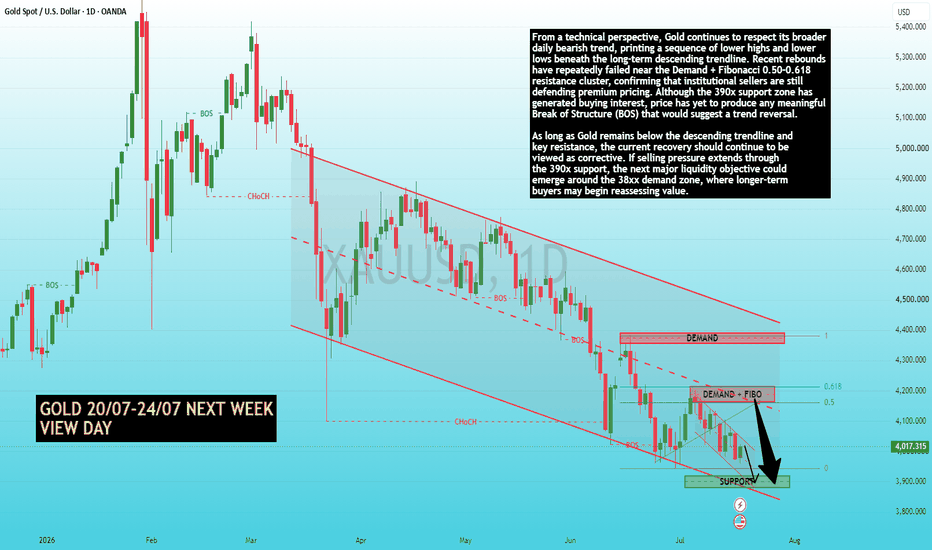
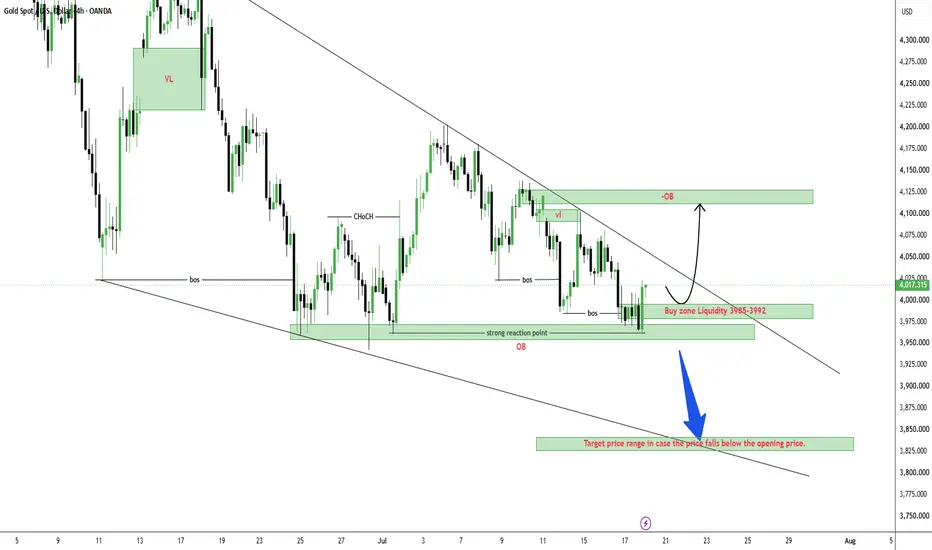
XAUUSD — OB Reaction, Trendline Break Can Confirm Recovery
Gold is trading around $4,017 after reacting strongly from the lower OB and buy zone liquidity around $3,985–$3,992. This is an important area on the medium-term structure because price has already tested the lower reaction zone several times, and sellers failed to create a clean continuation below it.
From an SMC perspective, gold is still moving inside a broad corrective structure, but the reaction from the lower OB shows that buyers are starting to defend the discount area. The key point now is the descending trendline. If gold can stay above this trendline and build acceptance above the current range, the recovery structure can become stronger.
The current market is not a place to chase. The clean plan is to wait for price to respect the $3,985–$3,992 buy zone or confirm strength above the trendline. If buyers continue to defend this area, gold may recover toward the VL zone first, then the upper OB area around $4,100–$4,125.
Buy setup 1
Condition:
Gold holds the buy zone liquidity around $3,985–$3,992 and forms bullish rejection with lower timeframe MSS / CHOCH.
Entry: $3,985–$3,992
SL: below $3,950
TP1: $4,030
TP2: $4,060
TP3: $4,100–$4,125
TP4: $4,175
Buy setup 2
Condition:
If gold breaks above the descending trendline and retests it as support, bullish recovery becomes stronger.
Entry: above $4,030–$4,040 after breakout retest
SL: below $3,985
TP1: $4,060
TP2: $4,100–$4,125
TP3: $4,175
TP4: $4,220
Buy setup 3
Condition:
If gold sweeps below $3,985 but quickly reclaims the buy zone, this can create a stronger liquidity-trap buy setup.
Entry: after reclaim above $3,985–$3,992
SL: below the sweep low
TP1: $4,030
TP2: $4,060
TP3: $4,100–$4,125
Sell setup
Condition:
Selling is not the main priority while price is reacting from the lower OB. A sell setup is only valid if gold fails to hold above $3,985–$3,992 and breaks the lower structure clearly.
Entry: below $3,950 after breakdown retest
SL: above $3,985
TP1: $3,920
TP2: $3,880
TP3: $3,830–$3,850
Sell scalping setup
Condition:
If gold reaches the upper OB around $4,100–$4,125 and shows clear bearish rejection, a short-term sell scalp may appear.
Entry: $4,100–$4,125 after rejection
SL: above $4,150
TP1: $4,060
TP2: $4,030
TP3: $3,985–$3,992
Key levels
Current price area: $4,017
Buy zone liquidity: $3,985–$3,992
Strong reaction OB: $3,950–$3,970
Trendline confirmation area: $4,030–$4,040
Short-term resistance: $4,060
VL reaction zone: $4,090–$4,105
Upper OB target zone: $4,100–$4,125
Bullish continuation confirmation: clean hold above the descending trendline
Stronger bullish confirmation: clean break above $4,125
Bearish continuation confirmation: clean break below $3,950
Bearish target zone if structure fails: $3,830–$3,850
My current view is that gold is reacting from a medium-term OB support area, and the recovery can become stronger if price holds above the descending trendline. The Prime Gold plan is to avoid selling directly into the lower OB and wait for confirmation around $3,985–$3,992 or a clean breakout above the trendline. If buyers defend this structure, gold can continue toward $4,060, $4,100–$4,125 and potentially higher liquidity.
No confirmation, no trade.
Long 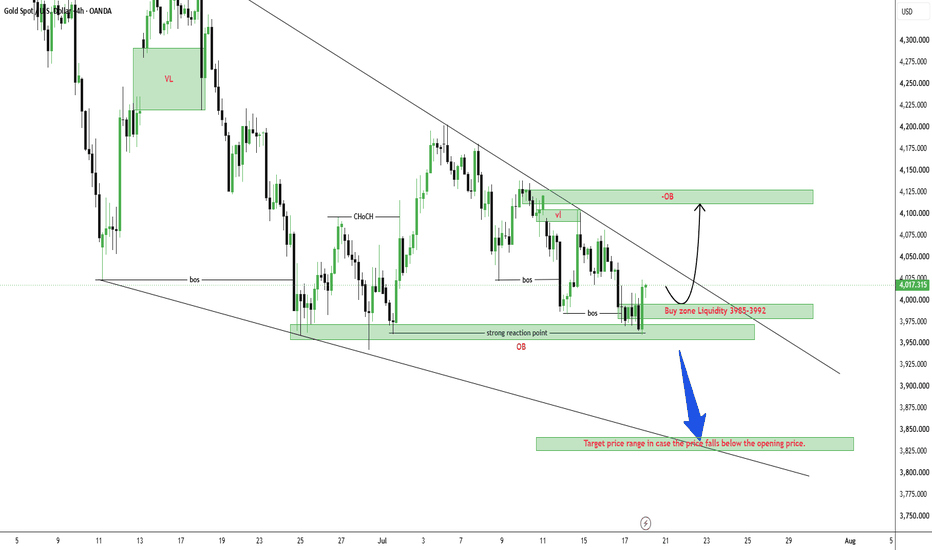
Weekly close below trendline: Gold outlook?The final trading session of the week arrives with no major macro catalyst capable of shifting market sentiment. Earlier this week, softer U.S. inflation data temporarily weakened the dollar but failed to generate a sustained recovery in Gold. Markets continue to price in a cautious Federal Reserve, with policymakers showing little urgency to ease monetary policy while inflation risks remain elevated. As a result, Treasury yields have stabilized and institutional flows continue to favor defensive positioning rather than aggressive buying in precious metals.
With the week's key economic releases now behind us, price action becomes increasingly important. The fact that Gold has been unable to capitalize on supportive inflation data suggests that buyers remain hesitant, while sellers continue to dominate the broader market structure.
From a technical perspective, Gold is set to close the week below the descending trendline on the H4 timeframe, reinforcing the existing bearish trend. Every recovery toward the Demand + Trendline resistance has been met with renewed selling pressure, confirming this confluence as the key institutional supply zone. Meanwhile, price continues to hold above the short-term support around 396x, but the rebound lacks momentum and has yet to produce a confirmed Break of Structure (BOS).
A weekly close beneath the trendline would strengthen the bearish narrative and keep the focus on the next liquidity zone around 392x–393x. Until buyers reclaim the descending trendline, the current recovery should still be viewed as corrective rather than the start of a broader reversal.
PRIMARY SCENARIO
As long as Gold remains below the Demand + Descending Trendline resistance, sellers are likely to maintain control. Any short-term recovery toward this resistance cluster could attract fresh selling pressure, with the 392x–393x support zone remaining the next downside objective.
ALTERNATIVE SCENARIO
If buyers manage to reclaim the descending trendline and secure a confirmed H4 close above the Demand resistance, bearish momentum could begin to fade. Such a move would suggest the current selling pressure is losing strength and open the door for a broader corrective recovery.
MARKET VIEW
Current Bias: Bearish
Preferred Strategy: Sell the Rally – Wait for Confirmation Short 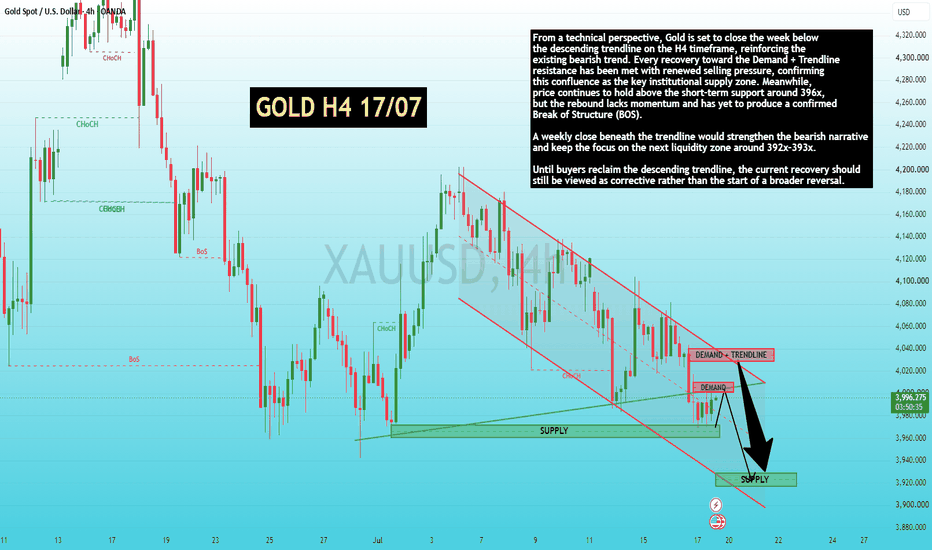
XAUUSD – Gold Is Still Heavy, But Support Is Getting Important XAUUSD – Gold Is Still Heavy, But Support Is Getting Important
Gold is still struggling to build a strong recovery.
Price is currently trading around 4,017 after briefly moving back above the psychological 4,000 level. The bounce is visible, but gold remains near the monthly low area and is still moving inside a broad descending channel on the daily chart.
This means the market is not fully bullish yet. Gold is trying to recover from support, but the bigger structure still needs confirmation.
FUNDAMENTAL ANALYSIS
Gold remains under pressure as higher oil prices bring inflation concerns back into focus.
Rising tension between the U.S. and Iran has supported oil prices, which may keep inflation expectations elevated. This can strengthen the case for the Fed to keep interest rates higher for longer, supporting the U.S. dollar and limiting upside for non-yielding assets like gold.
For now, the fundamental background is still cautious. Any recovery in gold needs technical confirmation before becoming reliable.
TECHNICAL ANALYSIS – SMC + MARKET STRUCTURE
From an SMC perspective, gold is still moving inside a wide descending channel. Price has been forming lower highs since the major top, and the market has not yet broken the bearish structure.
The current area around 3,900 – 4,020 is very important. This zone is marked as a strong support and potential buy reaction area. If buyers defend this area, gold may create a corrective recovery toward the next resistance zones.
The first major resistance is around 4,207. If gold breaks and holds above this level, the recovery structure becomes stronger.
Above that, the next important resistance sits near 4,380 – 4,400, where Fibonacci and previous price reaction align. A stronger breakout from there could open the path toward the higher resistance zone around 4,700.
However, if gold loses the current support zone, the bearish channel remains active and price may continue searching for lower liquidity.
KEY PRICE ZONES
Current price: 4,017
Strong support / Buy zone: 3,900 – 4,020
Psychological level: 4,000
First resistance: 4,207
Fibonacci reaction resistance: 4,380 – 4,400
Higher resistance: 4,700
Bearish pressure remains: Below 4,207
Invalidation for recovery view: Below 3,900
TRADING SCENARIOS
Buy Scenario
Buy Zone: 3,900 – 4,020
Entry: Bullish reaction, liquidity sweep, or daily confirmation from support
SL: Below 3,900
TP1: 4,207
TP2: 4,380 – 4,400
TP3: 4,700 if momentum expands
Breakout Buy
Above 4,207 → Target 4,380 – 4,400
Sell Scenario
Sell below 3,900 after confirmation
TP1: 3,750
TP2: Lower channel area if bearish momentum continues
Invalidation: Reclaim 4,020 – 4,207
MY VIEW
Gold is trying to recover, but the bigger trend is still heavy.
The chart shows price sitting near a major support zone, so I do not want to chase selling too late. At the same time, I cannot call a bullish reversal while gold remains inside the descending channel and below 4,207.
For me, 4,207 is the first real confirmation level.
If buyers can push gold above 4,207, the recovery may extend toward 4,380 – 4,400.
If support near 3,900 fails, sellers may regain full control.
Gold is at support — but confirmation will decide the next move.
Do you think gold will defend the 4,000 area, or will sellers break the support zone next?
Long 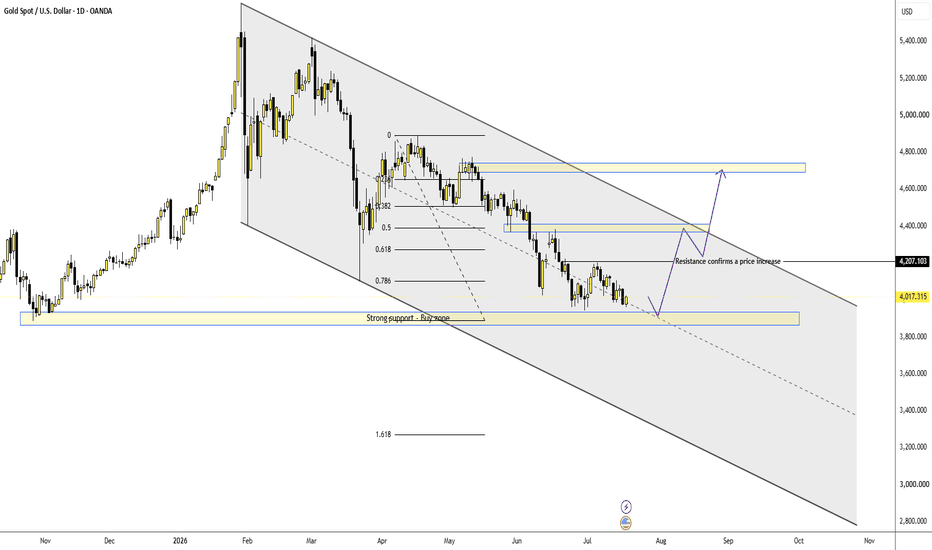
Long 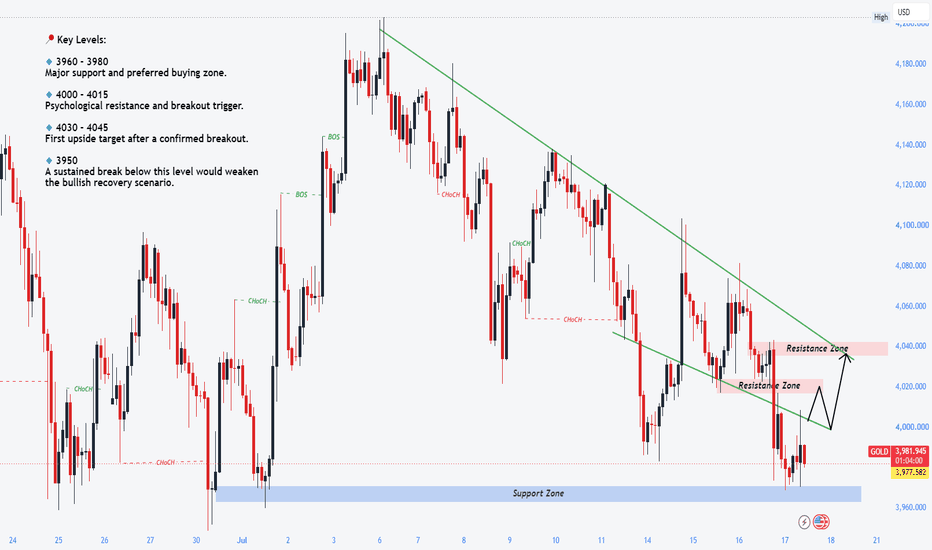
XAUUSD 3966 sweep — 4078 is the draw XAUUSD 3966 sweep — 4078 is the draw
That sweep under 3,970 is the part nobody should ignore.
Gold flushed into the low, tagged 3,966, then bounced back above 4,000. Not clean bullish. Not pretty. But that is how traps usually start.
Late sellers got paid first. Now price is trying to pull back into the next imbalance.
Macro still leans heavy, yeah. US-Iran tension, inflation fear, Fed rate-hike talk, stronger USD. All of that keeps the bigger tone bearish. So I’m not calling this a clean reversal.
This is more like a reaction trade.
Main bias is short-term bullish recovery while 3,966 holds.
The Fibo zone around 3,982 - 3,992 is the key reload area. If gold dips back there, holds, and reclaims above 4,021, then buyers can squeeze price toward 4,034 first. Above that, the real magnet is 4,064 - 4,078.
That SSL zone is where I expect the next fight. Could be the spot where sellers step back in. So yeah, buy low if it confirms, but don’t marry the bounce.
Trading scenario:
Buy idea only if price holds 3,982 - 3,992 and reclaims back above 4,021.
Entry zone: 3,982 - 4,000 after confirmation
Stop loss: below 3,966
TP1: 4,034
TP2: 4,064
TP3: 4,078
No reclaim above 4,021, no buy. Simple.
If gold closes hard below 3,966, this bounce idea is cooked. Then the sweep failed, and sellers can drag price lower again.
For now, I’m reading this as low sweep first, recovery into SSL second.
You think gold taps 4,078 before sellers return? Long 
XAUUSD: Weak Bounce, Strong Sellers Above XAUUSD: Weak Bounce, Strong Sellers Above
Market Context
Gold is trading around 4,017 after a small rebound from the monthly low area. Buyers are reacting from demand, but the upside still looks limited.
US-Iran tensions and inflation concerns are keeping the USD supported, while the market is still pricing the possibility of a restrictive Fed stance. This creates pressure on gold whenever price rebounds into higher resistance.
Key point: gold is bouncing, but sellers are still waiting above. This is not a confirmed bullish reversal yet.
Technical Structure
Gold is rebounding from the Demand / Buy Reaction Zone around 3,960 - 4,000. This area is holding for now and may support a short-term bounce.
The first important resistance is 4,030 - 4,080. This is the Sell Reaction Zone. If price rebounds into this area and fails, selling pressure may return quickly.
Above that, the Major Supply Zone remains around 4,115 - 4,135. As long as gold stays below this zone, the broader structure still favors sellers.
If demand is lost, price may fall back toward 3,960 and possibly lower.
Key Levels
Current Price: 4,017
Demand / Buy Reaction Zone: 3,960 - 4,000
Sell Reaction Zone: 4,030 - 4,080
Major Supply Zone: 4,115 - 4,135
Bullish Confirmation: Above 4,080
Bearish Continuation: Below 3,960
Trading Plan
Buy Scenario
Entry: 3,960 - 4,000
SL: Below 3,940
TP: 4,030 / 4,060 / 4,080
Condition: Price holds demand and shows bullish confirmation. This is only a short-term rebound setup, not a full reversal.
Sell Scenario Priority
Entry: 4,030 - 4,080
SL: Above 4,100
TP: 4,017 / 4,000 / 3,960
Condition: Price rebounds into the Sell Reaction Zone and gets rejected. Sellers regain control if buyers fail to hold above 4,080.
Sell at Major Supply
Entry: 4,115 - 4,135
SL: Above 4,155
TP: 4,080 / 4,030 / 4,000
Condition: Price sweeps higher into major supply and fails to continue. This is the stronger sell area if the rebound extends.
Breakdown Sell
Entry: Below 3,960
SL: Above 4,000
TP: 3,940 / 3,920 / 3,900
Condition: Demand fails, retest is rejected, and bearish momentum continues.
Overall Bias
Gold is still not bullish yet. The rebound from demand is valid, but the structure remains weak below 4,030 - 4,080.
If buyers reclaim 4,080, gold may extend toward 4,115 - 4,135. If price rejects from the sell zone, sellers may push gold back toward 4,000 and 3,960.
Best approach: wait for confirmation at demand or resistance. Do not chase the bounce while gold is still below the sell zone.
Will gold break 4,080, or will sellers use this rebound to push price back into demand?
Short 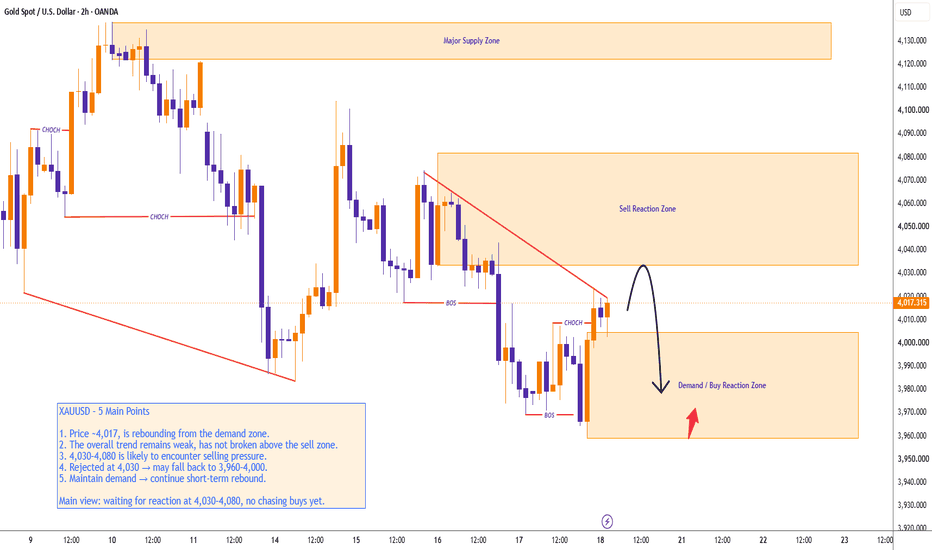
MASON XAUUSD – Medium-Term Recovery Setup
Gold is trading around 4,017 after reacting near the lower part of the descending channel. The main medium-term idea for next week is a bullish correction, but confirmation is still needed because price remains inside the larger bearish channel.
Technical View
On the H4 chart, gold is still moving inside a wide descending channel, but price is now reacting from the lower channel area and liquidity zone. This suggests sellers may start losing momentum in the short term.
The recent structure also shows a possible recovery base after price swept liquidity around 3,950–4,000. If gold can hold above this area and reclaim the 4,100–4,120 zone, the bullish correction scenario becomes stronger.
The first important upside level is 4,203, marked as strong liquidity. A clean break above this zone could open the way toward the higher resistance area around 4,350–4,380, where the chart shows the next major supply zone.
Key Zones
Current price: 4,017
Main liquidity support: 3,950–4,000
Key buy/reclaim zone: 4,100–4,120
Strong liquidity target: 4,203
Major resistance: 4,350–4,380
Invalidation: below 3,950
Trading Plan
Priority Buy Scenario – Medium-Term Correction
Entry zone: 4,100–4,120 after reclaim and retest
Confirmation: H4 candle holds above the zone with bullish price action
Stop loss: below 3,950
Take profit 1: 4,203
Take profit 2: 4,350
Take profit 3: 4,380
Alternative Scenario
If gold drops once more into 3,950–4,000 and shows a clear rejection, this area can become a lower buy reaction zone. The first target would be 4,100–4,120, then 4,203 if momentum improves.
Sell View
Selling is not the priority for this plan. A sell view only becomes stronger if gold loses 3,950 and fails to recover back above the liquidity zone.
Final View
The main view for next week is a bullish correction from the lower channel area. Gold needs to reclaim 4,100–4,120 first, then 4,203 becomes the key level to watch for stronger upside continuation. No confirmation means no trade. Long 
XAUUSD – Bearish Continuation Toward Fibonacci TargetXAUUSD is trading around 3,990 after failing to recover above the short-term downtrend structure. Price remains below the previous support area, and the current reaction still looks like a weak correction inside the bearish trend.
The priority view remains sell with the trend, especially if gold retests the 4,020–4,040 reaction zone and fails to break above the psychological sell order area.
Technical View
Gold is still moving under bearish pressure after the strong breakdown from the previous consolidation zone. The market failed to hold above the old support, and price is now trading below the short-term downtrend trendline.
The 4,020 area is the first reaction zone to watch. This level was marked on the chart as an important area for price reaction. If gold pulls back into this zone and shows rejection, it may confirm that buyers are still weak.
The 4,035–4,040 area is the main psychological sell order zone. This zone is important because it aligns with the Fibonacci reaction area and the previous breakdown structure. If price reaches this area and fails to continue higher, it may confirm another lower high before the next bearish leg.
The 3,969 support is the nearest downside level. If gold breaks below this area, the bearish structure may continue toward the Fibonacci 1.618 target around 3,945–3,950.
The main idea is simple: as long as gold stays below 4,020–4,040, the market remains under selling pressure, and recovery attempts should be treated as corrective.
Key Zones
Current price: 3,990
Price reaction zone: 4,020–4,025
Psychological sell order zone: 4,035–4,040
Downtrend resistance: 4,000–4,020
Nearest support: 3,969
Fibonacci 1.618 target: 3,945–3,950
Invalidation: above 4,045
Trading Plan
Sell Priority: 4,020–4,040
Condition: wait for bearish rejection, failed recovery above the downtrend trendline, or price staying below the psychological sell order zone.
SL: above 4,045
TP1: 3,969
TP2: 3,945–3,950
TP3: 3,920–3,930
Alternative Scenario
If gold breaks below 3,969 directly, wait for a retest of this level as resistance before looking for sell continuation toward the Fibonacci 1.618 target around 3,945–3,950.
Buy View
Buy is not the priority while price remains below the downtrend trendline and below the 4,020–4,040 resistance area. A short-term buy reaction may appear near 3,945–3,950, but it needs clear bullish confirmation first.
Final View
Overall, gold remains in a bearish continuation structure. The cleaner plan is to wait for price to retest the 4,020–4,040 sell zone and watch for rejection. As long as this area holds as resistance, the downside path toward 3,969 and the Fibonacci target around 3,945 remains in focus.
Will gold reject from the psychological sell zone first, or break below 3,969 directly toward the Fibonacci target?
Short 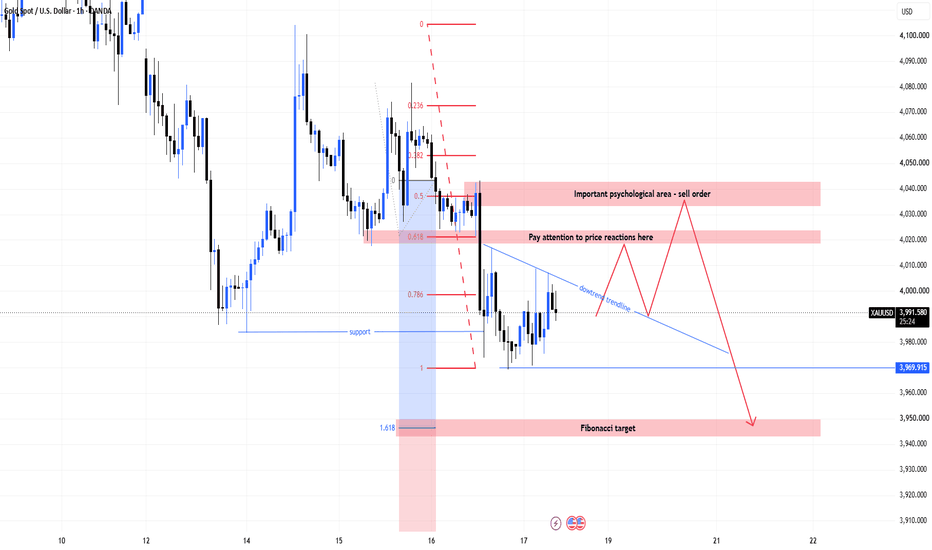
Short 
Short 
 Long
Long
Short 
 Short
Short