XAUUSD: Bearish Wave 5 May Persist TodayGold is showing weakness again after failing to hold the recovery structure above the short-term resistance area. From Kelly’s view, the current chart suggests that price may be developing a bearish wave 5 move, with sellers still active below the 4,035–4,040 sell zone.
The key idea is simple: gold is trying to rebound, but the structure still favors downside continuation while price remains below resistance.
⟡ Market structure
The chart shows gold completed a short recovery after reacting from the lower area, but buyers failed to sustain momentum above the 4,062 resistance level. Price then started forming lower highs again and is now trading near 4,026.
The support zone around 4,015–4,025 is currently being tested. If this area breaks with clear bearish pressure, gold may continue lower towards the Fibonacci 1.618 target zone around 3,960–3,970.
The sell zone around 4,035–4,040 is important. As long as price remains below this area, the bearish intraday structure remains active.
➤ Key levels
◌ 4,035–4,040: sell zone wave 4 and short-term resistance
◌ 4,026: current reaction area
◌ 4,015–4,025: support area under pressure
◌ 4,062: key resistance and bullish invalidation zone
◌ 3,960–3,970: Fibonacci 1.618 target and wave 5 downside area
◌ Above 4,062: area where the bearish wave setup weakens
⌁ Elliott Wave view
From an Elliott Wave perspective, gold appears to be forming a bearish 5-wave structure after the recovery failed near resistance.
Wave 1 created the first downside reaction from the recent high.
Wave 2 corrected higher but failed below resistance.
Wave 3 pushed price back into the support zone.
Wave 4 may now be forming around the 4,035–4,040 sell area.
If this zone holds, wave 5 may continue lower towards the 3,960–3,970 target.
This is why Kelly would not treat the current support reaction as a reversal yet. Price still needs to reclaim resistance before the bullish view becomes stronger.
▸ Trading scenario
Preferred scenario: wait for price to reject from the 4,035–4,040 sell zone before expecting wave 5 continuation.
Sell zone: 4,035–4,040 if bearish confirmation appears
Stop loss: above 4,062 or above the confirmed rejection high
Take profit 1: 4,015
Take profit 2: 3,990
Take profit 3: 3,960–3,970
Alternative scenario: if gold breaks above 4,062 and holds with strong acceptance, the bearish wave 5 setup weakens. In that case, the market may shift back into a corrective recovery structure.
⌁ Kelly’s view
For Kelly, this is a bearish intraday setup. Gold is still trading below the sell zone, and the Elliott structure suggests one more downside leg may develop if sellers defend resistance.
The cleaner plan is to avoid chasing price at support and wait for a retest reaction around 4,035–4,040.
Gold is still under short-term pressure.
If the sell zone holds, wave 5 may continue towards the Fibonacci target below.
Share your view below.  Long
Long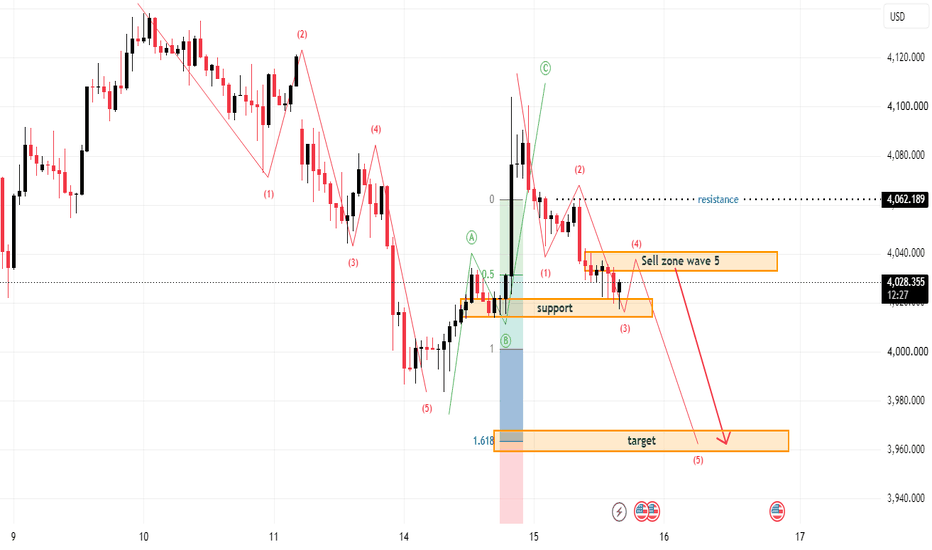
 Short
Short
XAU/USD (Gold) | 45-Minute TimeframeMarket Overview
Gold is currently trading around 4,025.78, showing a slight intraday decline of -0.16%. The broader market remains mixed, with short-term buying interest emerging after a recent bullish reversal while higher timeframes continue to maintain a bearish structure.
Multi-Timeframe Trend
Timeframe Bias Interpretation
5 Min 🟢 Bullish Short-term momentum favors buyers.
15 Min 🔴 Bearish Minor pullback within the intraday trend.
45 Min 🟢 Bullish Primary trading timeframe remains constructive.
4 Hour 🔴 Bearish Medium-term trend is still under selling pressure.
Daily 🔴 Bearish Long-term structure remains negative.
Technical Structure
1. Trend Analysis
The 45-minute chart shows a transition from a prolonged bearish trend into a developing recovery phase. Price has recently broken above the dynamic trend ribbon and is now consolidating just above support.
This suggests buyers are attempting to build momentum, although confirmation is still required.
2. Dynamic Support & Resistance
Immediate Resistance
4,041 – 4,045
Previous swing highs and projected upside objective.
Major Resistance
4,070 – 4,085
Strong supply zone where sellers may re-enter.
Immediate Support
4,021 – 4,024
Dynamic trend support.
Major Support
3,995 – 4,000
Psychological and structural support.
Momentum Assessment
Recent candles indicate:
Higher lows are forming.
Selling pressure is gradually weakening.
Price is consolidating instead of breaking lower.
Buyers remain active above the trend ribbon.
Momentum currently favors a continuation higher unless support is lost.
Trading Scenario
✅ Bullish Scenario (Higher Probability)
If price continues holding above 4,021, buyers could attempt another move toward:
Target 1: 4,041
Target 2: 4,055
Target 3: 4,075
A break above 4,041 with strong volume would strengthen the bullish outlook.
🔴 Bearish Scenario
If price breaks below 4,021, bullish momentum would weaken.
Possible downside objectives:
4,010
4,000
3,985
Failure to hold above the trend ribbon would likely shift control back to sellers.
Risk Assessment
Bullish Confirmation
Price holds above dynamic support.
Bullish candles close above recent consolidation.
Increasing buying momentum.
Bearish Confirmation
Breakdown below 4,021.
Lower highs begin forming.
Increased selling volume.
Professional Outlook
The current market structure suggests short-term bullish recovery within a broader bearish trend. Although the higher timeframes (4H and Daily) remain bearish, the 45-minute chart indicates that buyers have gained short-term control and may push price toward the 4,041 resistance area if support continues to hold.
Traders should monitor the 4,021–4,024 support zone closely. Holding above this level favors further upside, while a decisive break below it would increase the probability of renewed selling pressure.
Key Levels Summary
Current Price: 4,025.78
Immediate Support: 4,021–4,024
Major Support: 3,995–4,000
Immediate Resistance: 4,041–4,045
Major Resistance: 4,070–4,085
Short-Term Bias: Bullish
Medium/Long-Term Bias: Bearish
Overall Outlook: Cautiously Bullish while price remains above 4,021, with an upside objective near 4,041. Long 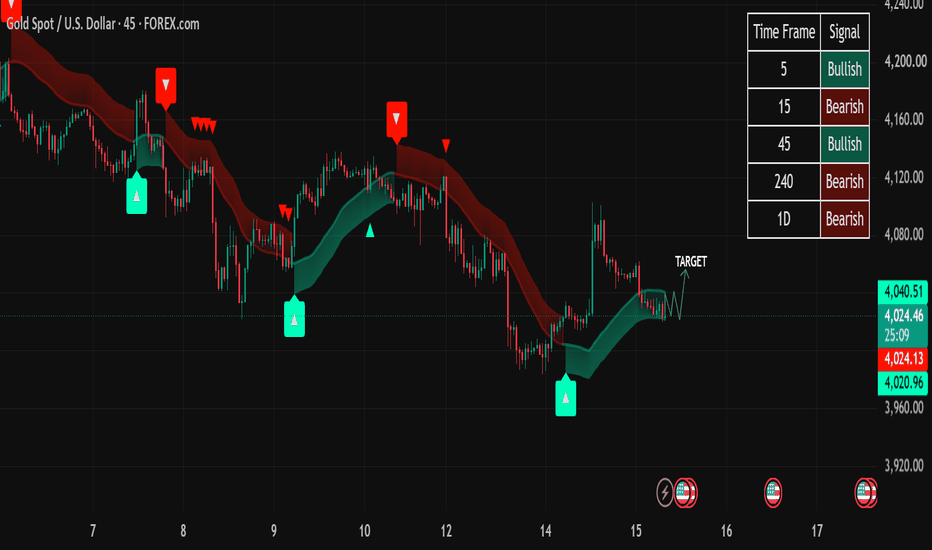
Short 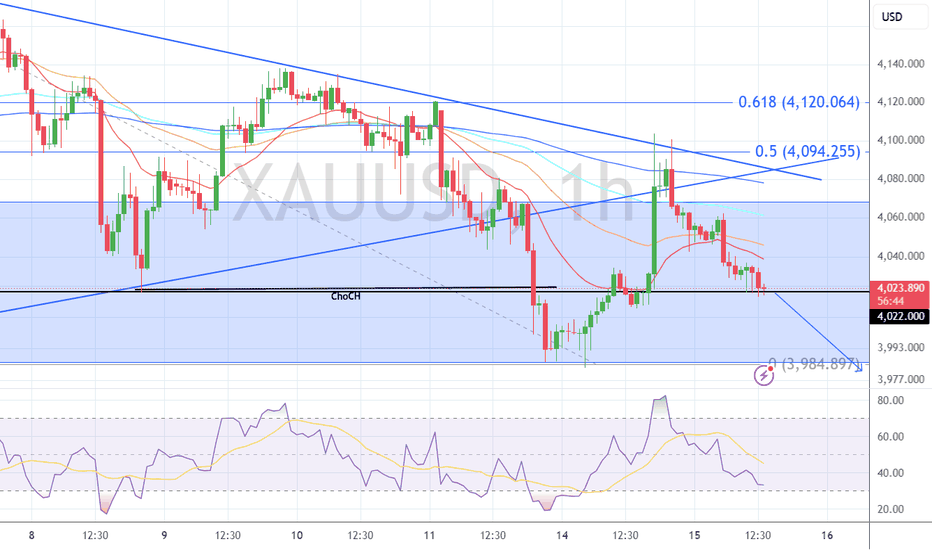
Short 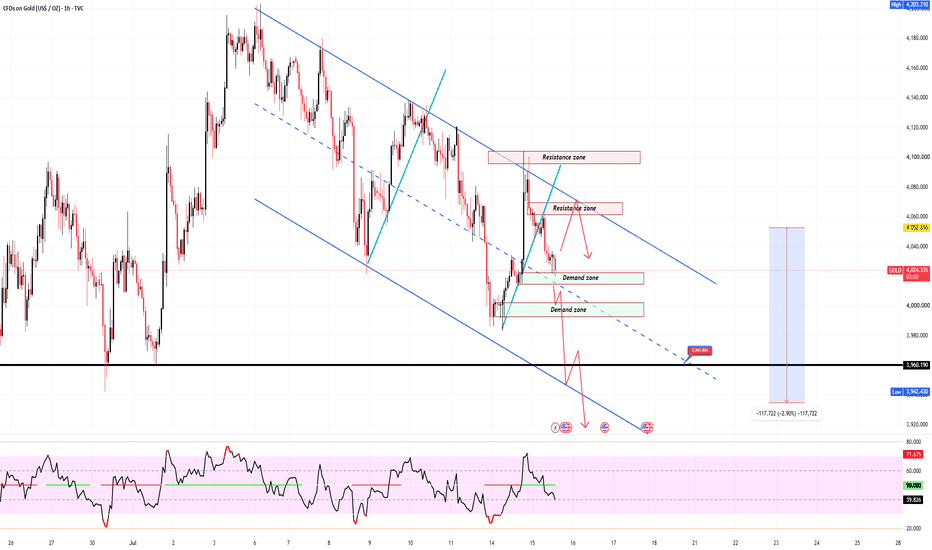
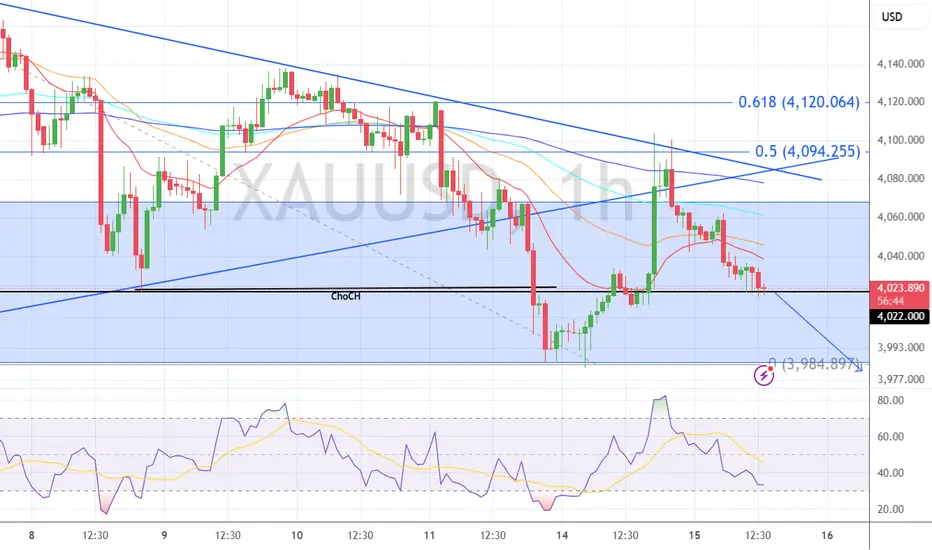
Weaker USD and gold impact market trends.Despite softer-than-expected U.S. inflation data, Gold failed to attract sustained buying interest. The decline in CPI briefly pressured the U.S. Dollar, but the broader market reaction suggests investors remain cautious rather than aggressively shifting into safe-haven assets. Treasury yields have not declined enough to trigger a meaningful reallocation of capital toward Gold, while expectations surrounding future Federal Reserve policy remain largely unchanged. Today's PPI release and comments from Fed officials could provide additional direction, but for now, institutional flows continue to favor confirmation over anticipation.
From a technical perspective, Gold remains confined beneath a well-defined descending trendline on the H4 timeframe. Yesterday's recovery failed to produce a decisive breakout, highlighting that sellers continue to defend the upper resistance zone around 407x, where the descending trendline converges with Fibonacci retracement and previous demand turned resistance. While the Dollar has softened, Gold has not responded with the strength typically associated with a bullish reversal, suggesting buying momentum remains limited.
As long as price continues trading below this confluence resistance, the broader bearish structure remains intact. A recovery toward 406x–407x could provide another opportunity for sellers if bearish rejection develops. On the downside, the 396x support area remains the next major liquidity target should downside momentum resume.
PRIMARY SCENARIO
Gold may extend its recovery toward 406x–407x.
Bearish rejection from the descending trendline could reinforce selling pressure.
A move back toward 396x remains the preferred scenario while resistance holds.
ALTERNATIVE SCENARIO
A decisive H4 close above the descending trendline and the 407x resistance zone could invalidate the current bearish bias and open the door for a broader recovery toward the next resistance area.
MARKET VIEW
Current Bias: Bearish
Preferred Strategy: Sell the Rally
Key Resistance: 406x–407x
Key Support: 396x Short 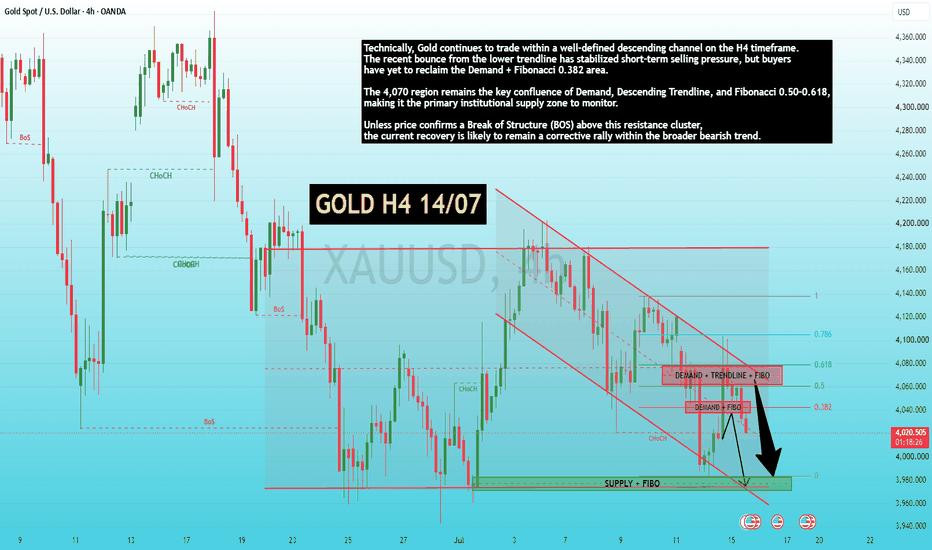
XAUUSD – Gold Rebounds After CPI, But Still Needs Confirmation XAUUSD – Gold Rebounds After CPI, But Still Needs Confirmation
Gold is reacting positively after softer CPI data, but price is still at a key decision zone.
Currently trading around 4,026, gold bounced strongly from the lower liquidity area, showing buyers are stepping in. However, the move is now testing resistance and FVG, so confirmation is still needed.
FUNDAMENTAL ANALYSIS
Softer CPI supports gold by easing rate hike expectations. However, one report is not enough to shift the broader outlook. Traders will continue watching Fed signals, USD, and bond yields.
For now, CPI gives short-term support, but not a full trend change.
TECHNICAL ANALYSIS – SMC + MARKET STRUCTURE
Gold swept liquidity below and reacted strongly from demand, showing seller weakness.
Key support is 4,014 – 4,024. If price holds above this zone, recovery can continue toward resistance.
Resistance levels:
4,040 – 4,055
4,055 – 4,080
4,100
If price breaks below 4,014, gold may drop back to 3,985 – 3,995.
KEY PRICE ZONES
Current price: 4,026
Support: 4,014 – 4,024
Lower zone: 3,985 – 3,995
Resistance: 4,040 – 4,055
FVG: 4,055 – 4,080
Target: 4,100
Bearish below: 4,014
Invalidation: Below 3,985
TRADING SCENARIOS
Buy Scenario
Buy Zone: 4,014 – 4,024
Entry: Bullish reaction or CHoCH
SL: Below 4,014
TP1: 4,040 – 4,055
TP2: 4,080
TP3: 4,100
Breakout Buy
Above 4,055 → Target 4,080 – 4,100
Sell Scenario
Sell below 4,014 after confirmation
TP1: 3,995
TP2: 3,985
Invalidation: Reclaim 4,014 – 4,024
MY VIEW
Gold is recovering after CPI, but structure confirmation is still needed.
If 4,014 – 4,024 holds, price can move higher toward 4,055 and 4,100.
If not, the bounce may fade and price could return to lower liquidity.
Gold is recovering — but support must hold.
Do you think gold will hold above 4,014 – 4,024 or drop back lower?
Long 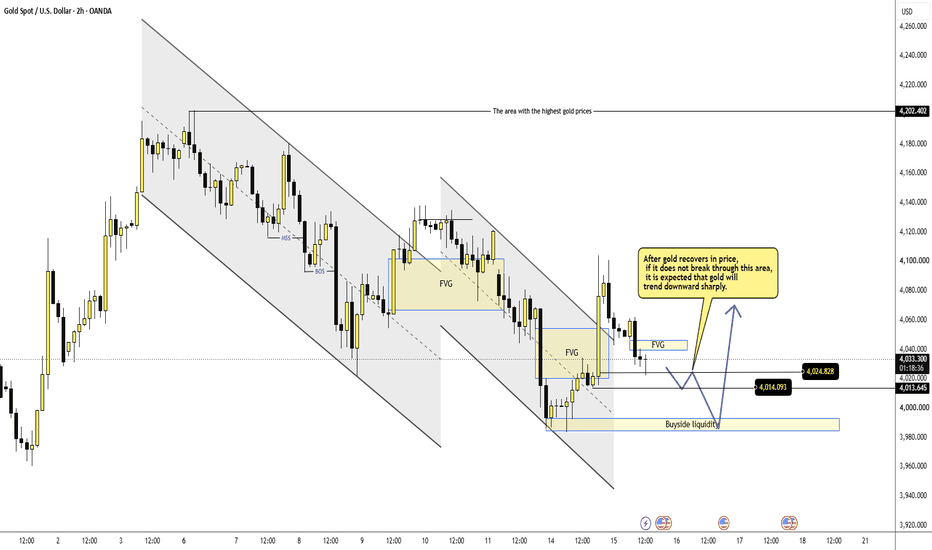
XAUUSD 4000 sweep — 4080 is the draw XAUUSD 4000 sweep — 4080 is the draw
That bounce from sub-4,000 is not random.
Gold got slammed through the channel, cleaned lows, then snapped back above the liquidity sweep zone around 3,992 - 4,000. Yeah, that looks like a seller trap to me.
But don’t get too excited yet.
Price is still fighting under the EMA stack. 4,045, 4,049, 4,064, then 4,080. That whole area is sitting above price like traffic. So this is not clean bullish continuation yet. It is a recovery setup from discount.
Macro helps a bit too. Softer US CPI gives gold some breathing room because traders start pricing a less aggressive Fed. USD paused after that. Makes sense. But tension around the US-Iran story and rate expectations can still keep upside capped. So I’m not calling for a straight moonshot here.
Main read is this: sweep low first, reclaim later.
If gold holds above 4,000 and starts reclaiming 4,045 - 4,050, then buyers can push into 4,064. Above that, 4,080 becomes the real draw. That’s where I expect the next fight.
Trading scenario:
Buy idea only if price holds the liquidity sweep zone around 3,992 - 4,000 and reclaims back above 4,045.
Entry zone: 4,000 - 4,023 after confirmation
Stop loss: below 3,985
TP1: 4,045
TP2: 4,064
TP3: 4,080 - 4,088
No reclaim, no buy. Don’t chase the bounce in the middle.
If gold breaks hard below 3,985, this trap idea is dead. Then sellers can drag it back toward 3,972 and maybe lower.
For now, I’m watching the 4,000 sweep hold.
You think sellers got trapped here, or does gold need one more low first?
Long 
Gold Structure stays bearishWhere we are: Gold is at 4,030, down about 0.5% on the day, sitting right on the daily support at 3,999 and inside the bottom of the weekly demand shelf.
The inflation report was softer than expected across every line. Core MoM printed 0% against a 0.2% forecast. Core YoY came in at 2.6% versus 2.8% expected. Headline MoM was -0.4% and headline YoY dropped to 3.5% from 4.2%. That is a clean disinflation print. On paper that is fuel for gold.
Gold sold off instead. When a market gets the news it wanted and still falls, that tells you sellers are in control regardless of the story. That is not a small detail. It means the bounce we were watching for off the demand shelf did not get the follow-through it needed, even with the perfect setup handed to it.
Intermarket
The macro read got worse again. The driver split is now 100% bearish, 0% bullish, 0% neutral. Every single driver on the panel is against gold. Real yields at 2.36% and rising, dollar at 100.82 and rising, breakevens falling, gold/silver rising, miners underperforming, gold in euro terms falling, and gold versus the S&P falling. There is nothing left on the bull side of the ledger.
That is the answer to why soft CPI did not help. Yields and the dollar did not care. Until those two turn, gold is swimming against the current no matter what the inflation data says. The only mild positive left is the forward 20-bar probability at 51.8%, which is basically a coin flip.
Daily
Structure stays bearish, lower high and lower low. Resistance sits far above at 4,180 and support is right here at 3,999, less than 1% away. Price is inside the weekly demand zone at 4,059 to 3,884, but it is now leaning on the lower half of it rather than bouncing from the top.
The trendline chart is the one worth studying today. Price is sitting right on the long-term rising support line that has held since the move started, and it has already touched it nine times. Above it, the descending resistance line from the February high keeps capping every rally. Those two lines are closing in on each other, and price is being squeezed between them. A trendline tested nine times is not a strong line, it is a tired one. Each touch takes a little more out of it.
H4
Bearish structure, lower high and lower low. Resistance is now 4,076, only about 1% up, and support is 3,993. Look how that ceiling keeps dropping. Last week it was 4,120. Now it is 4,076. Lower resistance on every attempt is the market telling you sellers are getting more aggressive, not less.
Price is jammed under supply at 4,046 to 4,076, with more stacked at 4,096 to 4,131 and 4,178 to 4,195 above that. There is a small fresh demand zone right at 4,014 to 4,034 that price is standing on right now. That is the last shelf before 3,993.
The 4H multi-timeframe read is nearly all red: 15m, 4H, 1D, and 1W all bearish, with only the 1H holding a bullish lean. That single green box is the entire bull case right now.
Today's Data
PPI at 18:00 is forecast at 0%, cooling hard from a 1.1% prior. Another soft inflation reading. But watch what happens, because yesterday proved soft data alone is not enough to lift gold. If PPI comes in soft and gold still cannot rally, that is confirmation that sellers own this market and the demand shelf is likely to break.
Warsh testifies again at 19:30. If his tone leans firm on rates, the dollar and yields go up and gold has no cushion left.
Bottom Line
Gold got the soft CPI it needed and could not rally. That is the read of the week. The macro is 100% bearish, structure is bearish on every timeframe but one, resistance keeps stepping lower, and price is now leaning on the bottom of the weekly demand shelf instead of bouncing off the top.
The 3,999 to 3,884 zone is the last line, and it is looking weaker than it did on Monday. Lose 3,884 on a daily close and there is very little between here and the monthly demand at 3,453. That is a wide gap and the move can come fast.
For the bounce case, you now need more than a soft number. You need to see price reclaim 4,076, then 4,131, with real volume behind it. Until that happens, treat every push up into 4,046 to 4,076 as a place where sellers are waiting, with the descending trendline backing them up.
The plan: sellers have the evidence on their side, so rallies into supply are the cleaner trades. Longs need to wait for proof, not hope. Long 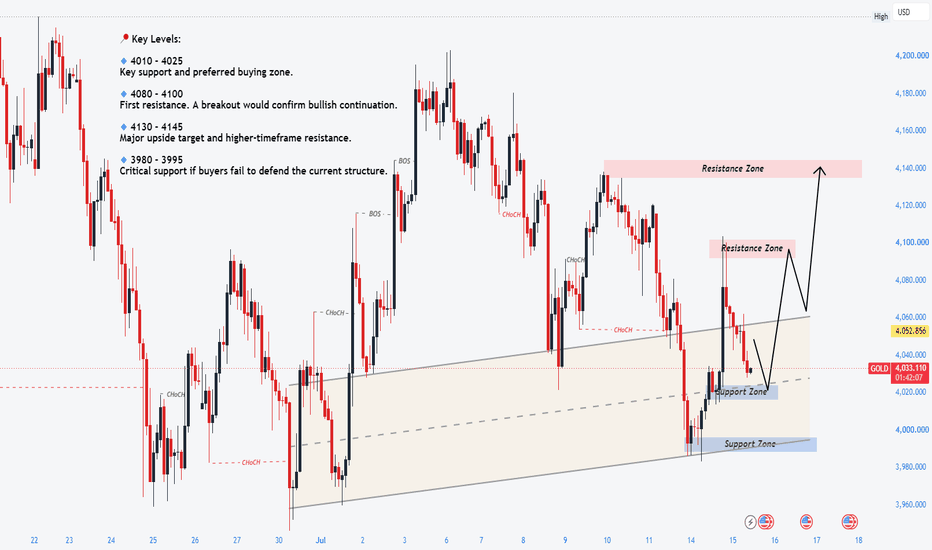
EVERYONE IS BUYING GOLD AGAIN... BUT SHOULD THEY?After Monday's massive sell-off, we witnessed an almost complete recovery in Gold on Tuesday. There is no doubt that the market completely ignored classic price action. Monday's selling volume was extremely strong, and under normal market conditions, Gold should have continued lower after a minor retracement. Instead, we saw a sharp upside spike driven entirely by the CPI news. In my opinion, this was a clear news-driven manipulation rather than a genuine change in trend.
The real question now is: Will Gold continue higher from here, or will the overall bearish trend resume? Let's break down the market psychology in detail so you can have a clear trading plan for the coming sessions.
### 📉 The Overall Market Structure Is Still Bearish
The first thing that stands out to me is the strong bearish market structure that has been developing since last week. If you look carefully at the chart, you'll notice that Gold continues to maintain a bearish structure by respecting its lower highs. Despite several strong bullish rallies, the market has failed to produce any meaningful structural breakout. Every upside move has eventually been rejected, and the bearish framework remains intact.
Most importantly, Gold has not broken any significant lower high yet. As long as that remains the case, sellers continue to control the higher time-frame structure.
I know many traders became bullish after Tuesday's CPI rally because, according to traditional price action, such a strong bullish candle often suggests continuation. But remember what happened on Monday. We witnessed an extremely aggressive selling session, yet instead of continuing lower immediately, Tuesday completely reversed because of the news. That alone tells us that recent price action has been heavily influenced by liquidity and news events rather than clean technical structure.
### 🧠 Understanding the Psychology Behind This Week
From a psychological perspective, I believe the market had a very specific objective at the beginning of this week.
The first target was the liquidity resting below the $4000 psychological level. Many traders entered long positions from the bottom and placed their stop losses below that area. Monday's gap-down opening followed by aggressive selling successfully washed out those buyers.
After Monday's collapse, most retail traders naturally turned bearish. Many jumped into fresh sell positions expecting further downside continuation.
Then Tuesday's CPI news arrived.
The market used that event to trigger a powerful upside rally, trapping almost every random seller who entered after Monday's decline. Now the situation has completely reversed once again. After seeing Tuesday's bullish candle, many traders have become bullish again and are expecting a full trend reversal.
The question is... is this really the beginning of a new uptrend, or is it simply another liquidity trap?
### ⚠️ Why I Still Prefer Selling
Personally, I continue to respect the existing market structure, and because of that, I don't believe Gold is ready for a sustained bullish continuation.
If we analyze Tuesday's rally carefully, Wednesday has already retraced nearly 50% of that entire move. That tells me sellers are still equally strong.
If buyers were truly in control, Gold should have held above the 61.8% Fibonacci retracement level around $4058 and continued pushing higher. Instead, the market failed to sustain above that level, showing that buying momentum remains weak.
I believe many traders who wanted to buy on Monday regained confidence after Tuesday's CPI rally. The market may have intentionally created this bullish sentiment simply to attract fresh buyers and generate additional liquidity before moving lower again.
That is exactly why my primary focus remains on selling opportunities.
Tuesday's CPI rally likely attracted a large number of random buyers above the $4000 psychological level. This is extremely important because $4000 is one of the strongest psychological numbers in Gold, where both buyers and sellers actively participate. As a result, a significant amount of liquidity is now resting around that zone, and I believe market makers are watching it very closely.
### 🎯 My Trading Plan For Wednesday
My plan is very straightforward.
I will continue focusing on selling opportunities.
My first expectation is that the market will target the stop losses of traders who are still holding buy positions below the Asian session lows.
After that, I expect the green support levels marked on my chart to produce small temporary buying reactions. These short-term bounces could easily convince traders that a reversal has started, attracting even more buyers.
However, I believe those rallies will simply become opportunities to build additional liquidity before another leg lower.
In my opinion, Gold is likely to continue moving in a zig-zag fashion while gradually creating more downside pressure.
The most important level for me is $4011.
Once Gold manages to close below $4011, I expect a much stronger selling wave to begin. With so much liquidity resting around the $4000 psychological area, that breakdown could trigger panic selling across the market.
### 📌 Final Thoughts
My trading rule remains very simple.
Until Gold clearly shows a confirmed change in market structure, I will not become bullish—no matter how strong any short-term rally appears.
Over the past several weeks, Gold has respected market manipulation far more than traditional price action. That is why understanding market psychology has become much more important than simply following candlestick patterns.
If you can understand where liquidity is resting and why market makers are moving price the way they are, you'll have a much better chance of staying on the right side of the market.
I hope you found this psychological analysis valuable and learned something useful from it.
Good luck for Wednesday, and I hope you all have a profitable trading session.
By the way, what's your trading plan for Gold?
Let me know your view in the comments.
Short 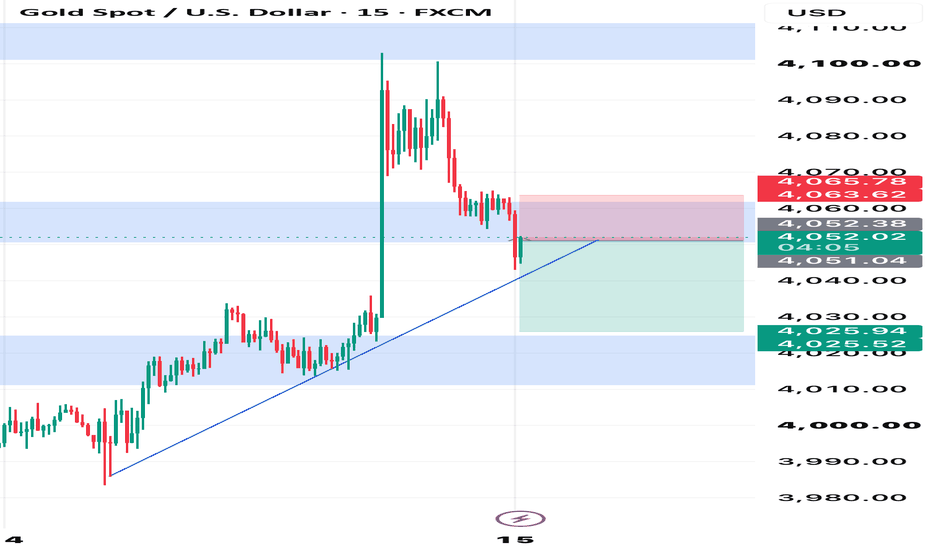
Fear and Greed in Crypto Trading:Cryptocurrency is unlike any other financial market.
A stock gaining 5% in a day is often considered a significant move.
In the crypto market, a 5% move can happen within minutes.
Prices can surge to new highs overnight and lose half their value just weeks later. These dramatic swings often leave traders asking the same question:
Why is the crypto market so emotional?
The answer isn't found in blockchain technology or technical indicators.
It's found in human psychology.
Fear and greed are the two emotions that drive every financial market, but nowhere are they more visible than in cryptocurrency.
Why Crypto Is Different
Unlike traditional stock markets, cryptocurrency trades 24 hours a day, seven days a week.
There are no opening bells or closing sessions.
Markets never sleep.
This constant trading creates an environment where news, rumors, and social media can influence prices at any hour.
A single announcement, tweet, or regulatory update can trigger thousands of buying or selling decisions within minutes.
Because the market reacts continuously, emotions spread much faster than in traditional financial markets.
The Power of Greed
Bull markets often begin quietly.
Early investors recognize an opportunity while most people remain skeptical.
As prices continue to rise, confidence grows.
News headlines become increasingly optimistic.
Success stories spread across social media.
More investors join the rally, not because they understand the market, but because they fear missing out.
This is where greed becomes the dominant force.
Instead of asking whether an asset is fairly valued, traders focus only on how much higher it might go.
Eventually, enthusiasm reaches an extreme.
History has shown that this is often when risk is greatest.
Fear Can Spread Even Faster
The same emotions work in reverse.
When prices begin falling, uncertainty quickly replaces confidence.
Investors who were celebrating gains only days earlier suddenly worry about losing everything.
Selling accelerates.
Stop losses are triggered.
Liquidations push prices even lower.
Fear becomes contagious.
What started as a normal correction can quickly turn into panic selling.
In highly leveraged crypto markets, these emotional moves are often amplified.
Social Media and Crowd Behavior
Few markets are influenced by online communities as much as cryptocurrency.
Platforms like X, Reddit, Discord, Telegram, and YouTube allow information—and misinformation—to spread instantly.
A viral post can attract thousands of new buyers.
Negative rumors can create widespread panic before the facts are even confirmed.
This constant flow of opinions often encourages emotional decisions rather than rational ones.
Successful traders learn to separate market sentiment from market reality.
Why Volatility Creates Opportunity
Many investors see volatility as a danger.
Professional traders often see it as opportunity.
Large price swings create more trading opportunities, but they also increase risk.
The key is understanding that volatility itself is neither good nor bad.
It simply reflects the speed at which emotions are changing.
Those who remain disciplined during periods of extreme fear and extreme greed often make better decisions than those who simply follow the crowd.
Managing Emotions in Crypto Trading
No trader can completely eliminate emotion.
The goal is to prevent emotions from controlling decisions.
Experienced traders rely on clear trading plans, predefined risk management rules, and realistic expectations.
They understand that missing one opportunity is far less damaging than making one emotional decision.
Patience often becomes a competitive advantage in a market where many participants react impulsively.
Final words:
The cryptocurrency market is driven by more than technology and innovation.
It is driven by people.
Every rally reflects growing optimism.
Every correction reflects increasing uncertainty.
Fear and greed constantly shape price movements, creating both opportunities and risks.
The traders who achieve long-term success are rarely the ones with the fastest reactions.
They are the ones who remain calm while others become emotional.
Because in crypto, understanding market psychology is often just as important as understanding the technology itself. Education 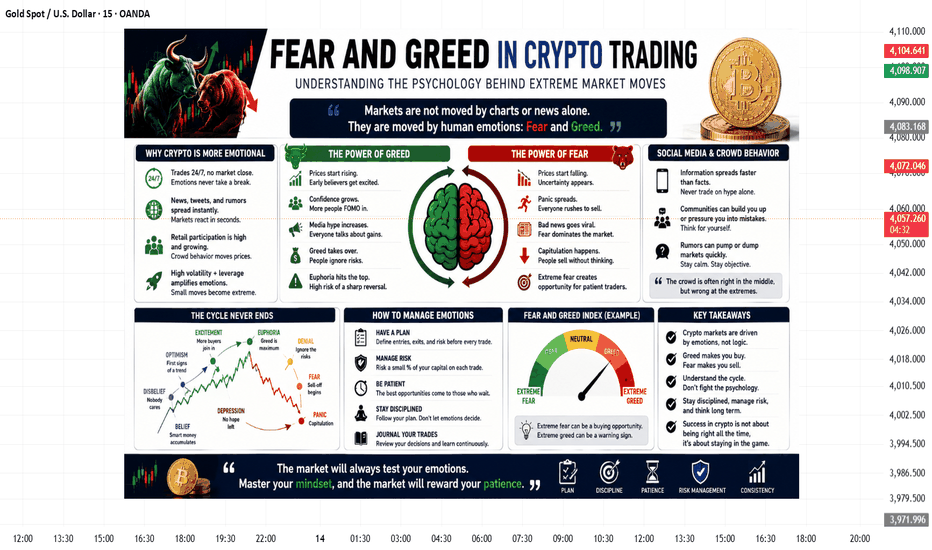
Short 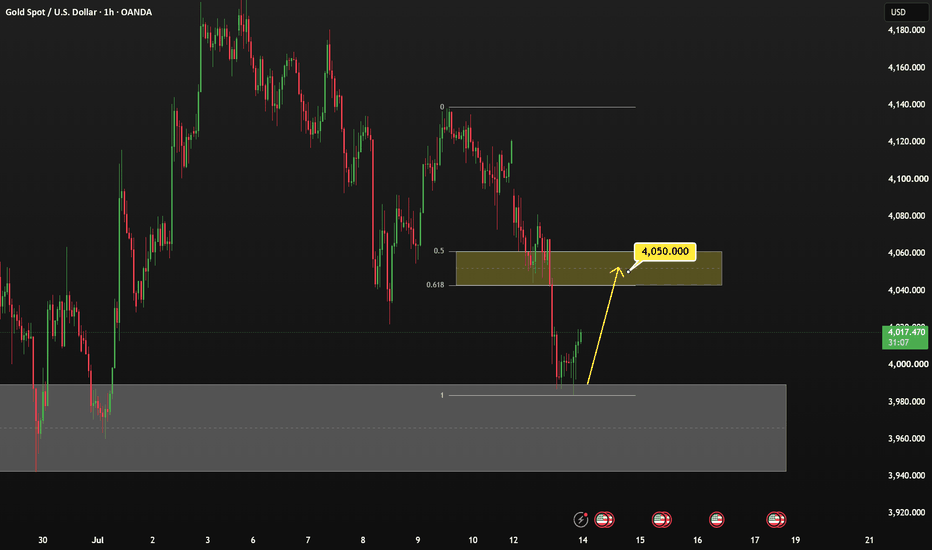
XAUUSD — FVG Filled, Retest Next?Gold has made a strong recovery from the lower liquidity area.
After reacting from the 3,998 zone, price pushed higher and is now trading around 4,080 - 4,085.
But this is where traders need to slow down.
Because gold has already filled part of the FVG area.
And the market is still moving inside a larger descending channel.
So the question is not:
“Should I buy after the pump?”
The better question is:
“Will gold hold the retest, or reject from this FVG?”
The simple read
Gold is recovering, but the bigger structure is not fully bullish yet.
Price is now testing the FVG / reaction area above 4,080.
The next resistance is 4,127.
If gold breaks and holds above the FVG area, buyers may try to push price toward 4,127.
But if gold rejects from this area, a pullback toward 4,025 may appear first.
That 4,025 zone is important because it is the OB buy zone on the chart.
Below that, 3,998 remains the liquidity buy zone.
Key price zones
Current price area: 4,080 - 4,085
FVG reaction area: 4,095 - 4,110
Main resistance: 4,127
OB buy zone: 4,025
Liquidity buy zone: 3,998
Bullish recovery improves above: 4,127
Trading plan
📈 Bullish continuation scenario
If gold holds above the FVG area and keeps strength:
Buyers may try to continue toward 4,127.
A clean upside view becomes stronger only if price breaks and holds above 4,127.
Without confirmation, I do not want to chase the current candle.
📉 Retest scenario
If gold rejects from 4,095 - 4,110:
Price may pull back toward 4,025.
This would not automatically destroy the recovery.
It may simply be the market retesting the OB buy zone before the next decision.
A clear reaction from 4,025 could support another recovery attempt.
📉 Deeper support scenario
If 4,025 fails clearly:
Gold may revisit the 3,998 liquidity buy zone.
If buyers defend 3,998, the market can still create a reaction.
If 3,998 breaks, the descending channel remains in control and the chart needs more time.
Tiara’s View
A strong candle can look exciting.
But the clean trade is usually not after the move.
It is at the retest.
For today, I am watching two things:
Can gold hold the FVG and continue toward 4,127?
Or will price pull back first into 4,025?
Main view:
Gold is recovering, but still inside the descending channel.
4,127 is the resistance target.
4,025 is the key retest zone.
3,998 is the deeper liquidity support.
Reaction first.
Confirmation second.
Trade last.
No confirmation = no trade.
Do you think gold will continue toward 4,127, or retest 4,025 first? Short 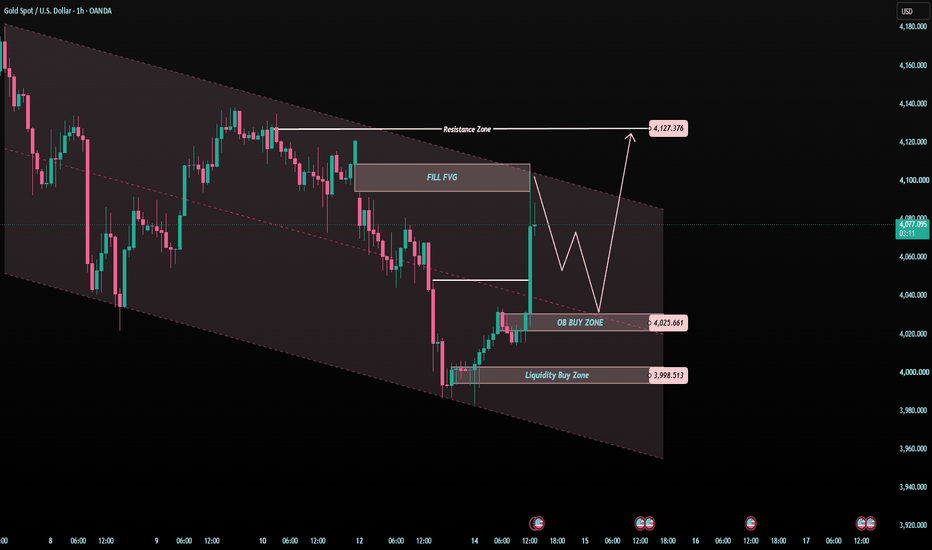
Is Your Last Trade Controlling You?You close a trade, but sometimes the trade doesn't really leave you.
A big loss can make the next setup feel more dangerous than it actually is. A strong win can make an average setup look better than it is. Without realizing it, traders often carry the emotion of one trade directly into the next decision.
The chart may have changed. The setup may be completely different. But mentally, you may still be trading the previous trade.
1. A Loss Can Make You Too Careful
After a painful loss, hesitation feels natural. You find a valid setup, check your rules, and still struggle to enter because your mind remembers what happened last time.
The danger is simple: You are no longer judging the current setup on its own. You are using an old result to measure a new opportunity.
2. A Win Can Make You Feel Smarter Than You Are
Winning creates confidence, but sometimes that confidence quietly becomes overconfidence. After a good trade, traders may increase position size, enter faster, or ignore small warning signs.
Nothing about the next setup has improved just because your previous trade made money. The market doesn't give bonus probability for being on a winning streak.
3. Revenge Trading Isn't Always Obvious
Revenge trading isn't always aggressive clicking or doubling your position. Sometimes it's much quieter: Taking a setup you normally wouldn't take because you want to recover the previous loss.
You may call it an opportunity, but ask yourself: Would I take this exact trade if my last trade had been profitable?
4. Your Brain Loves Recent Results
Recent experiences are easy to remember, so they often feel more important than older ones. One bad trade can suddenly make you question a strategy that has worked across many trades.
This is where traders make unnecessary changes. They adjust rules, switch indicators, or abandon a plan because one recent result feels bigger than the complete picture.
5. Every Trade Needs a Fresh Decision
The next trade doesn't know whether you won or lost five minutes ago. It has its own setup, risk, and probability.
Before entering, ask: "Am I trading this setup, or am I reacting to my previous result?" That one question can expose a surprising number of emotional decisions.
6. Create Space Between Trades
You don't always need to immediately search for the next opportunity. After closing a position, give yourself enough time to mentally finish that trade.
Record the result, note any mistake, and move on. The purpose isn't to forget the trade: It's to stop carrying its emotion into the next one.
7. Judge the Process, Not the Previous Outcome
A good trade can lose, and a terrible trade can make money. If you allow the previous result to control your confidence, your decision-making will constantly move between fear and overconfidence.
Judge your next trade by your rules. Your last P&L should not decide the quality of your next setup.
Conclusion:
Many traders think they're reacting to the current market when they're actually reacting to their previous trade. A loss creates fear. A win creates confidence. Both can distort the next decision when left unchecked.
Your last trade should give you information, not instructions.
Remember: Close the position, review the decision, and leave the emotion behind. The next trade deserves a fresh mind. Education 
Education

GOLD FACING RESISTANCE: BREAKOUT SOON?Despite ongoing geopolitical uncertainty supporting safe-haven demand, institutional flows remain reluctant to abandon the U.S. dollar. Treasury yields continue to hold at elevated levels while markets largely expect the Federal Reserve to maintain a cautious policy stance until inflation shows more convincing signs of easing. As a result, recent strength in gold appears to be driven more by short-term positioning than by a structural shift in macro fundamentals.
From a technical perspective, Gold continues to trade within a well-defined descending channel on the H2 timeframe. Although buyers managed to trigger a short-term Change of Character (CHoCH), price remains trapped beneath the descending trendline, where a confluence of previous Demand, Fibonacci 0.618, and dynamic resistance continues to cap upside momentum. This area represents a key institutional decision point rather than a simple resistance level.
The repeated attempts to challenge the trendline suggest buyers are gradually building pressure. However, without a confirmed Break of Structure (BOS), the broader bearish market structure remains intact. Today's final trading session of the week also increases the probability of liquidity sweeps and false breakouts before the weekly close, making confirmation more important than anticipation.
PRIMARY SCENARIO
Gold could extend its recovery toward the Demand + Descending Trendline + Fibonacci 0.618 confluence. If sellers successfully defend this area once again, price is likely to rotate back toward the 0.50 Fibonacci support, with the 0.382 level becoming the next downside objective.
ALTERNATIVE SCENARIO
Should buyers finally secure a decisive H2 close above the descending trendline and confirm a Break of Structure (BOS), it would suggest bearish momentum is fading. Such a breakout could trigger short covering and open the door for a broader recovery into higher premium zones. Until that confirmation appears, any breakout should be treated cautiously, particularly during Friday's lower-liquidity conditions.
MARKET VIEW
Current Bias: Bearish
Preferred Strategy: Sell the Rally – Wait Confirmation
LucasGrayTrading Short 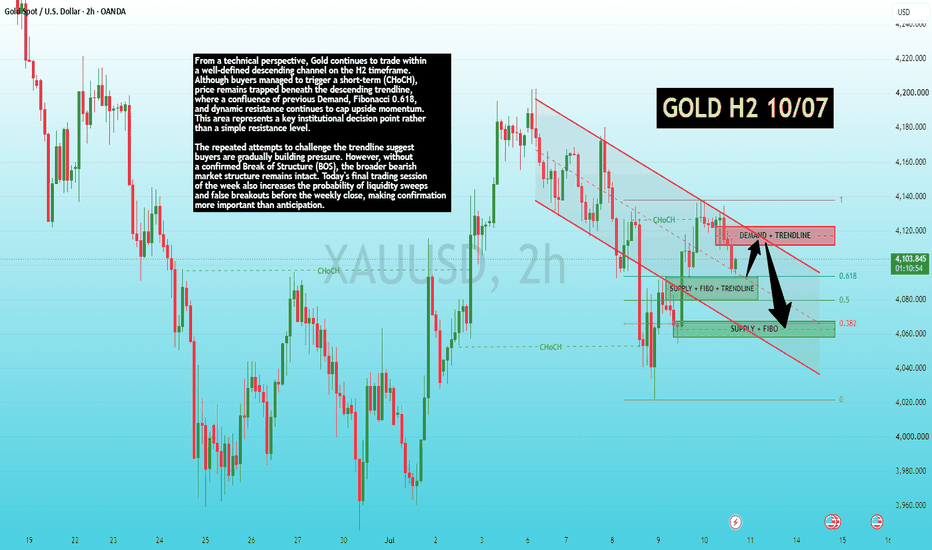
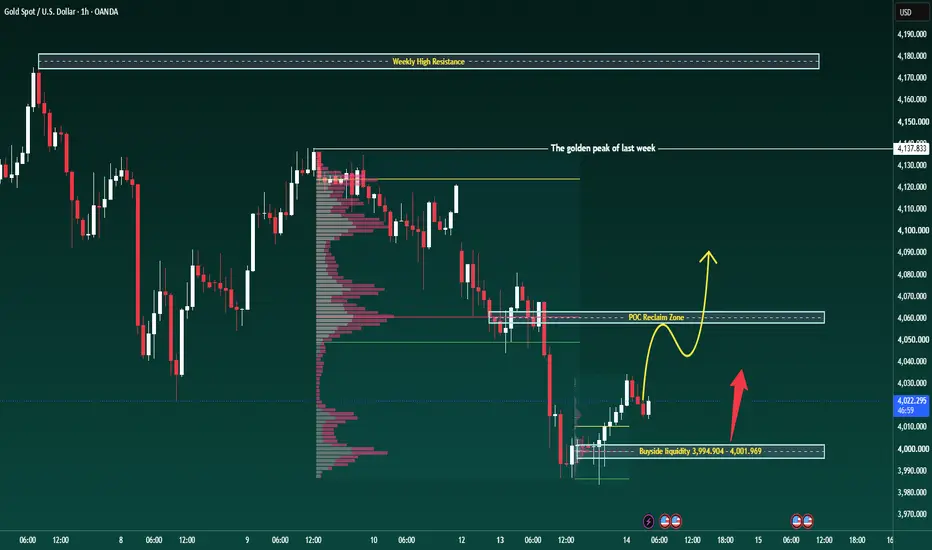
BRIAN XAUUSD – GOLD RECLAIMING FROM LOWER VALUE BEFORE CPI BRIAN XAUUSD – GOLD RECLAIMING FROM LOWER VALUE BEFORE CPI
Gold is starting to recover from the lower value area after reacting around the buyside liquidity zone near 3,995 - 4,002. The move is not strong enough to confirm a full reversal yet, but price is no longer trading with clean downside continuation.
Today’s CPI release can become the main trigger for the next move. Headline inflation is expected to soften due to lower gasoline prices, but the real focus will be on core CPI. That number matters more because it shows whether underlying inflation is still sticky.
At the same time, Fed Chair Kevin Warsh’s first official monetary policy testimony may influence rate expectations and short-term USD direction. For gold, this creates a clear risk event: price can expand quickly once the market receives confirmation.
Technical structure
On the H1 chart, gold has reacted from the lower liquidity base and is now pushing back towards the POC Reclaim Zone around 4,055 - 4,060.
This is the key area I am watching. If price breaks and holds above this zone, buyers can start to rebuild acceptance and open the path towards the golden peak of last week near 4,137.
However, if gold fails at the POC Reclaim Zone, the rebound remains weak and price may rotate back towards the buyside liquidity area.
Important zones
Buyside liquidity: 3,995 - 4,002
Lower reaction zone where buyers stepped in.
POC Reclaim Zone: 4,055 - 4,060
Main value area buyers need to reclaim.
The golden peak of last week: 4,137
Next upside target if price accepts above POC.
Weekly High Resistance: 4,175 - 4,180
Major resistance if CPI triggers stronger bullish momentum.
Trading scenario
Buy reaction after POC reclaim 4,055 - 4,060
Entry:
Look for buy positions only if price breaks and holds above 4,055 - 4,060, then retests this zone with clear bullish rejection.
Stop Loss:
Below the POC Reclaim Zone or below the local swing low.
Take Profit:
TP1: 4,100
TP2: 4,137
TP3: 4,175 - 4,180 if CPI supports further upside
This setup is based on gold reclaiming value after reacting from lower liquidity. Without acceptance above the POC zone, the buy setup remains incomplete.
Final view
Gold is trying to recover before CPI, but the real confirmation is still at 4,055 - 4,060.
If buyers reclaim this POC zone, gold can continue towards 4,137 and possibly 4,175.
If price fails there, the market can rotate back towards 4,000 and the rebound becomes only a weak reaction from liquidity.
Today is not the day to chase candles. Let CPI confirm direction. Let price reclaim value. Then trade the reaction.
Long 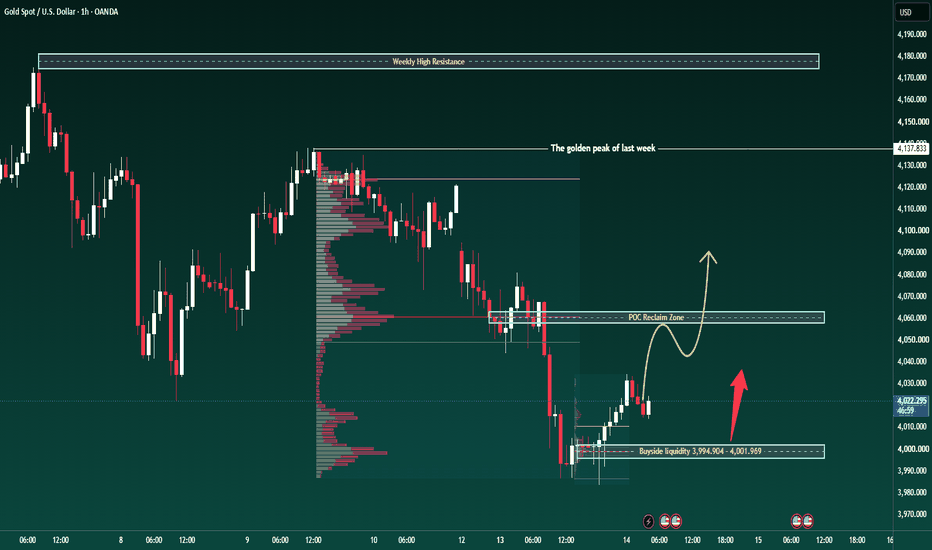
Short 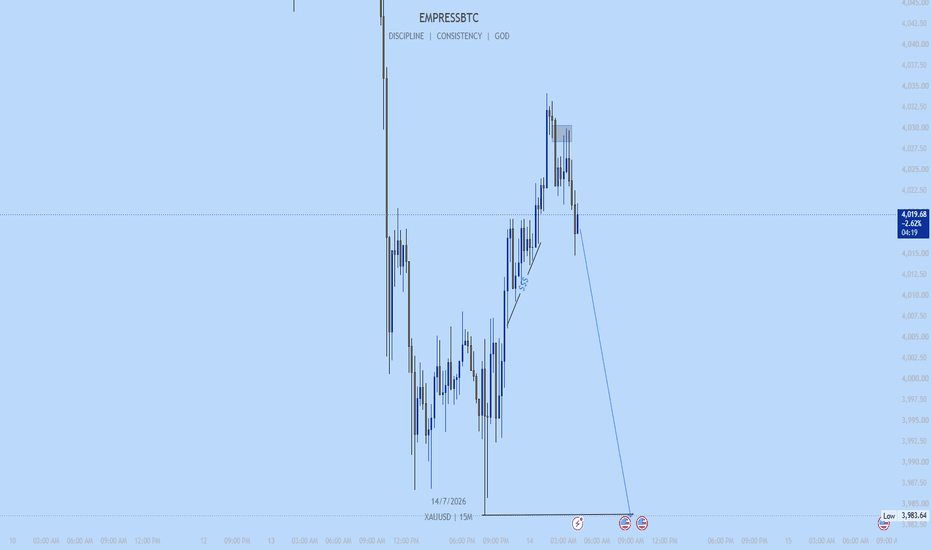
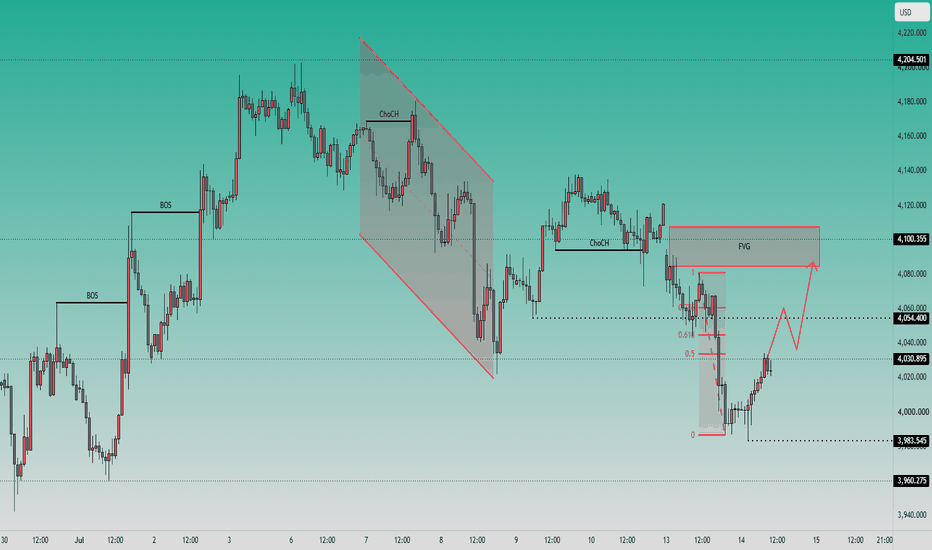
XAUUSD — 3,983 Sparked the BounceXAUUSD — 3,983 Sparked the Bounce
Gold finally gave buyers a small window to breathe, but I do not think this is the kind of move we should read blindly as a full bullish reversal yet.
Price swept down into 3,983.545, grabbed the sell-side liquidity below the recent low, and then started climbing back toward 4,030.895. That reaction matters because the market did not just keep sliding after the sweep. It paused, absorbed the selling pressure, and began walking back up like it wanted to test whether late sellers were trapped near the lows.
For newer traders, this is the main story: when price breaks into a low, pulls liquidity, and then starts recovering, that low can become the starting point of a short-term bounce. In this case, I am leaning bullish while gold holds above 3,983.545, but I am treating it as a recovery move inside a still-heavy wider environment.
The USD has paused after its recent strength, and that gives gold room to rebound in the short term. But with CPI ahead, Fed commentary in focus, and geopolitical tension still supporting USD demand, I do not expect the upside to be completely clean. That is why the next reaction around 4,054.400 is important. If gold can hold above 4,030.895 and reclaim 4,054.400, the upper FVG around 4,085 - 4,100.355 becomes the next area price may want to revisit.
This bullish recovery idea becomes weak if gold loses 3,983.545 again and fails to recover. If that happens, the sweep did not hold, and sellers may start hunting deeper liquidity near 3,960.275.
Key price zones to watch
Current reaction area: 4,030.895
Main demand / sweep zone: 3,983.545 - 4,030.895
Bullish confirmation zone: 4,054.400
Main upside FVG target: 4,085 - 4,100.355
Upper resistance if recovery expands: 4,100.355
Lower support if buyers fail: 3,983.545
Major lower liquidity: 3,960.275
Invalidation: clean close below 3,983.545
Do you see this 3,983 sweep as the start of a real recovery, or just a bounce before CPI brings sellers back in?
Long